When to use a BI solution for finance analysis because Excel isn’t cutting it

For most finance professionals, data can be the key to important insights and the single biggest hurdle to getting answers. Due to the increasing complexity of reporting systems and growing expectations of data-based executives, data gathering and preparation has become too time consuming. Traditionally, Excel has been the ‘solution’ for the various reporting and data needs of finance professionals. However, Excel and other, simple solutions can ‘handcuff’ your analysis once data sets become large or complex.
There are business intelligence solutions with the capability to extract critical insights from your finance data, though. When combined with your ERP data, which is information used to manage company resources such as financial materials, human resources or other company assets, the answers uncovered will drive critical value for the business. This value includes saving time, money, and resources, while enabling critical decisions to improve strategic direction. Meanwhile, challenges that test finance are minimized or solved altogether. For instance:
- Exporting data from disparate systems to Excel since most companies’ General Ledgers don’t load details from source systems (i.e. payroll, travel and expense)
- Data from both open and closed accounting periods can change, and therefore, be difficult to monitor
- Limited access to finance data with tightened company security controls
- Budgeting and forecasting not being in the same system as actuals
Areas that benefit from bringing together ERP and other business data include CRM and sales, procurement, and travel and expense management. And it’s hard to argue the fact that these areas prove the trickiest for finance with so many moving parts. Let’s take a closer look at specific insights that are uncovered and some brief examples of companies seeing value from this higher level of analytics.
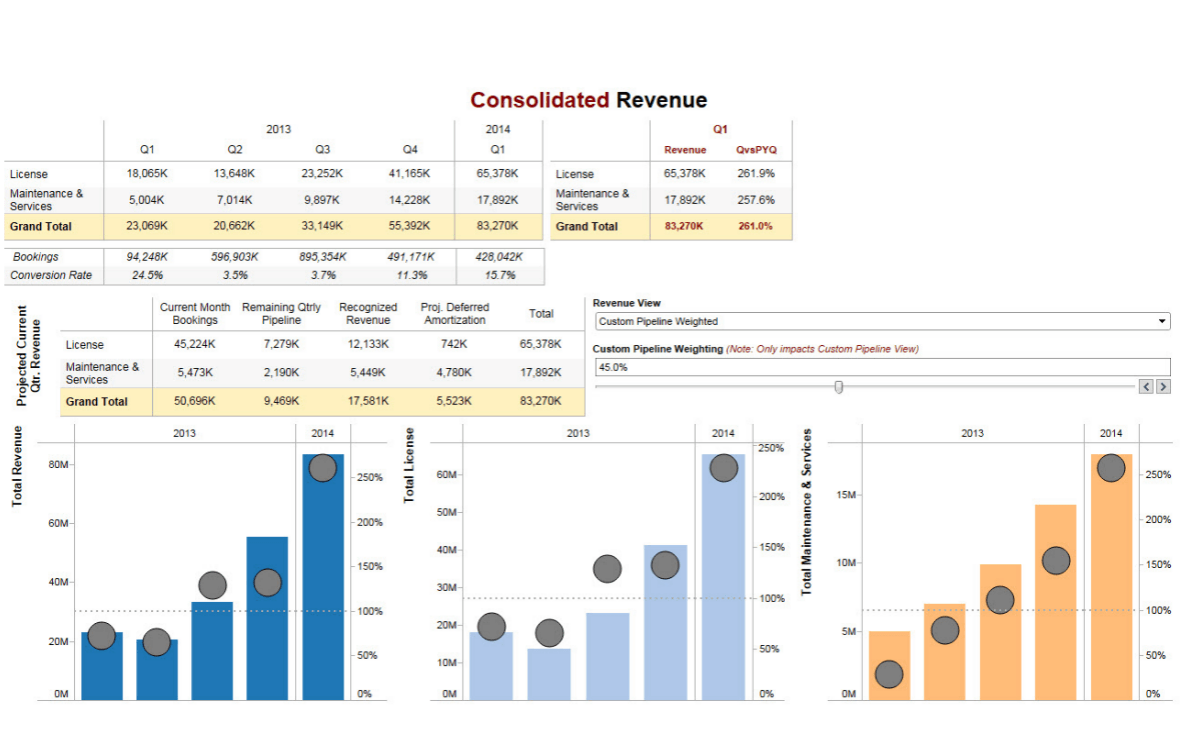
- Visibility of the sales pipeline: Since a company’s sales pipeline can’t be tracked in the general ledger, it’s helpful to have solutions like Tableau that optimize published data sources to allow a view of different departments contributing to income and revenue. Even being able to track quotas and targets becomes critical to understanding if sales objectives are met.
PepsiCo discovered this truth after leveraging unified data and visual analytics to scale “question and answer” cycles for inventory, logistics and finance throughout the company. Their CPFR team relied on Excel to analyze massive quantities of messy data—an inefficient, unsuccessful process for spotting data errors that led to costly outcomes. With visual dashboards, PepsiCo’s financial analysts now spot trends and outliers faster and predict trends, adjust sales, and help sell more product to improve the bottom line.
- Tracking vendors: It’s critical for finance to deliver accurate, timely reporting on purchasing and spending with vendors. By monitoring Coupa data, and having the flexibility to segment by teams, department, and purchase request or drill into the yearly purchase order count, data analytics acts as a workflow management solution. Insights gathered, such as who are the top vendors, reveals where discount negotiation must happen and impacts long-term business profitability.
- Controlling travel spending and expenses: Since Egencia and Concur have simplified the travel and expense reimbursement process, companies have a wealth of data at their fingertips. However, a closer look at the information is also uncovering some important findings. For instance, by observing when staff turns around expense reports, you can see if there’s lag—and sometimes it’s significant. This is an important area where finance analyzing a blend of ERP and finance data helps reduce time and efforts spent on expense accruals and reconciliation. Or, by seeing major expense categories, you can gauge if one area is disproportionate and cost reduction is needed.
Wells Fargo & Co. needed to reduce their third-party spending without impacting business operations. By using Tableau, the finance team identified and stopped spending with non-preferred suppliers in cost centers like office supplies and travel and expense. Uncovering more of the spending details by different departments or individuals as well as insights about suppliers, the company’s year-end travel spending revealed $10 million in transactions.
- Closer reconciliation of cash positions: To better maintain financial health, a real-time view of daily cashflow across geographies and with different currencies, becomes useful. Reviewing that information used to happen infrequently, was time-consuming and cumbersome. That’s now gone by the wayside.
Tableau’s own Treasury team uses visual dashboards for global cash management. The cash flow summary dashboard helps management see what cash flow looks like in aggregate and allows them to drill into data and ask questions such as: “What are the bank balances by currency, by subsidiary, country, banking partner or geography.” You can also filter out transactions that could gross up the numbers like zero balance account structures.
As technology innovation continues to impact and disrupt business, CFOs and their teams have a chance to capitalize on automation technologies for their advantage. Seizing the opportunity to use data analytics solutions that automate manual tasks and offer a view into the business and operations, can strengthen both their professional position and their company’s financial position.
To learn more cost-reduction strategies using Tableau as an important business intelligence solution, tune into our webinar on April 12 at 11 A.M. Pacific / 2 P.M. Eastern.
相關文章
Subscribe to our blog
在收件匣中收到最新的 Tableau 消息。


