すべてのストーリー
 Tableau Research
Digging into Data Landscapes
 2022/10/26
Exploring opportunities to facilitate data reconnaissance through automation and visualization.
2022/10/26
Exploring opportunities to facilitate data reconnaissance through automation and visualization.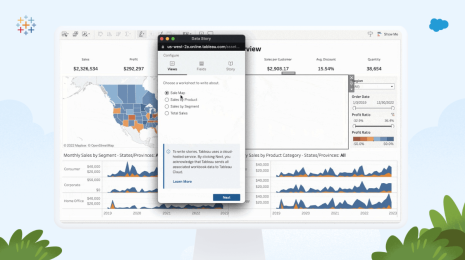 Releases
Inside the Release: Tableau 2022.3 for Analysts and Business Users
 2022/10/25
Learn what’s in Tableau 2022.3 for analysts and business users, including Data Guide, Table Extensions, Dynamic Zone Visibility, and more.
2022/10/25
Learn what’s in Tableau 2022.3 for analysts and business users, including Data Guide, Table Extensions, Dynamic Zone Visibility, and more. Releases
Tableau 2022.3 の新機能 - データガイド、表拡張機能、動的ゾーン表示など
 2022/10/19
Tableau 2022.3 は、データガイド、表拡張機能、動的ゾーン表示など、大規模なデータから簡単にインサイトを引き出すことを可能にする各種の新機能を搭載しています。
2022/10/19
Tableau 2022.3 は、データガイド、表拡張機能、動的ゾーン表示など、大規模なデータから簡単にインサイトを引き出すことを可能にする各種の新機能を搭載しています。
 Visualizations
Exploring Spatial Relationships in Tableau
 2022/10/13
Maps are a great tool to visually analyze spatial patterns. In Tableau, it’s simple to add multiple layers of data on top of a custom base map to easily see patterns.
2022/10/13
Maps are a great tool to visually analyze spatial patterns. In Tableau, it’s simple to add multiple layers of data on top of a custom base map to easily see patterns. Iron Viz
Iron Viz 予選に参加する場合に、時間を節約する方法
 2022/10/12
過去の Iron Viz ファイナリスト、決勝進出者、審査員たちから、予選にエントリーして Viz の作成時間を上手く管理する方法について学びましょう。
2022/10/12
過去の Iron Viz ファイナリスト、決勝進出者、審査員たちから、予選にエントリーして Viz の作成時間を上手く管理する方法について学びましょう。 Europe, Middle East, Africa
World Food Programme uses data to pivot to pandemic medical response
Pierre Guillaume Wielezynski describes how embedding Tableau dashboards into a new service marketplace enabled the World Food Programme to respond to Covid-19 Community Projects
What is the Tableau Community Project—Back to Viz Basics?
If you’re looking for a fun way to connect with data enthusiasts while also reinforcing foundational data visualization skills, Back to Viz Basics (B2VB)—a Tableau Community Project—is the perfect place to start.

Data Analytics: The Key to Unlocking the Retail Advantage
Data analytics provides retailers with a strong business advantage
 Tableau Community
What is a Data Viz Competition?
 2022/09/13
Learn about the key elements that make up a Viz Game, or data visualization competition, in which contestants show off their design, analytics, and data storytelling skills.
2022/09/13
Learn about the key elements that make up a Viz Game, or data visualization competition, in which contestants show off their design, analytics, and data storytelling skills. Partners
3 Tips from Deloitte on Leading a Data Viz Competition with Diversity, Equity and Inclusion
Drawing on the Tableau Iron Viz format, Deloitte’s Viz Games annual data visualization competition helps improve data literacy and strengthen data culture across their organization. Learn three tips on leading a data viz competition at your work—and see the winning vizzes from the teams at Deloitte.

Subscribe to our blog
Tableau の最新情報をメールでお知らせします