
Tableau 2021.2
Ask Data and Explain Data for Viewers, Collections, and a connected Desktop experience for web authoring

Ask Data for Viewers
We’ve broadened the reach of Ask Data by making it available to Viewers. Everyone with a Tableau license can now use Ask Data! We have a completely redefined natural language experience for business users, including seamless integration into dashboards with a new dashboard button. Additionally, a new content type, Ask Data Lenses, makes it easy to curate data with definition of column and value synonyms and suggested questions so you can better leverage existing published data sources.
Start interactive demoAsk Data opens up an opportunity to close the gap between advanced analysts and a broader, general business audience, allowing anyone to connect and explore data. By leveraging Tableau’s modern and fast natural language processing technology, our colleagues are reaching insights faster than ever before. With Explain Data, our team is not only able to see data trends, but can easily identify and understand what’s driving them.

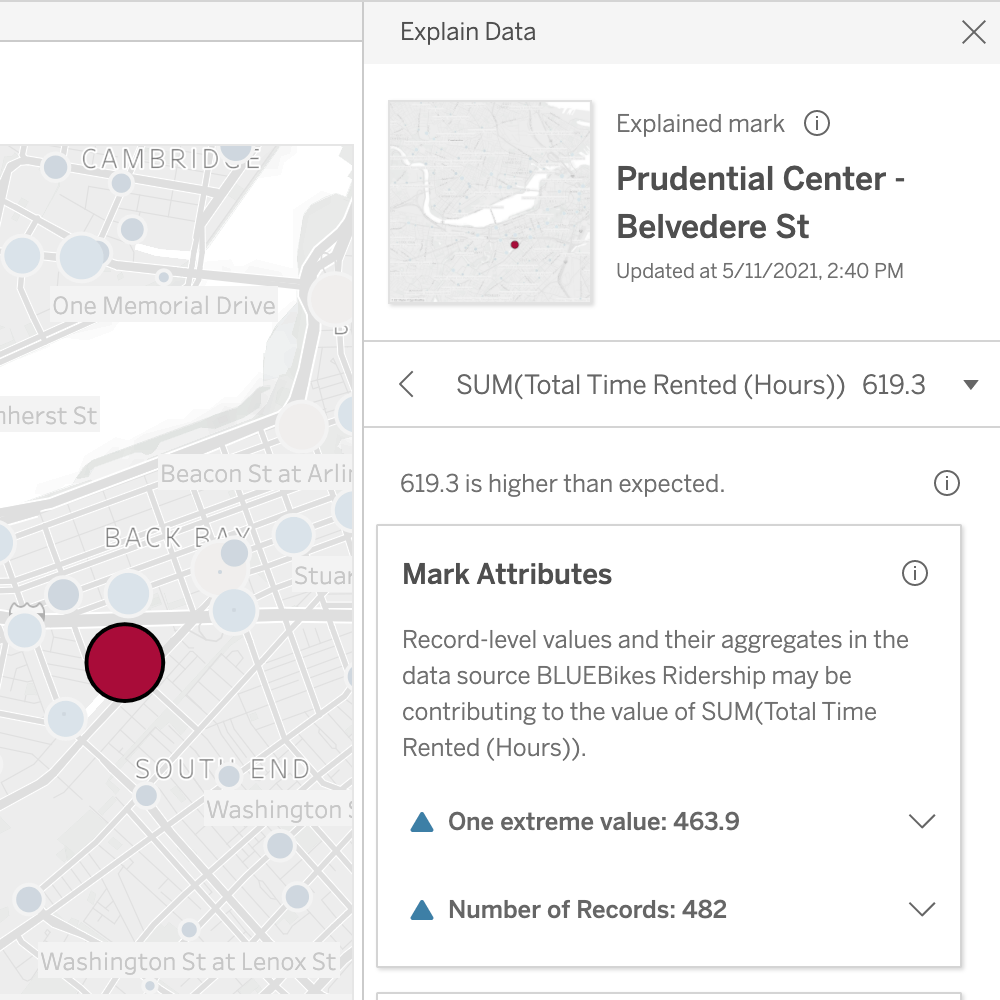
Explain Data for Viewers
We’ve broadened the reach for Explain Data with a reimagined user interface optimized for deeper exploration and a wider business audience. Now available for Viewers, Explain Data makes it easier for anyone to explore and interact with data. When you select a mark and run Explain Data, Tableau proposes possible explanations for that mark based on statistical models. Explain Data gives you a jumping-off point to help you explore data more deeply and ask better questions.
Learn more about Explain Data
Collections
Finding the data you need for your analysis has never been easier. Collections are a new way to gather the content from across your site on Tableau Cloud or Server and organize it to fit how you use it. Collections can contain items that span different projects and workbooks, allowing you to reuse content in multiple contexts without additional storage or resources. And, it’s easy to organize and share content around key topics such as curated resources for new users for onboarding or a center of excellence collection that includes dashboards showcasing best practices.

Tableau 2021.2 Feature Overview
Tune in for an overview of all the new features included in this release.
Watch nowAll Features


Ask Data for Viewers
We’ve broadened the reach of Ask Data by making it available to Viewers. Everyone with a Tableau license can now use Ask Data! We have a completely redefined natural language experience for business users, including seamless integration into dashboards with a new dashboard button. Additionally, a new content type, Ask Data Lenses, makes it easy to curate data with definition of column and value synonyms and suggested questions so you can better leverage existing published data sources.
Explain Data for Viewers
We’ve broadened the reach for Explain Data with a reimagined user interface optimized for deeper exploration and a wider business audience. Now available for Viewers, Explain Data makes it easier for anyone to explore and interact with data. When you select a mark and run Explain Data, Tableau proposes possible explanations for that mark based on statistical models. Explain Data gives you a jumping-off point to help you explore data more deeply and ask better questions.

Collections

Finding the data you need for your analysis has never been easier. Collections are a new way to gather the content from across your site on Tableau Online or Server and organize it to fit how you use it. Collections can contain items that span different projects and workbooks, allowing you to reuse content in multiple contexts without additional storage or resources. And, it’s easy to organize and share content around key topics such as curated resources for new users for onboarding or a center of excellence collection that includes dashboards showcasing best practices.

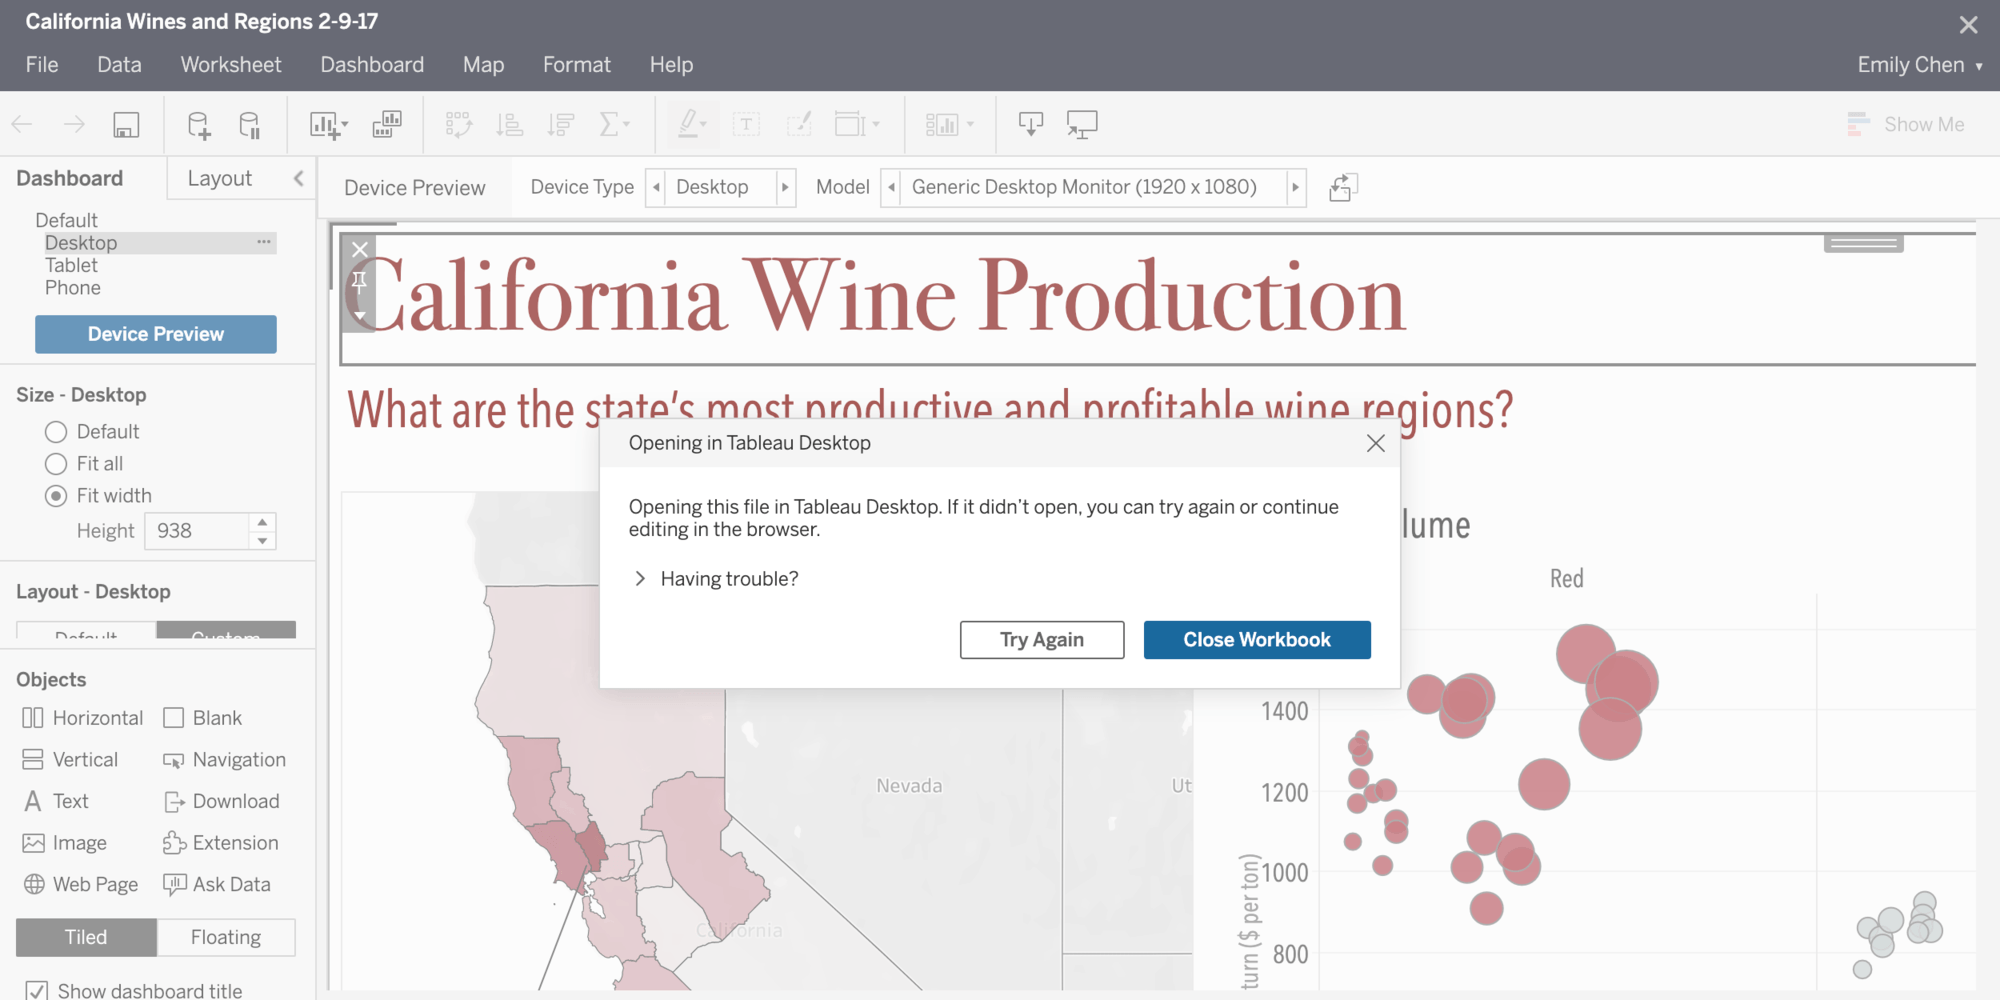
Connected Desktop for web authoring
Enjoy a more cohesive and flexible web authoring experience. Creators can now transition seamlessly from web authoring to Tableau Desktop with a click of a button. Start your workflow in web authoring and choose to transition to Desktop at any point in your analysis—without having to download the workbook. When you’re finished, simply save to Tableau Online or Server so your content reflects the latest changes for others in your organization.


Area spatial calculation
With the area spatial calc, you can now measure the square area of your selection on a map in units that you specify. Combined with the power of spatial joins, answering location-based questions is easier than ever. For example, you can now easily calculate the total acres of multiple parks you've selected on a map. Or, a business could use this to calculate population densities to inform about where to place a store.


Map layer control
When viewing a worksheet or dashboard that includes a map, consumers now have the flexibility to control the visibility and interactivity of the marks layers without editing the workbook. When enabled by the author, users can simply use the new toggle settings to customize the map view to best answer their own location questions and analysis.

Tableau Server on Linux in a container
Containers are fast becoming the standard way for businesses to leverage the cloud by increasing availability, orchestrating large deployments, and sharing infrastructure. This deployment option adds the ability for our customers to run Tableau Server on Linux in a single container, making production and development deployments easier, faster, and potentially more cost effective.


Write to Google BigQuery
With 2021.2, Tableau Prep expands its output capabilities to include Google BigQuery, in addition to the existing databases outlined here. This enables you to add or update data in Google BigQuery with clean, prepped data from your flow each time the flow is run.


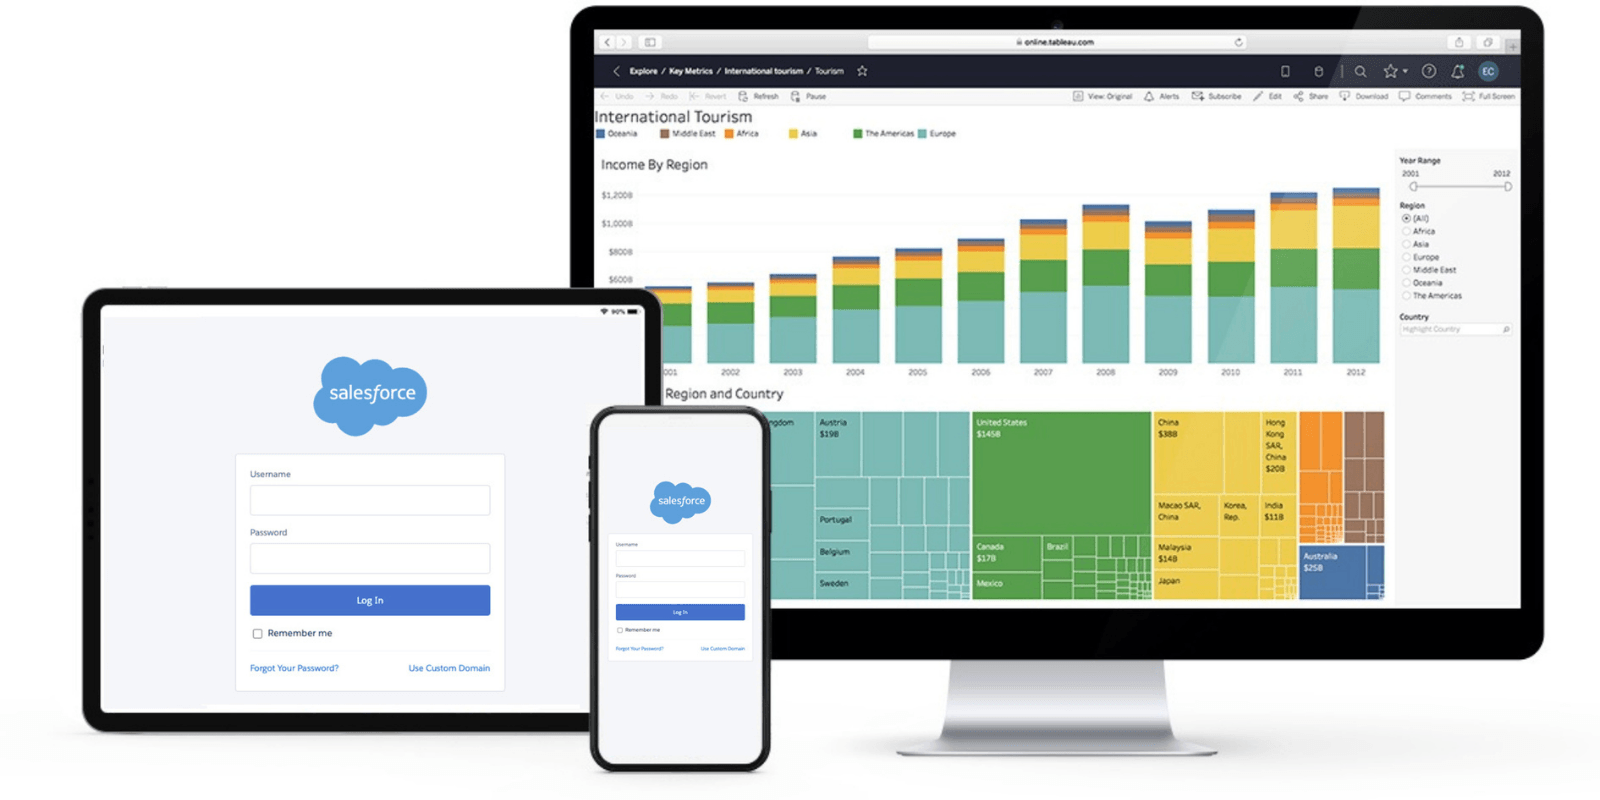
Tableau ID + MFA
We're excited to provide Tableau ID + MFA (Multi-Factor Authentication) to our Tableau Online customers which provides them with the ability to enable MFA on their sites. MFA is one of the easiest, most effective tools for enhancing login security, and safeguarding your business and data against security threats.


Web authoring improvements
Expanded formatting options
Further customize your dashboards with the ability to format worksheet backgrounds, titles, and captions on the web.
Parameter and set actions
You can now create parameter actions and set actions within web authoring.
Expanded filter options
You can now define and edit Top N and Condition for discrete filters, unlocking more advanced filtering for data source and on-sheet filters.


Multiple Analytics Extensions per site
Multiple Analytics Extensions per site allows organizations to use multiple analytics extensions within each Tableau Server or Tableau Online site. Teams can now use advanced analytics and predictions from Python and R, multiple different TabPy servers, or Einstein Discovery and TabPy in visualizations all in the same environment. Administrators can configure multiple connections in the Site Settings page, and connections are now added at the workbook level, either in web authoring or on publish.
Use the HyperAPI and REST API to improve data freshness
Build solutions that connect Tableau much more efficiently with a variety of data freshness technologies and use it for operational monitoring and analytics scenarios. You can now push updates to extract files through the REST API and HyperAPI on Tableau Server or Online to enable more flexibility, efficiency, and ultimately improve the freshness of your data.


Bulk Scoring in Prep Web Authoring and Prep Conductor
Write ML predictions (scores) from Einstein Discovery directly into your data sets in Tableau Prep Web Authoring and Tableau Prep Conductor. This integration allows you to score data in bulk including writing in key drivers of predictions and improvements.


Bulk Rename in Prep Builder and Prep Web Authoring
With Bulk Rename, you can now rename multiple fields at one time in Prep Builder and Prep Web Authoring, rather than individually change each field name. You can now add/remove/rename a prefix at the start of a field name, add/remove/rename a suffix at the end of a field name, as well as do pattern matching for 'find and replace' within a field name.
SAP HANA performance improvements
HANA bind variable support is now enabled by default. Bind variables allow HANA to route correctly in a multi-node HANA environment, and allow for plan cache re-use for any HANA environment. In addition, maximize Tableau’s use of HANA’s bind variable capability when connecting via JDBC.

Tableau Mobile for Intune (Android)
Tableau Mobile for Intune is a new app that provides a quick and secure way to view, analyze and leverage the data in your organization. The new app includes a newer design that is faster and more intuitive, an improved search and browsing experience consistent with Tableau Server and Tableau Online, as well as enhanced offline capabilities that are quick to load and offer richness and interactivity for visualizations.

Amazon SageMaker for Tableau Quick Start
For organizations that are already investing in machine learning, Amazon SageMaker for Tableau provides a unique opportunity to communicate and share ML with anyone, via self-service analytics. With a few clicks, you can now use models built on Amazon SageMaker directly within your favorite Tableau dashboards to fully leverage the predictive power of ML.


Inherited descriptions in Tableau Desktop
With Tableau Catalog, you can now see inherited descriptions right within Tableau Desktop. If a description for a field or a column exists upstream from that field or column in a published data source or a workbook, it appears in Tableau Desktop with information about where the description is inherited from.
Learn More About Tableau Releases