Embedding Playground
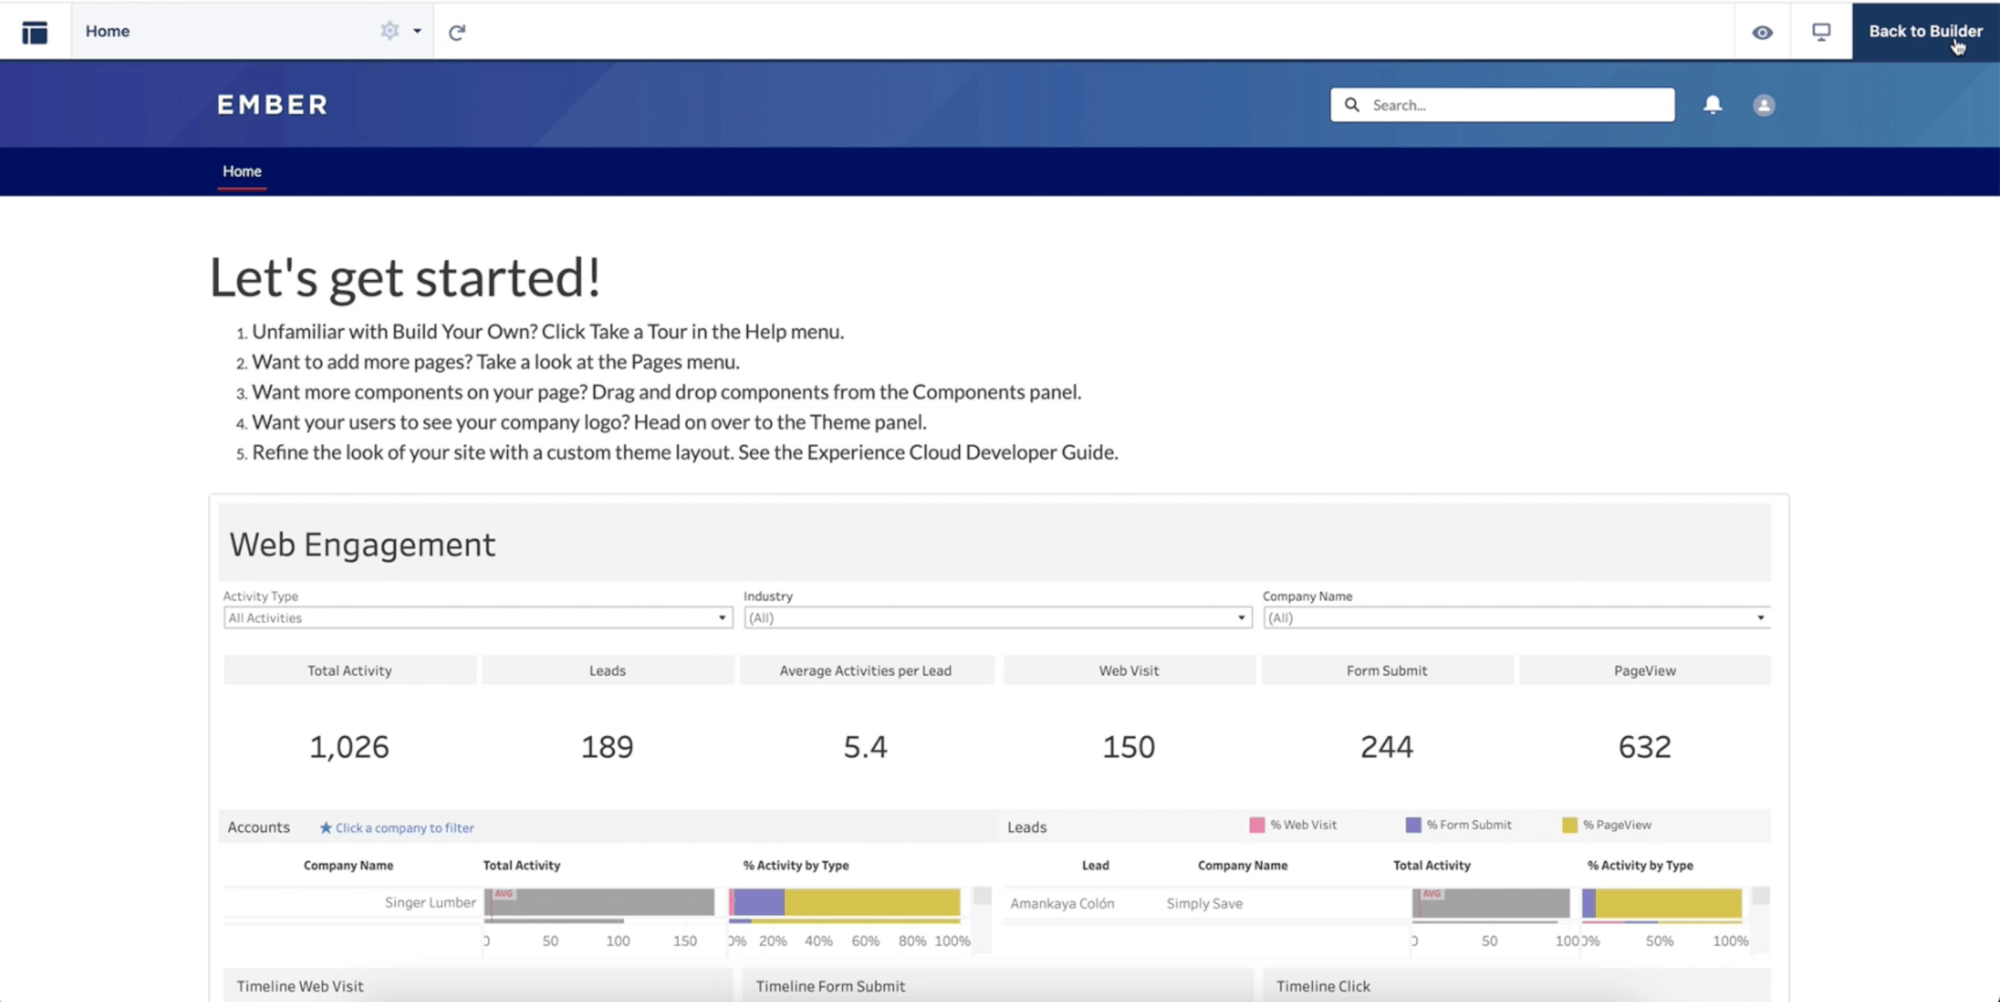
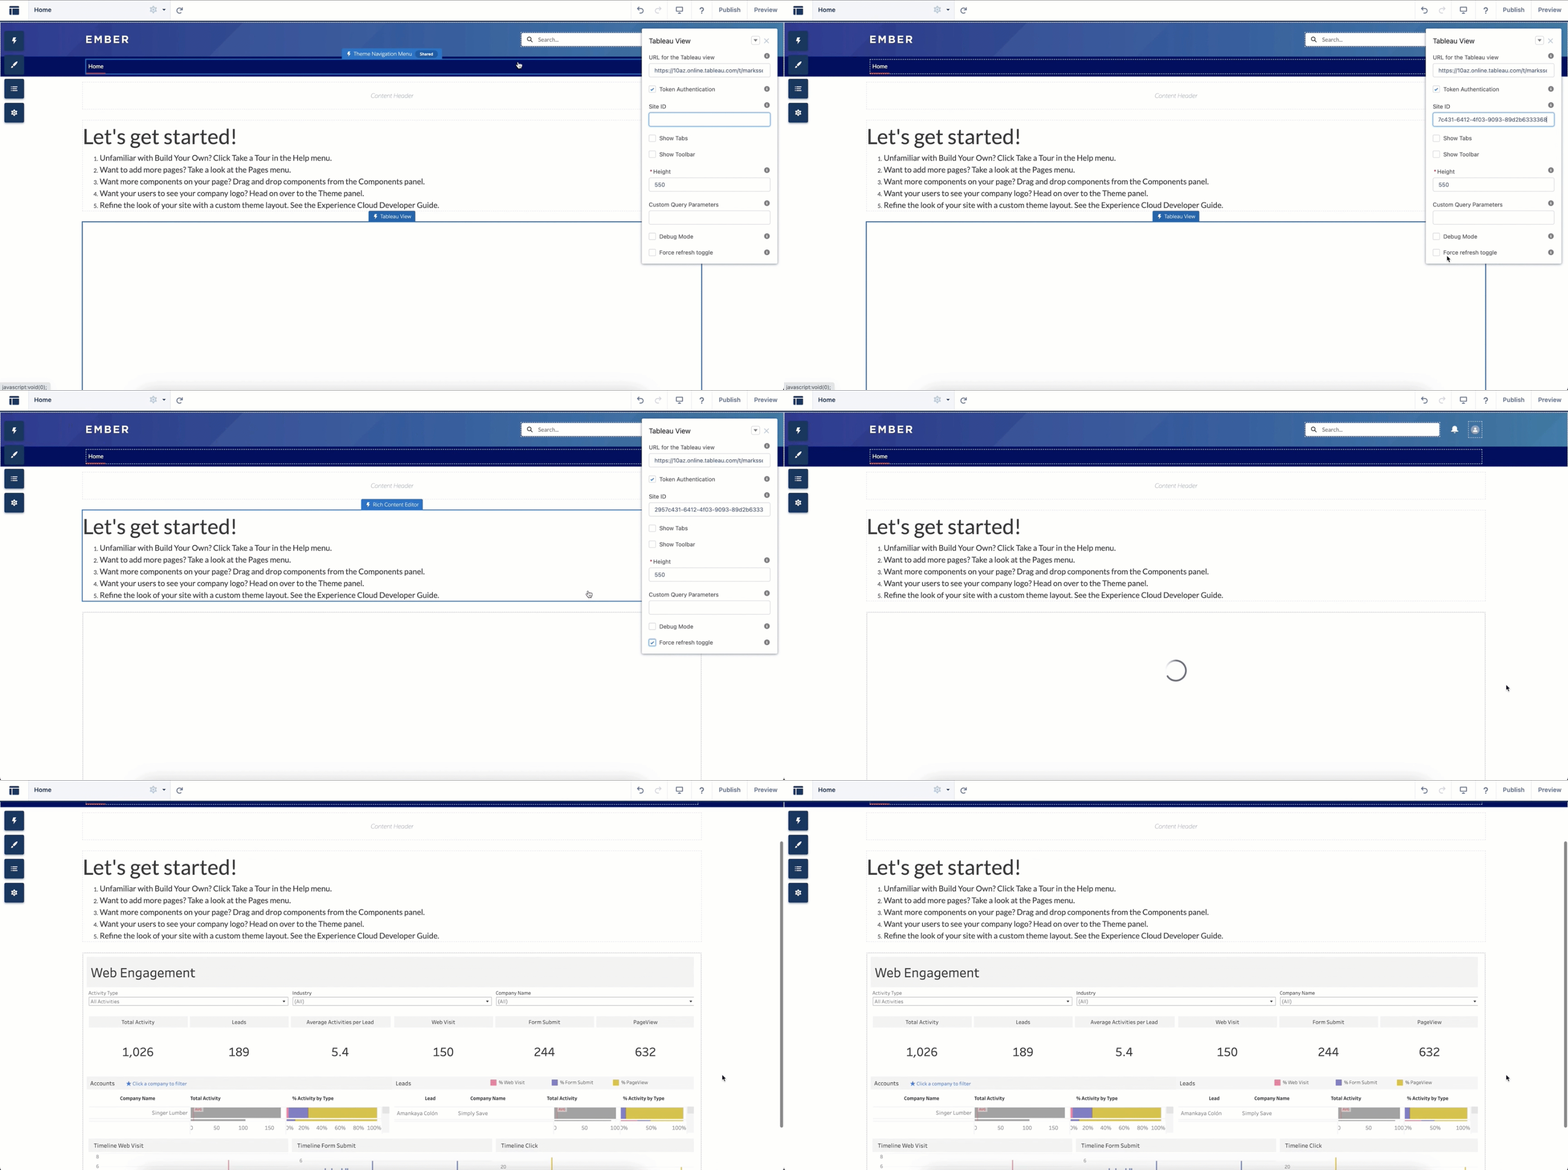
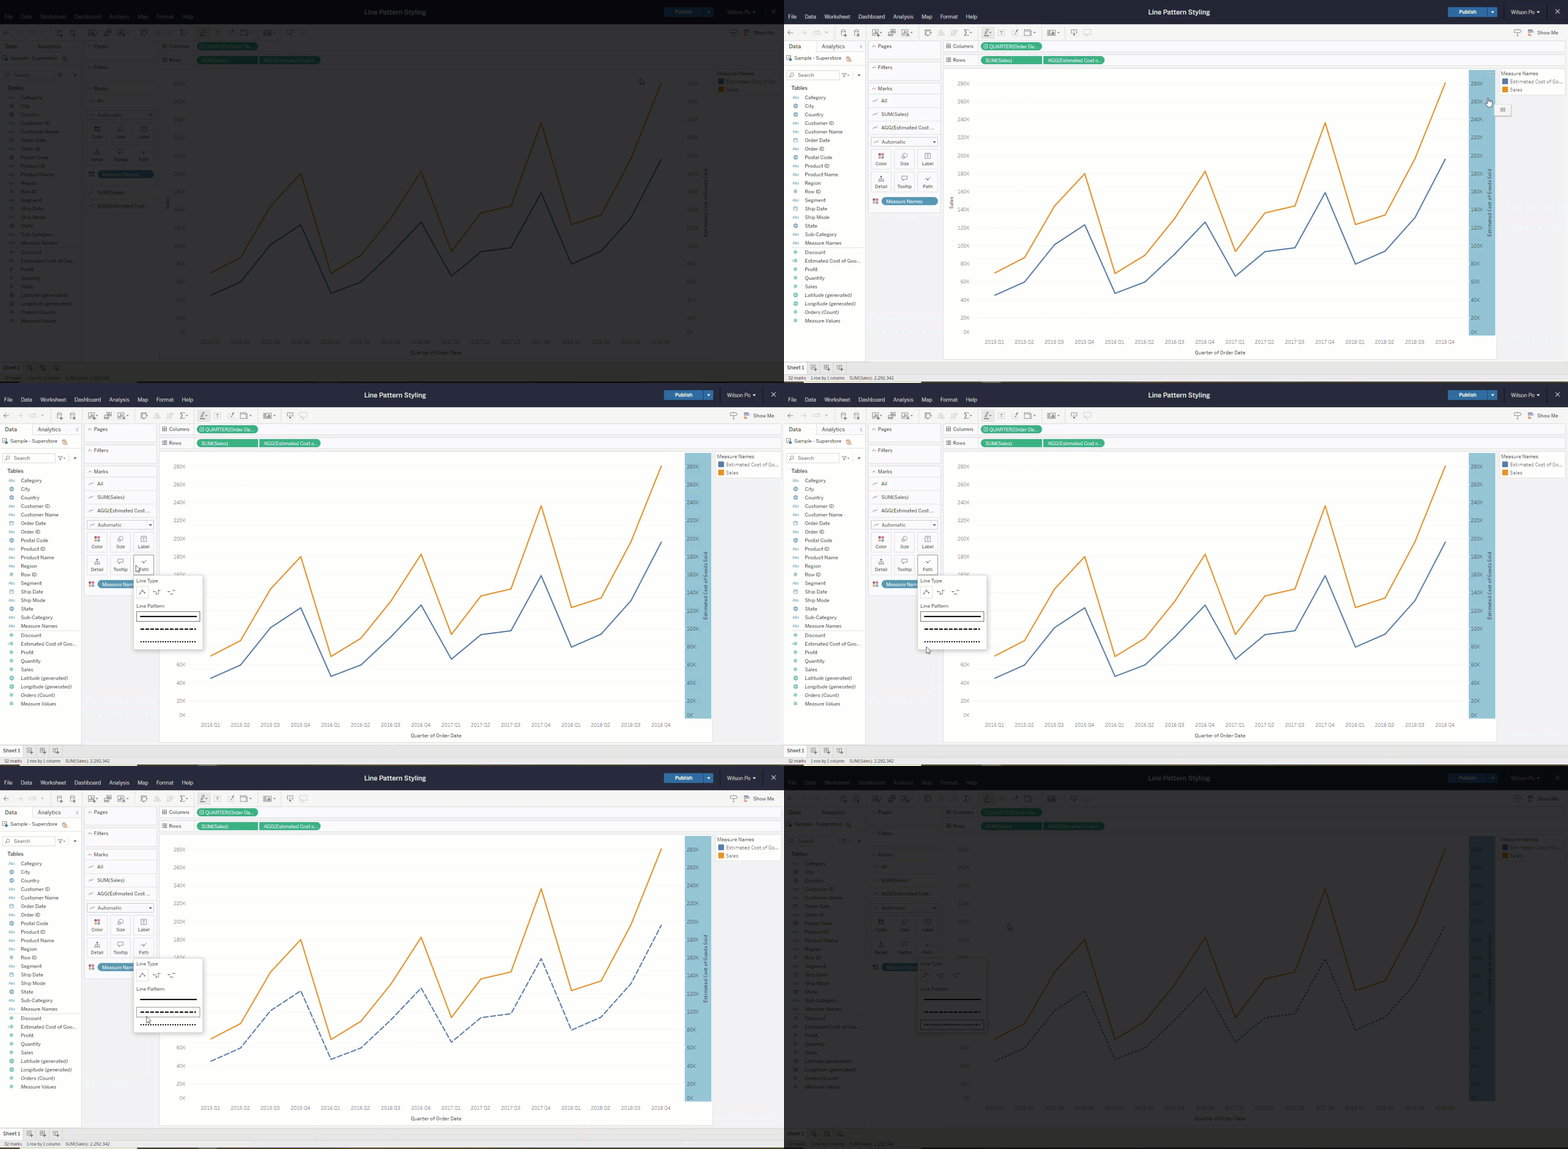
在短短幾分鐘內迅速開發自訂程式碼。Tableau Embedding Playground 是互動式的學習環境,可供您實際體驗關鍵內嵌分析功能。在 Embedding Playground 中,您可快速建立可匯出的程式碼,將互動式視覺效果內嵌到您的應用程式中。探索新的可能性、利用功能進行實驗,並獲得啟發,讓您的內嵌分析解決方案提升到嶄新境界。現已推出。

自訂資料標籤
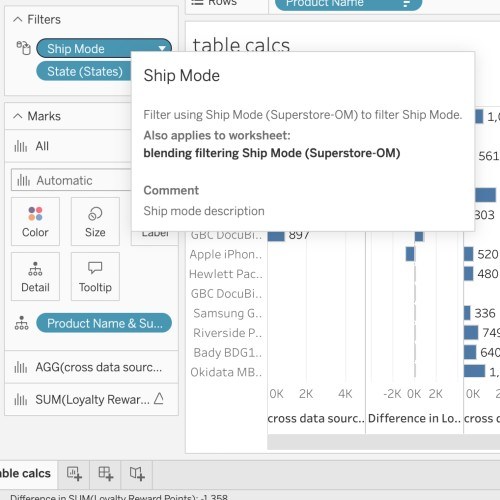
在 Tableau 中將資料分類,讓資料更容易被發現。多年來,我們在 Tableau 中推出數項標籤功能,包含認證、資料品質警告與敏感度標籤。自訂資料標籤正是此系列功能的延續。管理員現在可定義自訂資料標籤供 Creator 和 Explorer 新增至資料資產,藉此提升 Tableau 中的探索與稽核作業。您也可以使用資料標籤 API,允許第三方應用程式針對非在 Tableau 中建立的中繼資料新增標籤至 Tableau 站台,此類中繼資料包含資料庫與資料表等上游內容中的中繼資料。
動態軸範圍
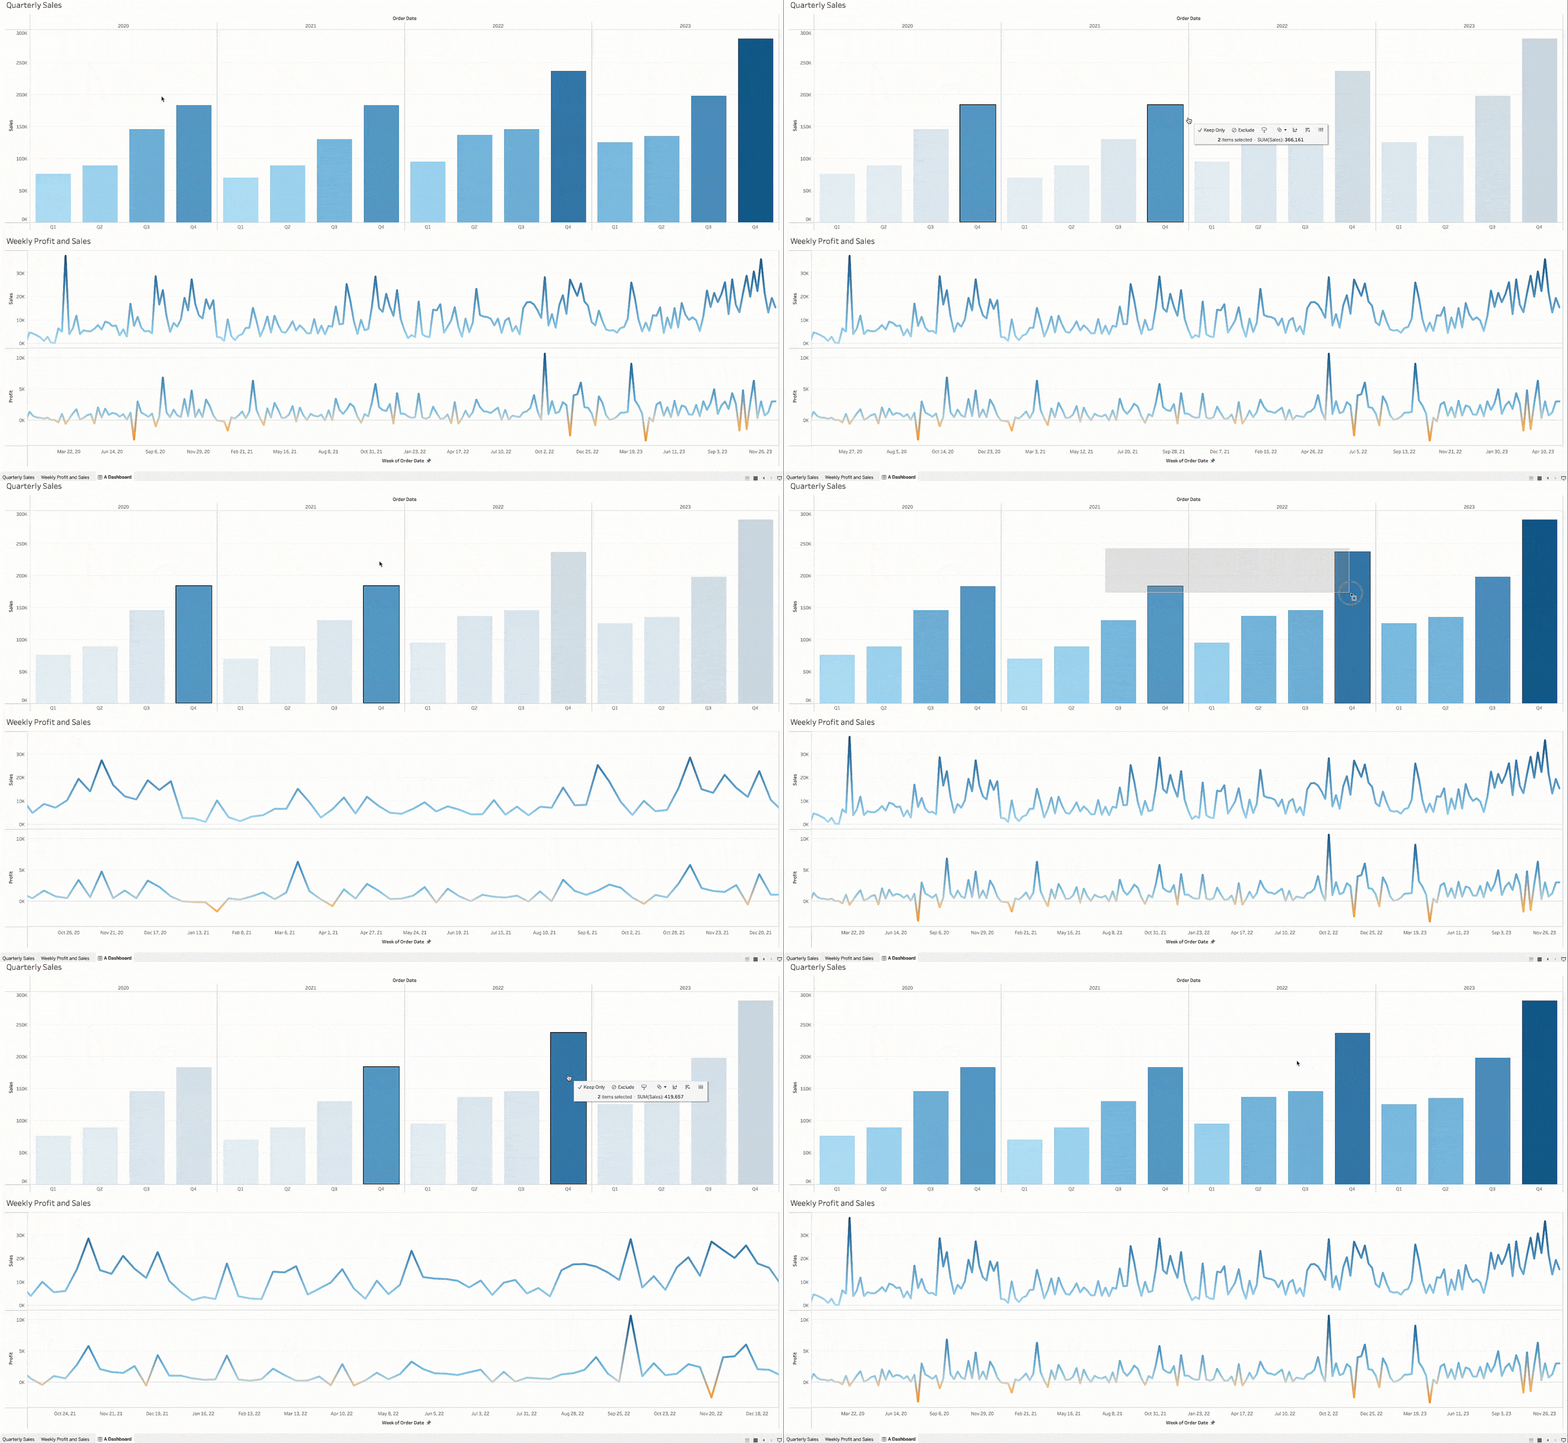
使用工作簿中的參數值來設定軸範圍,建立出更加動態的視覺效果。此功能讓您可選取不同的參數做為每個軸範圍。您可以只設定單一動態軸界限(只設定開始或結尾),或使用相容的欄位設定兩個界限。
所有功能

Google Workspace Tableau Cloud 附加元件
在工作流程中取得資料見解。這項功能是我們與 Google 的最新合作結晶,可讓使用者在 Google 文件中快速預覽 Tableau Cloud 視覺效果。Google Workspace 中有個項目稱為 Google 智慧型方塊。透過與智慧型方塊整合的 Tableau 整合功能,指向 Tableau Cloud 視覺效果的連結會立即轉換為縮圖檢視,其中顯示 Tableau 視覺效果的名稱、上次更新日期及預覽影像。系統會即時產生縮圖,因此一律顯示最新資料!您也可以在 Tableau Cloud 中按一下視覺效果,即可開啟視覺效果進一步探索。Google Workspace Marketplace 中現已推出。

Embedding Playground
在短短幾分鐘內迅速開發自訂程式碼。Tableau Embedding Playground 是互動式的學習環境,可供您實際體驗關鍵內嵌分析功能。在 Embedding Playground 中,您可快速建立可匯出的程式碼,將互動式視覺效果內嵌到您的應用程式中。探索新的可能性、利用功能進行實驗,並獲得啟發,讓您的內嵌分析解決方案提升到嶄新境界。現已推出。

Desktop 中可編輯視覺效果替代文字
您現在能進一步控制視覺效果的替代文字。現在,您可以編輯自動產生的替代文字。Tableau 預設會提供自動化的螢幕報讀軟體文字,確保所有線上視覺效果皆具備可供螢幕報讀軟體唸出的說明,包含用戶端與伺服器端呈現的視覺效果,以及內嵌的視覺效果。現在,內容作者只要透過「資料輔助」面板,或在「工作表」下拉式功能表中選取「無障礙使用」,即可編輯替代文字。作者也可新增最多 2500 個字元的替代文字,為視覺效果的內容提供深入的見解。
這些功能之前在 Tableau 2023.2 的其他 Tableau 產品中發佈,現在於 Tableau Desktop 2023.3 中提供。
進一步瞭解 Tableau 版本相關資訊


