

Embedding Playground
Rapidly develop custom code in a matter of minutes. The Tableau Embedding Playground is an interactive learning environment where you can gain hands-on experience with key embedded analytics capabilities. In the Embedding Playground, you can quickly create exportable code to embed interactive visualizations into your application. Discover new possibilities, experiment with capabilities, and get inspired to take your embedded analytics solution to the next level. Available now.

Custom Data Labels
Make your data more discoverable by categorizing it within Tableau. Custom data labels are a continuation of a set of labeling features we've brought to Tableau over the years, including certifications, data quality warnings, and sensitivity labels. Admins can now define custom data labels that Creators and Explorers can add to data assets for improved discovery and auditing within Tableau. You can also use the Data Labels API to allow third-party applications to add labels to a Tableau site for metadata not created in Tableau, such as those in upstream content like databases and tables.
Dynamic Axis Ranges
Create more dynamic visualizations by using the value of parameters in the workbook to set axis ranges. This feature allows you to select different parameters to use as each axis range. You can have a single dynamic axis extent (just start or end) or can set both extents using compatible fields.
All Features

Dynamic axis ranges
Create more dynamic visualizations by using the value of parameters in the workbook to set axis ranges. This feature allows you to select different parameters to use as each axis range. You can have a single dynamic axis extent (just start or end) or can set both extents using compatible fields.

Custom data labels
Make your data more discoverable by categorizing it within Tableau. Custom data labels are a continuation of a set of labeling features we've brought to Tableau over the years, including certifications, data quality warnings, and sensitivity labels. Admins can now define custom data labels that Creators and Explorers can add to data assets for improved discovery and auditing within Tableau. You can also use the Data Labels API to allow third-party applications to add labels to a Tableau site for metadata not created in Tableau, such as those in upstream content like databases and tables.
Native Lightning Web Component for Tableau
Take your data insights where your users are. You can now embed Tableau Vizzes into Salesforce via Lightning Web Component and seamlessly authenticate with Trusted Tokens using Connected Apps. This allows for a more seamless analytics experience where CRM Analytics charts and Tableau visualizations can be viewed in the same experience, all within Salesforce. Tableau Component filter parameters also allow filters to pass from a CRM Analytics Dashboard to a Tableau Component and vice versa to keep them in sync.


Tableau Cloud add-on for Google Workspace
Get data insights in the flow of work. With our latest partnership with Google, users can quickly preview a Tableau Cloud visualization from within Google Docs. With the Tableau integration with Google Smartchips for Google Workspace, links pointing to a Tableau Cloud visualization are instantly converted to thumbnail views showing the Tableau visualization’s name, last updated date, and a preview image. Thumbnails are generated on the spot, always showing the latest data! You can also click to open the visualization in Tableau Cloud for further exploration. Available now in the Google Workspace Marketplace.

Embedding Playground
Rapidly develop custom code in a matter of minutes. The Tableau Embedding Playground is an interactive learning environment where you can gain hands-on experience with key embedded analytics capabilities. In the Embedding Playground, you can quickly create exportable code to embed interactive visualizations into your application. Discover new possibilities, experiment with capabilities, and get inspired to take your embedded analytics solution to the next level. Available now.
On-demand access
On-demand access allows Embedded Analytics Usage-Based Licensing customers to establish a connected authentication system between their application and Tableau Cloud. With on-demand access, customers can use Tableau’s Connected Apps functionality to assert users and permissions at the time of access. You can now maintain a single source of truth for user identities, roles, and privileges in just your application instead of having to create, sync, and/or maintain those accounts in Tableau too.

Fill down and running calculations
Get faster data insights as multi-row calculations are now even more powerful and more accessible for you. Now, you can use the visual calculation editor to replace null values with the last non-empty value in a column, also known as "fill down," and create running calculations. Alternatively, you can write custom calculations using the new RUNNING_SUM() , RUNNING_AVG(), and LAST_VALUE() functions in the calculation editor.

Stratified sampling in Prep
When working with large datasets, you can use stratified sampling to capture a sufficient number of records from an infrequent category as you explore, clean, and shape your data. The new stratified sampling algorithm allows you to group by a specified column and then sample data within each subgroup. Prep will returns an equal number of rows distributed across the selected column for grouping to ensure you get a representative sample.


Set header and data start row for CSV/Text Files
Tableau Prep users can now easily specify the schema of CSV/text files structured when the header isn’t on the first row. Instead, you can set the header and/or data start rows explicitly in the settings of the input step for CSV/text files then move on to subsequent cleaning and shaping!

Write datasets to Data Cloud from Prep
Write datasets from Tableau Prep into Data Cloud. Once you've set up an Ingestion API connector and deployed to a Data Stream, you can save your outputs to Data Cloud. With this feature and the previously released Data Cloud connector it's easier to connect Data Cloud and Tableau Prep.
Virtual connections support all connectors in Tableau
Data access, management, and security become seamless with virtual connection enhancements. Any connector type supported in Tableau is now also supported in the Virtual Connection editor. The connectors include support for Microsoft OneDrive, Apache Drill, Apache Spark SQL, Cloudera Hadoop Hive, Datorama, Dremio, IBM DB2, Kyvos, and Qubole Presto.

Bridge for Linux
Make your Tableau architecture more streamlined with support for Linux. You can now deploy the Tableau Bridge client within a container on Linux, which eliminates the need for a Microsoft Windows-only desktop application. This allows for automation and streamlining of Tableau Bridge to meet the large-scale enterprise needs through containerized workloads.

Bridge support for embedded data sources
Make connecting your data easier with Bridge enhancements. Tableau Bridge now supports embedded data sources and published data sources, allowing Tableau Cloud authors to use the data source type best suited to their needs. This update also significantly reduces the time and effort required to migrate from Tableau Server to Tableau Cloud. Existing content requiring Bridge can now be migrated as-is rather than converting embedded data sources to published ones.

Activity Log enhancements
Gain greater control over your Tableau environment. You can now use the Activity Log as the single source of truth for site audits and track site activity in near real-time. Tableau introduces over 100 types of usage events to the Activity Log, including access, create, update, and delete events for all content types.

Admin Insights Tokens data source
Keep your site safe and operational by monitoring authentication tokens. Admin Insights now includes a Tokens data source, which is a list of the unexpired Personal Access Tokens (PATs), OAuth client tokens, and OAuth database tokens. Using the Tokens data source, you can create a report that shows when tokens will expire, so you can proactively renew the tokens needed to keep your site running smoothly. You can also easily see who has PATs and tokens assigned to help you identify any tokens that may need to be revoked.
Suspend extract refreshes for inactive data sources
Automatically suspend extract refresh tasks for inactive published data sources to save backgrounder and server resources. This feature applies to full extract refreshes that occur more frequently than once a week. Incremental refreshes and those that occur less frequently than weekly are not impacted.

Autosave enhancements
You now get even more support from the Tableau autosave feature to improve productivity. The latest enhancement to autosave automatically saves modifications made while editing a new, never-published workbook to a draft. You no longer need to publish your work immediately to preserve your progress. This update allows you to pick up where you left off conveniently, iterate on your work, and refine it before deciding to publish.

Login flow enhancements
Tableau Cloud has now updated its login page to improve discoverability and ease of use. Tableau Cloud home page now has improved text rendering and displays contextual information on the Site URI through a Learn More link. The home page also auto-populates the username on the login page when a cookie exists for a user from previously having selected the “Remember me” option and reduces the number of steps to display the site list for applicable users.

Editable viz alt text in Desktop
You now get enhanced control over viz alt text. You can now edit automatically generated alt text. By default, Tableau provides automated screen reader text, ensuring a description is announced by screen readers for all online visualizations, including client and server-side rendered and embedded visualizations. Now, content authors can edit the alt text from either the Data Guide panel or by selecting Accessibility in the Worksheet drop-down. Authors can also add up to 2500 characters of alt text, providing deep insight into the contents of the visualization.
Previously released in other Tableau products in Tableau 2023.2, these capabilities are now available in Tableau Desktop 2023.3.

Command cancellation
Easily cancel a time-consuming command to drive analyst productivity and reduce frustration. You can now pause updates to a visualization when you execute a command that takes a long time. You will be prompted with a cancel button to pause all auto updates. When you want to re-enable auto-updates, you can use the menu bar at any time.

Accelerators in the Desktop start pane
Find the right Tableau Accelerator for your needs with ease. The updated Accelerator experience on the Desktop Start Pane gives you access to a rotating selection of Accelerators and better differentiates between Accelerators and Sample Workbooks. You can now quickly launch one of the featured Accelerators, jumpstart your analysis, or browse for more using the in-product Exchange.

Table fonts for web authoring
Get greater control over the look of tables. You can now set the fonts for tooltip, totals, and grand totals on a worksheet while web authoring. With greater control over font options, you can better differentiate totals and grand totals so they stand out from the rest of your data. Font options will dynamically display based on the contents of the viz.

RHEL 9 support for Server
Tableau gives enhanced deployment flexibility with Red Hat Enterprise Linux (RHEL) support. Customers can now deploy Tableau Server to RHEL 9 as a supported OS. This release of RHEL is designed to meet the needs of the hybrid cloud environment and is ready for you to develop and deploy from the edge to the cloud.

Line Patterns
Line Patterns offer new styling capabilities, allowing an author to select any trend line to be represented as a solid, dashed, or dotted lines. This new capability makes it easier to convey nuance when representing multiple trends, where styling can help to convey when certain lines represent unique context, such as thresholds or modeled data points.
Previously released in other Tableau products in Tableau 2023.2, this capability is now available in Tableau Server 2023.3.
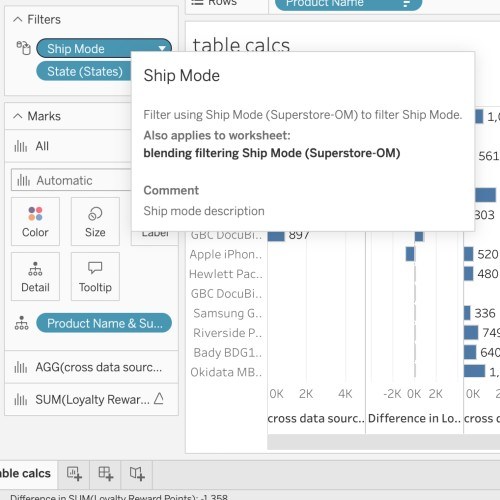
Unified Tooltips
Get more context for your in-shelf pills with new tooltips. Unified Tooltips combine up to six previous tooltips into one that prioritizes information based on relevance. Get the field name, table calc details, and field comments in a single place. Any error messages or filter information now displays in the same tooltip. This unified tooltip is available for pills on all shelves.
Previously released in other Tableau products in Tableau 2023.2, this capability is now available in Tableau Server 2023.3.

Amazon Athena connector: 3rd party IdP support
Use industry leading 3rd party identity providers such as Azure AD or Okta to manage secure authentication to Amazon Athena data sources. Using the OAuth configuration for an identity provider, you have increased flexibility and security of connections, along with multi-factor authentication, to important data in Athena.
Previously released in other Tableau products in Tableau 2023.2, this capability is now available in Tableau Server 2023.3.


Image Role enhancements
Image Role is easier and more flexible with the recent enhancements. Image Role has expanded image file type support, now including those in SVG, WEBP, JFIF, ICO, BMP, and GIF format in addition to images in PNG, JPG, and JPEG format. Image Role can also now handle up to 100 images per column and increased image fetching to allow images up to 200kb. You can also access the Remove requirement with no need for Image Links to contain extensions.
Previously released in other Tableau products in Tableau 2023.2, these capabilities are now available in Tableau Server 2023.3.

Data Driven Alert REST API
Our new REST API endpoint enables you to create Data Driven Alerts for visualizations with a single axis. Now you can programmatically create data-driven alerts so key people are notified in their email, Tableau site, and connected Slack workspaces when data reaches thresholds.
Previously released in other Tableau products in Tableau 2023.2, this capability is now available in Tableau Server 2023.3.

Geospatial analysis enhancements
Geospatial analysis with Tableau is more comprehensive than ever. New enhancements to the spatial calculation language allows you to answer a broad range of questions from your geospatial data. Outline creates new formatting options, ShapeType enables new pivots based on geometry type (e.g. distinct treatments of roads vs. regions), and Length creates new opportunities for route planning. We've also made it easier to bring spatial geometries into Tableau by supporting the full GeoJSON language during import.
Previously released in other Tableau products in Tableau 2023.2, these capabilities are now available in Tableau Server 2023.3.

Usage Metrics enhancements
Total shares is now displayed as a Metric in the Usage tab along with total favorites and total views. With these insights, analysts can better understand engagement so they can build content that resonates with their audience. Viewers can leverage Usage Metrics to validate that the content is widely used and trustworthy.
Previously released in other Tableau products in Tableau 2023.2, this capability is now available in Tableau Server 2023.3.


Card navigation improvements
We've made navigating the content grid view more accessible by adding full keyboard navigation support, including selection and batch actions.The focus indicator has also been improved, so you can better understand which item you're interacting with or navigating to. Content metadata is also easier to access via a popover widget.
Previously released in other Tableau products in Tableau 2023.2, this capability is now available in Tableau Server 2023.3.

Analytics Extensions enhancement
Now you can compress requests sent to and responses from your Analytics Extension server. This will help you avoid running into payload constraints when using Table Extensions that involve large datasets. To enable this capability, Analytics Extensions admins can set flag 'gzip_enabled' to True.
Previously released in other Tableau products in Tableau 2023.2, this capability is now available in Tableau Server 2023.3.
Learn More About Tableau Releases