Tableau 2019.3 Features
Explore the newest features in Tableau 2019.3 including Explain Data, Tableau Catalog,
and Tableau Server Management Add-on
New feature highlights
Tableau Catalog
With Tableau Catalog you get a complete view of all of the data being used by Tableau, and how it is connected to your analytics – including lineage, impact analysis and usage metrics. Increase the trust and discoverability of the right data for everyone in your organization. Tableau Catalog is part of the Data Management Add-on.
Learn more about Tableau CatalogExplain Data
Explain Data automatically provides AI-driven explanations for unexpected values in your data with a single click. Available as you’re creating a viz or dashboard, Explain Data uses powerful Bayesian methods to surface statistically significant explanations behind data points. Behind the scenes, hundreds of potential explanations are checked and the most likely ones are surfaced. Every explanation is a viz that can be explored with the full power of Tableau, keeping you in your analytical flow as you dive deeper into your data.
Learn more about Explain DataExplain Data allows anyone, whatever their level of data knowledge, to explore their data and ‘go beyond the number’ to understand not only the what, but also the why – the true definition of democratizing data.
Tableau Server Management Add-on
The Tableau Server Management Add-on gives organizations running Tableau Server at scale greater manageability and control over their deployment. We’re making it easier to streamline management processes and run large, mission-critical Tableau Server deployments. This new offering provides AWS KMS integration, new performance monitoring and content management apps, and additional scalability capabilities for Tableau Server.
Learn more about Server Management Add-onComing to you from Tableau HQ in Seattle!
Tune in for an overview highlighting the innovations of Tableau 2019.3.
Watch nowTableau 2019.3 deep dive
Join analytics and Tableau experts as they outline Tableau’s latest release. Learn more about the recent innovations that help you build trust in your data and help users quickly go from the “what” to “why” more effectively.
Sign upAll Features
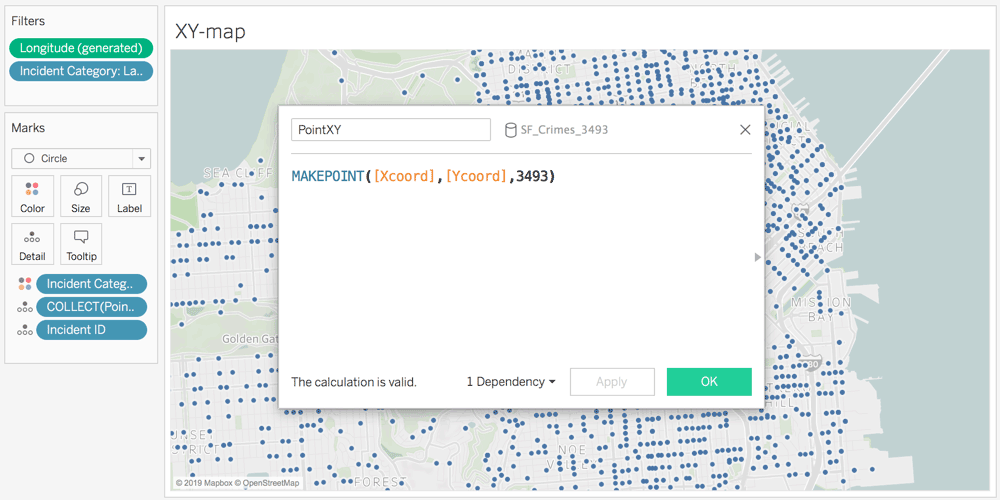
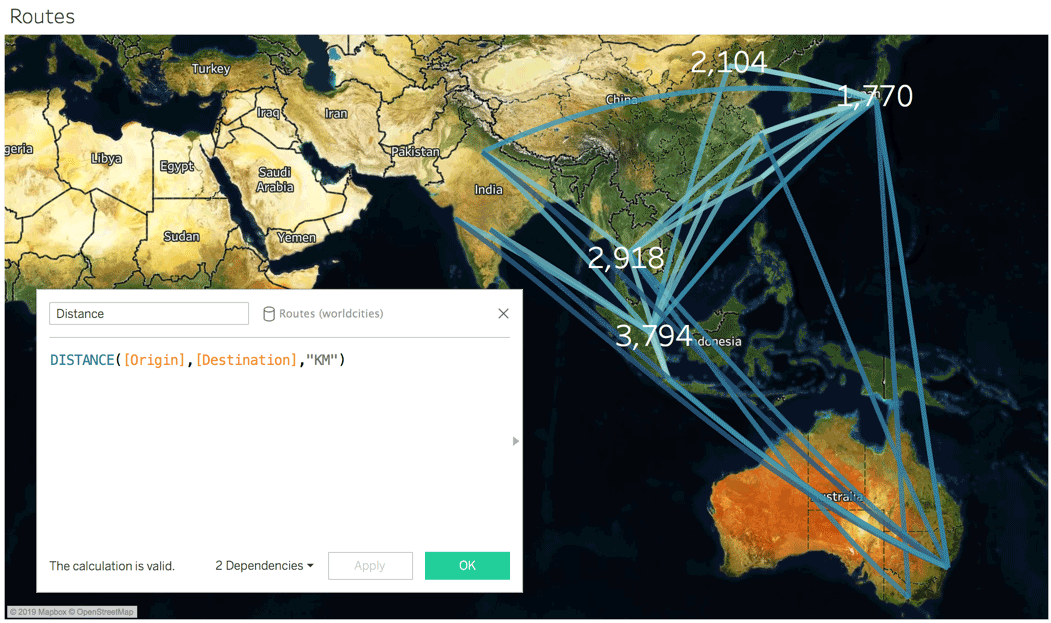
Spatial calculations: MakePoint improvements
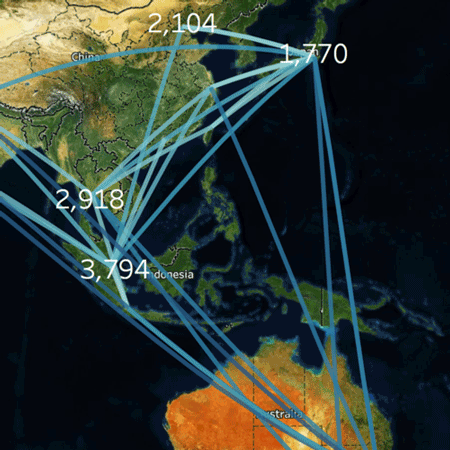
You can now convert projected coordinates for locations, which might be in feet or meters, into latitudes and longitudes that Tableau can visualize and use in spatial joins. For instance, the Seattle Police Department logs location data using a local projection in US Feet, and can now use MakePoint to convert it directly into useable lat/long coordinates.
Tableau Catalog
With Tableau Catalog you get a complete view of all of the data being used by Tableau, and how it is connected to your analytics – including lineage, impact analysis and usage metrics. Increase the trust and discoverability of the right data for everyone in your organization. Tableau Catalog is part of the Data Management Add-on.
Learn moreTableau Server Management Add-on
Advanced Management for Tableau Server gives organizations running Tableau Server at scale greater manageability and control over their deployment. We’re making it easier to streamline management processes and run large, mission-critical Tableau Server deployments. This new offering provides AWS KMS integration, new performance monitoring and content management apps, and additional scalability capabilities for Tableau Server.
Learn moreExplain Data
Explain Data automatically provides AI-driven explanations for unexpected values in your data with a single click. Available as you’re creating a viz or dashboard, Explain Data uses powerful Bayesian methods to surface statistically significant explanations behind data points. Behind the scenes, hundreds of potential explanations are checked and the most likely ones are surfaced. Every explanation is a viz that can be explored with the full power of Tableau, keeping you in your analytical flow as you dive deeper into your data.
Learn moreExtract Encryption at Rest for Tableau Server
For additional security you can now encrypt your extracts at rest. You can also think of this as object-level encryption. It’s easy to use—simply toggle it on per extract or enable at the site level. Tableau Online is already fully encrypted at the service level.
Learn moreHyper API
Hyper API ประกอบด้วยชุดฟังก์ชันที่คุณสามารถใช้เพื่อปรับการโต้ตอบกับไฟล์การแยกข้อมูล Tableau (.hyper) ให้เป็นระบบอัตโนมัติ คุณสามารถใช้ API เพื่อสร้างไฟล์แยกข้อมูลใหม่ หรือจะใช้เพื่อเปิดไฟล์แยกข้อมูลที่มี แล้วจึงเพิ่ม ลบ อัปเดต หรืออ่านข้อมูลจากไฟล์เหล่านี้ก็ได้ เรียนรู้เพิ่มเติมเกี่ยวกับ API หรือดาวน์โหลดที่นี่


