Success with social media data—at any stage
If you’re a digital marketer, social media is probably a key part of your marketing strategy. But if the idea of proving out the ROI of your social media presence to your marketing leaders keeps you up at night, you’re not alone. Research from DMA shows that “only 48% of marketers agree that social media gives them any return on investment.” Gathering and analyzing social media data comprehensively and connecting it across all platforms to show the value of your social programs is no easy feat.
So how do you know if your team is measuring performance with the right social media metrics? To answer this, you need to understand what problems you're trying to solve. Before diving into the data, you must have key performance indicators (KPIs) that support your objectives and align with revenue attribution models. Each social platform has unique audiences and definitions for metrics on engagement, reach, and more, as well as native reporting. So before you step in front of senior leaders to report on social media performance, understand what you’re trying to accomplish with your programs and have clear goals in place.
Approach social media data with metrics in mind
When you're determining which social metrics matter, be cautious of committing to KPIs that may not be measurable. If you don’t have access to the right data to back up a KPI, don’t plan to include these metrics in your goals until that data becomes available. Understand that some in-platform metrics help measure impact or influence on business goals—like reach, website visitors (returning and net-new), actions on your website or app, and the cost for those actions, such as cost per acquisition (CPA). Other metrics may require tying together a social post or ad impression and click with business critical actions, such as: filling out a form, submitting credit card information, or buying something in-store.
Depending on the maturity of your analytics strategy, you may already be answering the below questions, but review them to frame your thinking and 2019 planning. Here are things to consider:
- What are you using your social channels for? (e.g., grow awareness, convert leads, engage with clients and community, etc.)
- What are your paid social goals? What are your campaign goals?
- Can you measure success with platform data alone or do you need additional data sources?
- Do you understand who your website visitors are? Can you compare them with your social followers?
- Are you able to quantify the cost of acquisition and lifetime value for each customer?
Formal social metrics need data points to map back to and establish a method by which your stakeholders and leaders can track performance.
Social analysis is relative to analytics maturity
Once you've determined metrics that are aligned with marketing analytics goals, you'll need to access and analyze social data to measure success. Sounds simple enough, right?
Viewing insights natively within Twitter, LinkedIn, and Facebook is straightforward. Analyzing data and identifying trends across platforms is another story. If you're trying to create a comprehensive view of performance so you can slice and dice the data, it’s necessary to export your social data outside the platform.
How should you approach deep analysis of your social data? Start by being honest about the maturity of your marketing analytics program. Early on in your journey, you should be able to track your basic performance and report by platform. As your analytics organization matures, reporting on your social data across platforms and campaigns should be happening on a regular cadence. Next, focus on gathering insights across platforms and attribute social data to benchmarks that inform platform ROI and plan your budget accordingly. If your social analytics program has the previous steps in place, you should be in a comfortable position to predict and forecast investments across channels and regularly report on the ROI of all your platforms.
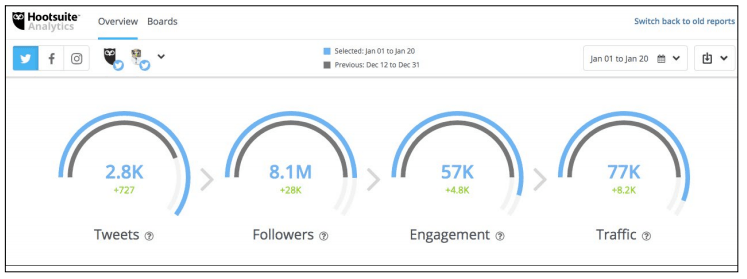
For reporting, there is a variety of approaches also aligned with your analytics program maturity. Application programming interfaces (APIs) offer direct and automated access to your social platform pages and advertising data, allowing you to access all of this information in in one place. If you’re using third-party tools like AdStage, SproutSocial, or HootSuite, these platforms aggregate data and assist you in focusing on different priorities with their report templates.

A screenshot of the Overview tab of social platform performance from Hootsuite Analytics.
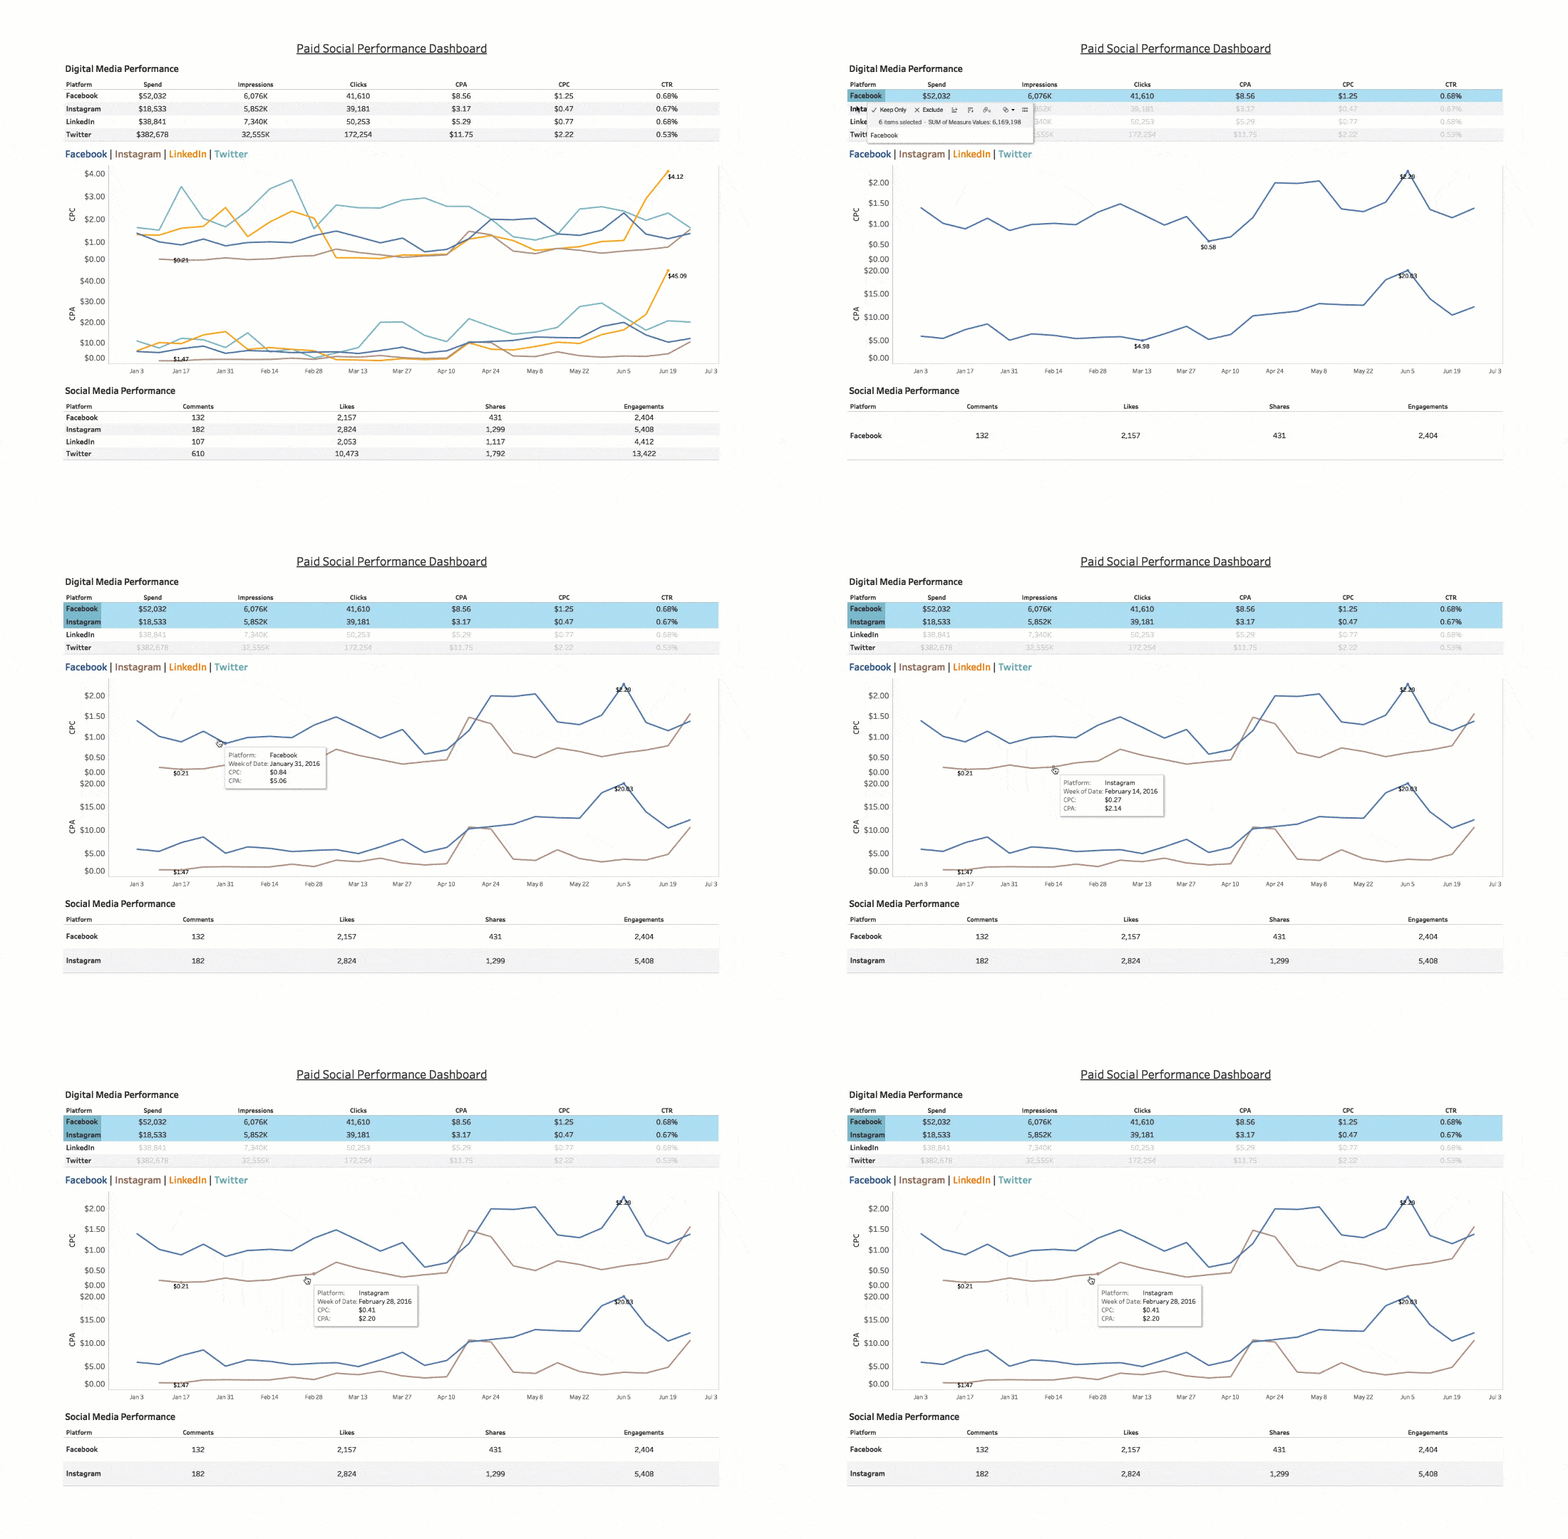
Other APIs that connect with a BI platform, like Tableau, and social data sources help you access your data and create high-level, aggregate dashboards for your team, senior leadership, etc. When you create social media dashboards in Tableau with a live API connection, you have more control over the data and how you visualize it, customizing the view for your audiences to tell a compelling story. This particular set-up means you only need to create dashboards once and they will update automatically on a monthly or quarterly basis—depending on your reporting cadence. These dashboards offer quick insights into the performance of paid social ads, the paid social budget for the month, or anything else your marketing department is reporting on.
When comparing your platforms next to each other, look for macro trends, especially in different regions. Are fluctuations in performance seasonal, related to campaign launches, or caused by something else?
Monitor your cost per click or acquisition throughout the week and see if there are ebbs and flows that you can take advantage of—potentially optimizing your ads on a daily basis. As new trends and technologies emerge, you'll need to prepare your strategy—and your reporting—to reflect these changes.
Here’s an example of a marketing visualization that you can use for discovering patterns and insights in your social media data.

Look for a social media whitepaper coming in early 2019 for more guidance on managing your social media data.
2019 data trends include social media
One of the trends we’re seeing in the business intelligence space this year is data storytelling. This trend applies to social media reporting. Workplace cultures are shifting to being more data-driven, requiring you to communicate analytical insights to a more diverse audience of business users. Data storytelling is considered to be "critical or important to business intelligence initiatives" to 75% of respondents from a Dresner 2018 Market study, and social media analytics is not exempt.
Besides being a highly sought-after career skill, telling a story with data helps your stakeholders better understand details within your social media performance and also cultivates open conversations about channels or campaigns. For example, adding context and increasing engagement.
Having more users engaging with your data means that being a good data steward is more important than ever. It goes without saying that it's necessary to maintain ethical data practices while working with your social data—remaining in compliance with your internal code of ethics, the Global Data Protection Regulation (GDPR), and other data privacy measures.
With greater governance, expect to do more manual digging and data preparation for how GDPR changes the way you collect, manage, and analyze Facebook, LinkedIn, Twitter, and other platform data related to EU citizens. Your aggregate platform data remains highly valuable for informing other media buying or indicating potential shifts in your audience.
Regardless of how new trends and data collection changes affect social media analytics, understanding the clear goals you’re trying to achieve with your social channels and the business problems you’re trying to solve will ground your organic and paid social programs—and show your marketing leaders that you have data at the core of your social media analytics.
To discover how Google Cloud Platform (GCP) and Tableau unify marketing data, creating a single source of truth and making your marketing department truly data-driven, view this ebook.


