Roundup of examples of Viz in Tooltip from the Tableau Community
What better way to kick off a new year than with new Tableau features?
In the week following the launch of Tableau 10.5, there are already loads of great examples and use cases of the new features including Nested Projects, new connectors (including our Box connector), and Annotate and share. In particular, it’s been incredible to see how quickly Tableau Public authors have published workbooks using the dynamic Viz in Tooltip.
These authors aren’t just vizzing away in Tableau 10.5; they’re writing about and sharing their learnings along the way.
It’s my pleasure to share a roundup of vizzes, tips, and tricks that beautifully demonstrate Viz in Tooltip.

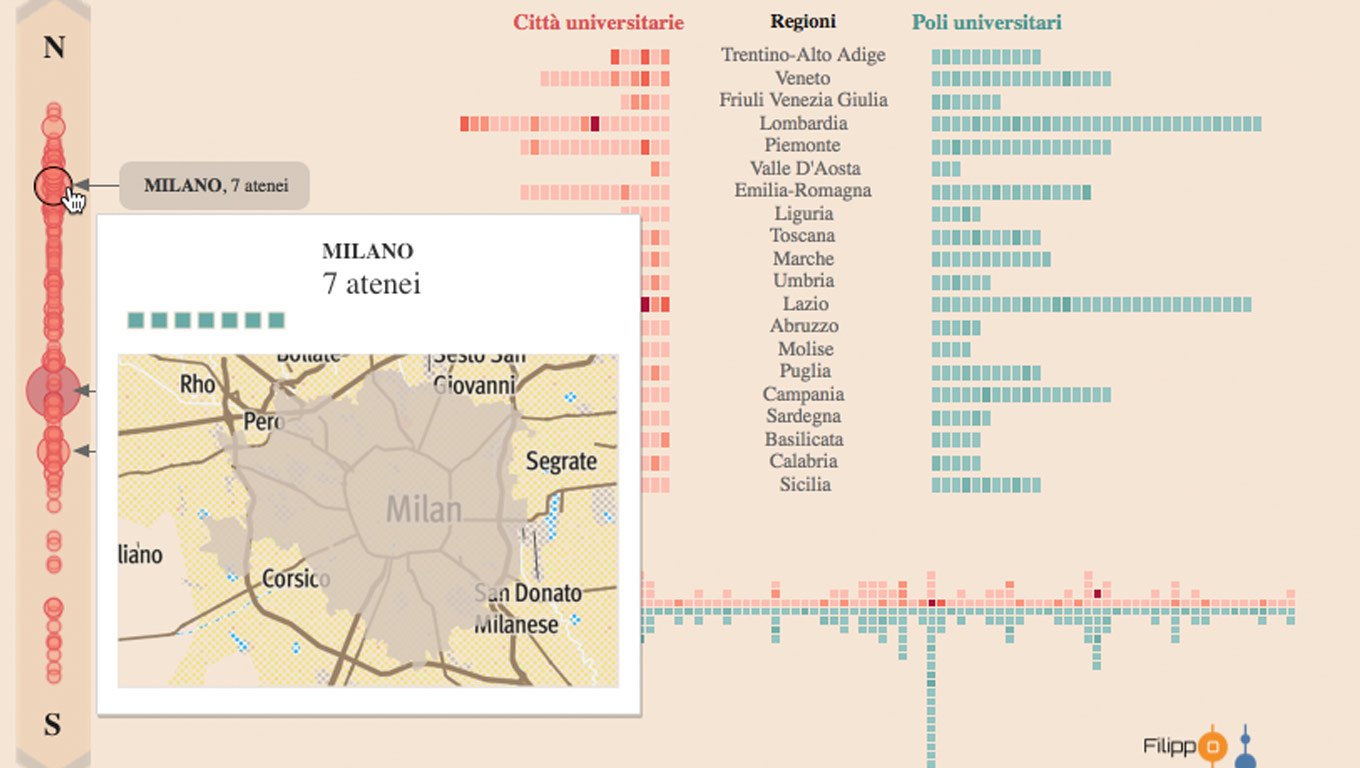
Filippo Mastroianni's Italian Universities
Vizzes
Nai Louza US Household Income Distribution
Pooja Gandhi 10.5 Adventures
Elena Hristozova My Year of Tableau
Sarah Bartlett US Household Income Distribution
Michal Mokwinski US Households Income Inequalities
Lilach Manheim Life of a Hashtag
Ken Flerlage 3D Star Map
Paul Rossman MyZone Analysis
Yash Agrawal Fiscal Date Running Sum
Ken Flerlage Viz in Tooltip Chart Zooming
Filippo Mastroianni Italian Universities
Spencer Baucke Major League Soccer Attendance
Marc Vermeulen Obesity in America
Steve Fenn MLS Wages 2017
Florian Ramseger Correlation Matrix
Mark Edwards Bars on a Map

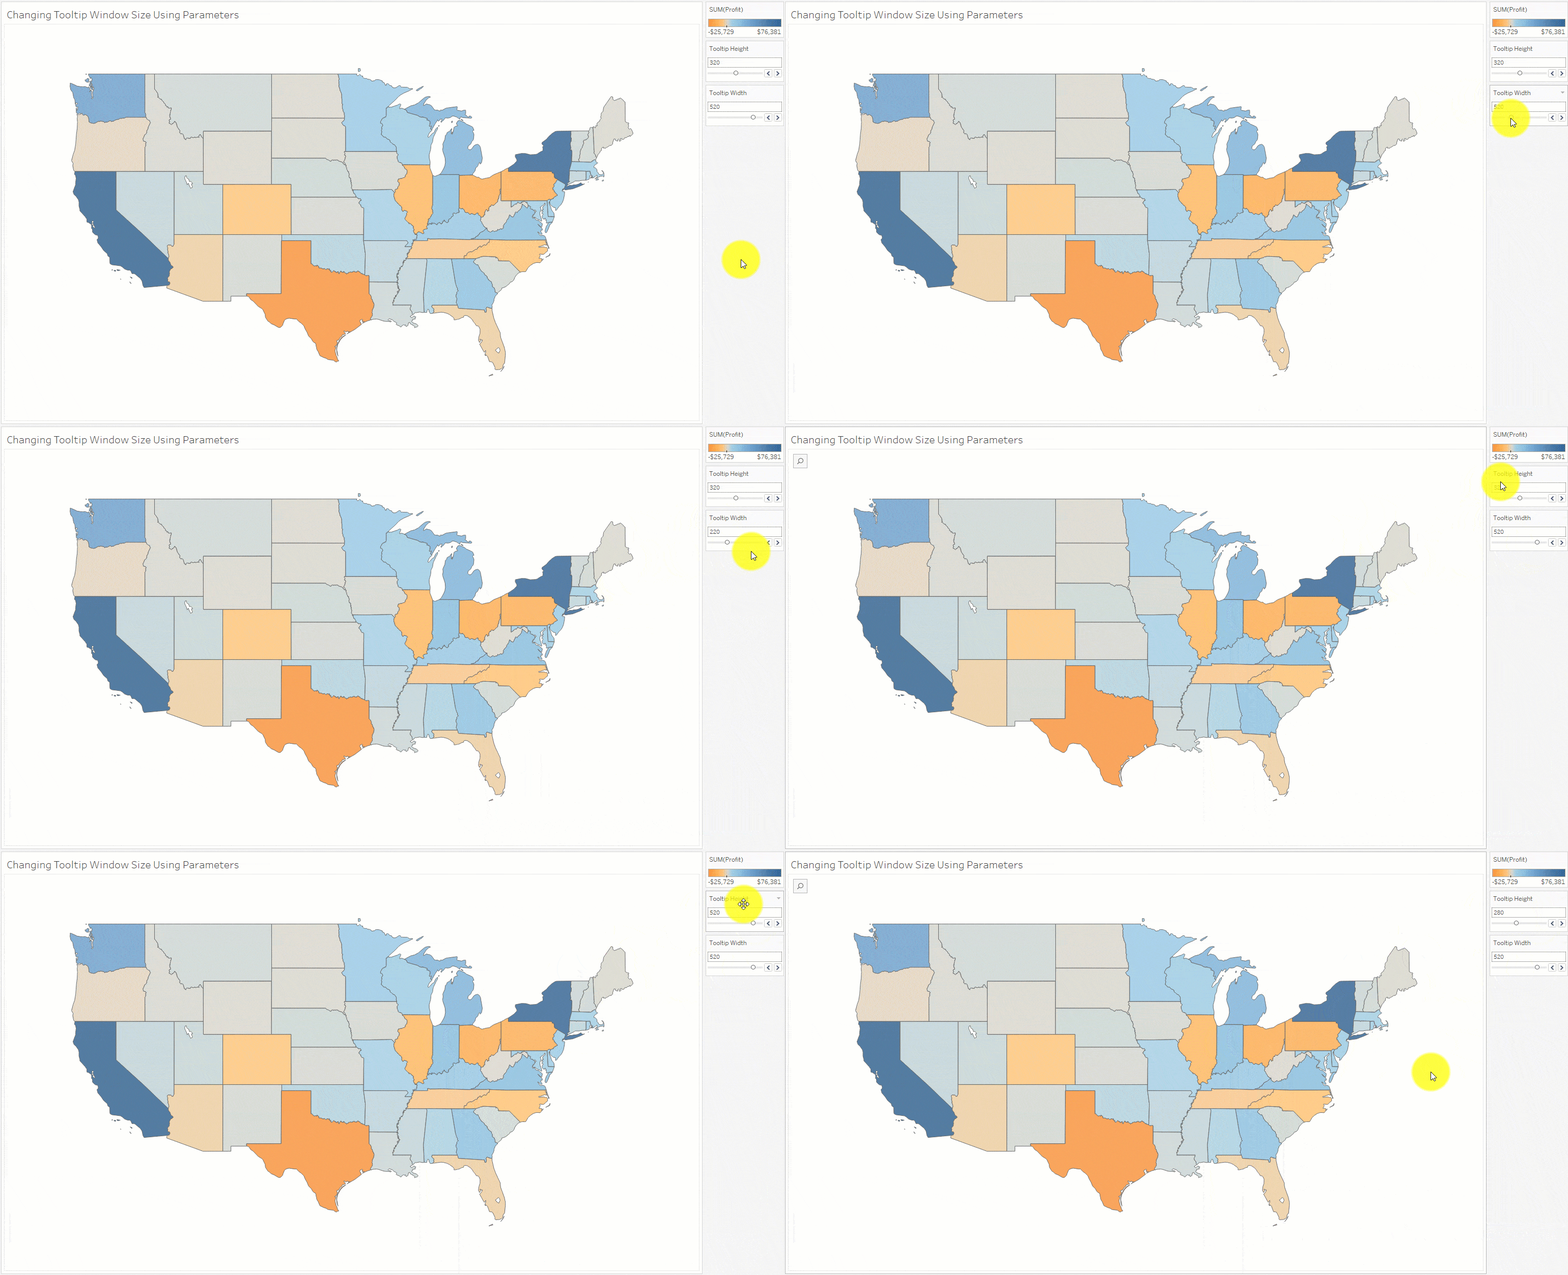
Jeffery Shaffer's Another 10 Tips for Viz in Tooltips
Tips and tricks
Jeffrey Shaffer 10 Tips for Viz in Tooltips
Jeffrey Shaffer Another 10 Tips for Viz in Tooltips
Matt Chambers How To: Conditional Viz in Tooltip Selector with Tableau
Alan Eldridge Loupe Tooltips
Sarah Bartlett How to Dynamically Colour Tooltip Text in Tableau
関連ストーリー
Subscribe to our blog
Tableau の最新情報をメールでお知らせします


