DataFam Roundup: October 21-25, 2024


Welcome! Dig into this week's DataFam Roundup—a weekly blog that brings together community content all in one post. As always, we invite you to send us your content—and the DataFam content from your peers that have inspired you! Find the content submission form here.
Community Highlight
To recognize new and consistent Tableau contributors—we’re excited to have a section within the weekly DataFam Roundup called the Tableau Community Highlight. Find out how to get involved.

Sridhar Manthripragada, NSB Academy Bangalore Assistant Professor
Karnataka, India
Sridhar Manthripragada is an Assistant Professor at the NSB Academy Bangalore, where he teaches hands-on analytics courses for MBA students. He also teaches through his blog where he writes about analyzing domain datasets from public sources using Tableau. Sridhar keeps up with the community in order to get answers to complex questions, stay up to date with the latest features, and learn how to implement best practices from Tableau Community Leaders.
The idea of starting a blog came to Sridhar when he was attending a digital marketing course some years ago. He began his blog as a place to document his experience with running however pivoted to a Medium blog during his masters degree. Now, Sridhar uses his blog to create teaching material and also documents what he teaches on his blog.
Connect with Sridhar on Linkedin and on his blog.
DataFam content
Dive into content created by the Tableau Community:
- Adam Mico:
- Will Sutton:
- Ann Pregler: 6 Tips For Inheriting a Dashboard
- Brian Rock: The 2024 Chicago Marathon: Three Interesting Data Insights (Plus More)
-
Data Visualization Style Guidelines: Insights on Dashboard Design
-
Tim Ngwena, Tableau Tim: Spatial Parameters in Tableau 2024.3
-
Priyanka Dobhal: Tableau VizQL Data Service: What is it and how is it a game changer?
-
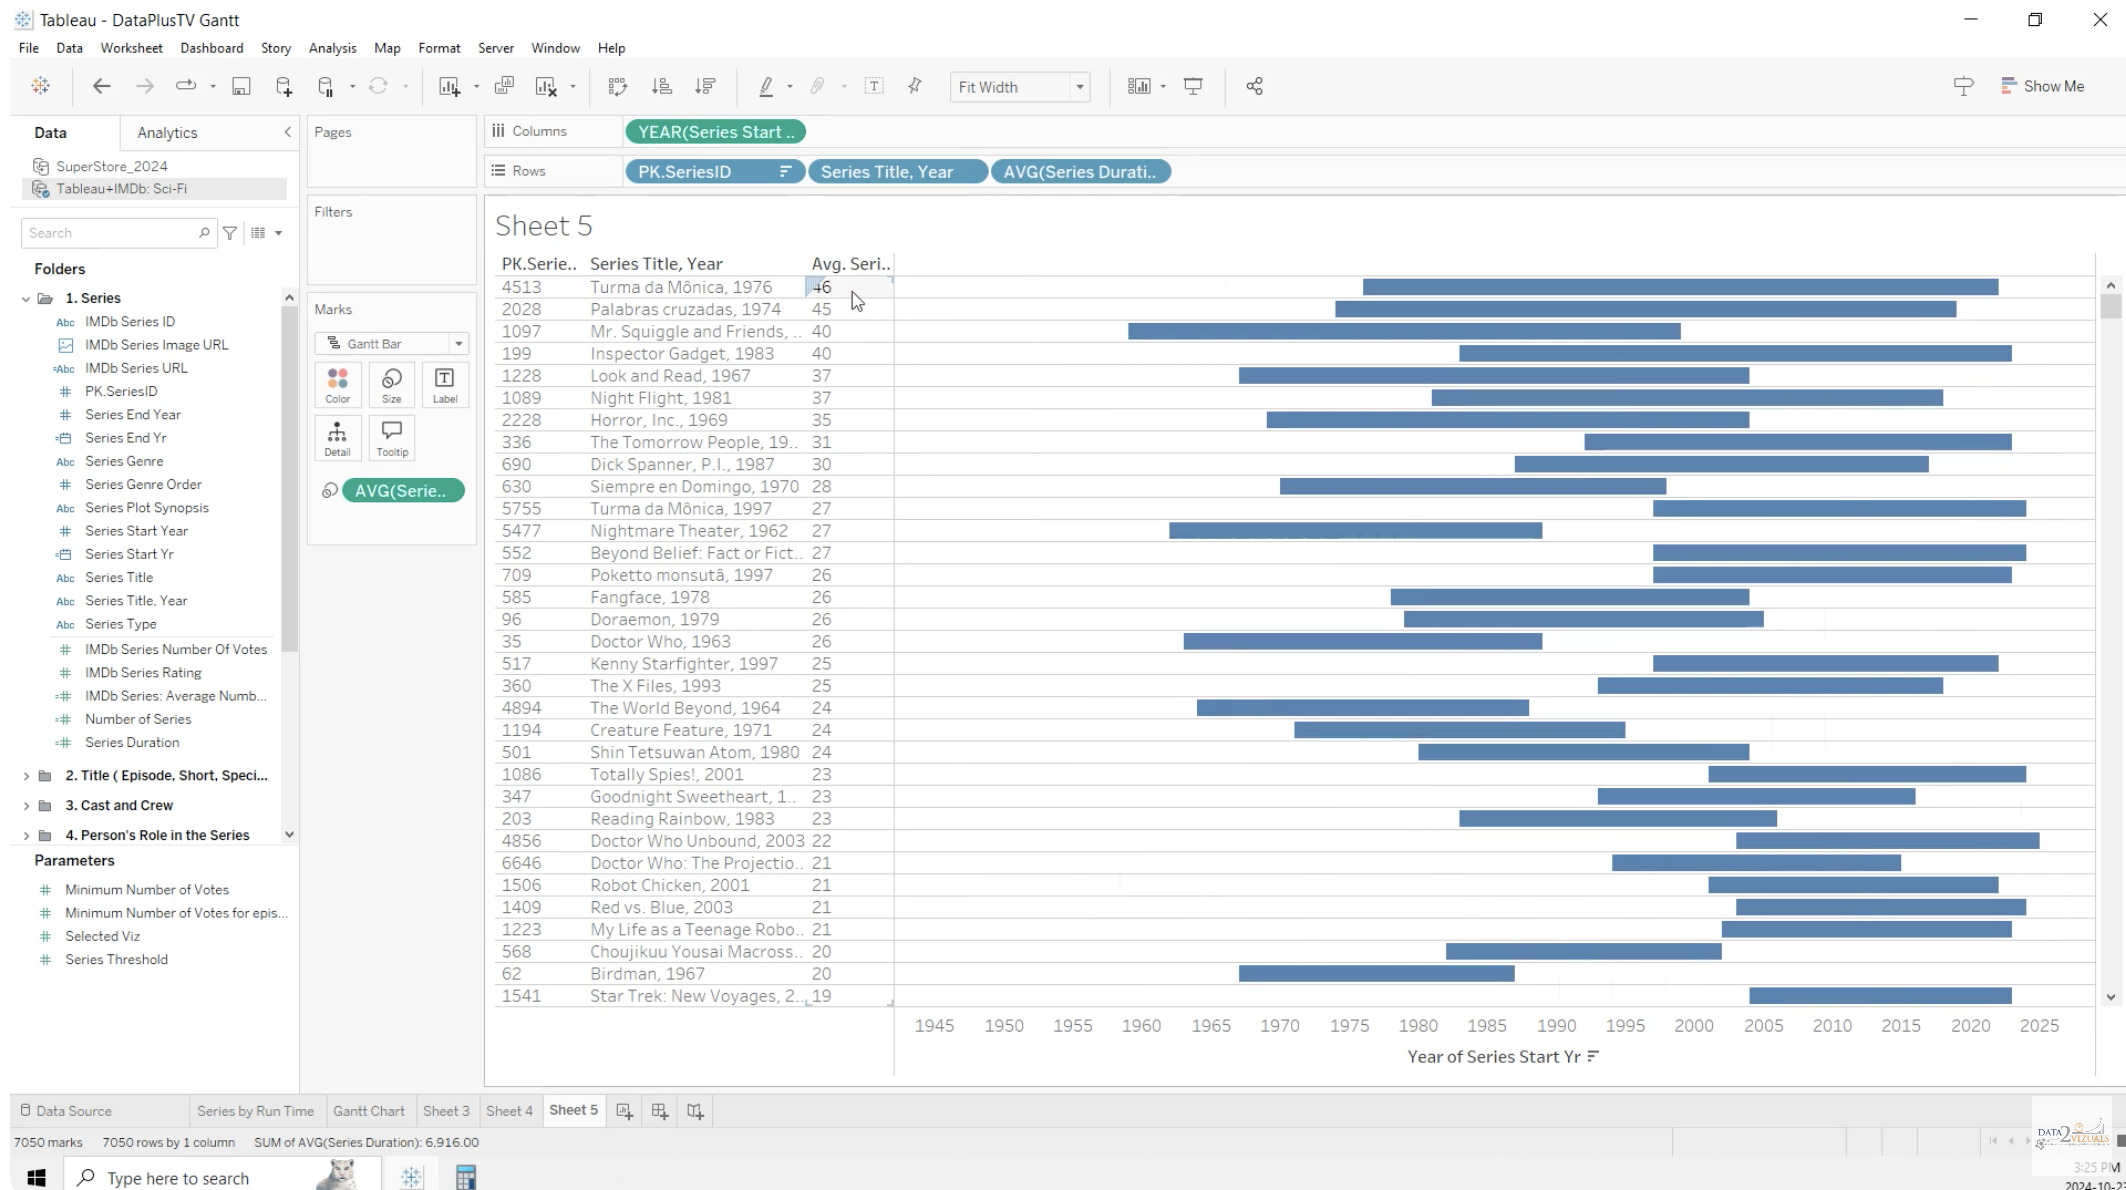
Data2Vizuals: Tableau Gantt Chart
-
Steve Adams: Got to love Tableau’s DVZ’s
Team Tableau content
- Data Literacy Basics Everyone Should Know
- How To Spot Misleading Charts: Know the Source
- Advocacy Through Human-Centered Data Visualization
Upcoming events and community participation
-
Data Literacy Basics You Can Use Today Virtual Event - Data literacy isn’t just for experts, it’s a skill we all need. With information everywhere, understanding how to use it is key. Join us as we break it down into simple steps you can start using right away.
- #IronViz Feedback Initiative is now live! Supported by 20 #Tableau Community leaders, we're offering Iron Viz feedback via 30-minute calls, as well as written feedback!
- Dreamin' in Data Dreamin’ in Data is the first Salesforce Community Conference purpose-built to help showcase the entire journey of your organization’s data, from Salesforce (your CRM), through integrations with other applications (using MuleSoft), and finally to analysis and determining the story your data is telling (using Tableau) – ultimately to help your organization make smarter decisions faster and stay ahead of your competition.
- CRM Analytics Community Office Hours! Have CRM Analytics questions? Want to know how to work with data? Want to learn something new? Have visualization ideas you want to share or need feedback on? Want to just hang out with a bunch of us? Come join us (virtual)!
- DataFam Birthday Roundup! In the effort of continuing support for one another, we thought it would be fun to gather data on DataFam birthdays! If you're willing, could you let us know which day you celebrate your birthday? Just go ahead and pick the day from this year's calendar, since it's a leap year and all possible days are available to choose from!
- Mentorship Program by the Data Visualization Society
- Women in Dataviz Virtual Coffee Breaks: Held every sixth Thursday morning and every sixth Wednesday afternoon in the EST time zone, Virtual Coffee Breaks are a casual networking event. Feel free to drop in and out as you need toduring the hour, and stay for as little time or as long as you want.
Visualizations
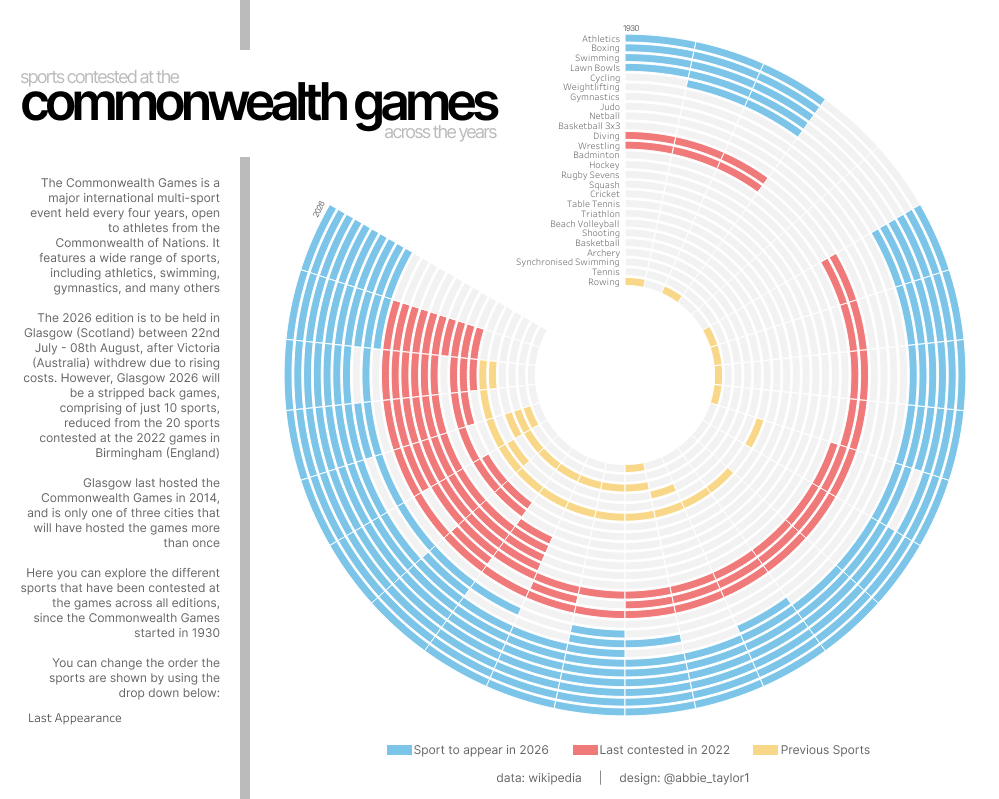
Abbie Taylor: Commonwealth Games
See the latest Viz of the Day, trending vizzes, featured authors, and more on Tableau Public.
Check out some inspirational vizzes created by the community:
- Brian Rock: Explore the Results of the 2024 Chicago Marathon
- Israel Ayoola: Analytics Consultant Dashboard
- Abbie Taylor: Commonwealth Games
- Jeff Plattner: NFL Leaders and Dynamic Zone Zooming
- のぞぴぴ: B2VB_2024Week19_TOP N GAME
Community Projects
Back 2 Viz Basics
A bi-weekly project helping those who are newer in the community and just starting out with Tableau. Not limited just to newbies!
Web: Back 2 Viz Basics
X: #B2VB
Week 20: Iron Viz Break
Workout Wednesday
Build your skills with a weekly challenge to re-create an interactive data visualization.
Web: Workout Wednesday
X: #WOW2022
Week 42: Let’s play with Table(au) Extensions!
Preppin' Data
A weekly challenge to help you learn to prepare data and use Tableau Prep.
Web: Preppin’ Data
X: #PreppinData
Week 41: MiniBytes Worst Selling Products
Makeover Monday
Create business dashboards using provided data sets for various industries and departments.
Web: Makeover Monday
X: #MakeoverMonday
Week 42: Ranked: The Most Reliable Car Brands in the US
Visual Climate
Collaborate and share climate data.
Web: Visual Climate
X: #VisualClimate
IMF's GHG emissions data
DataFam Con
A monthly challenge covering pop culture and fandoms.
Web: DataFam Con
X: #DataFamCon
September 2024: Live Long and Prosper with Star Trek
EduVizzers
A monthly project connecting real education data with real people.
Web: Eduvizzers
September 2024: Global Hunger Index (GHI)
Viz for Social Good
Volunteer to design data visualizations that help nonprofits harness the power of data for social change.
Web: Viz for Social Good
X: #VizforSocialGood
Games Night Viz
A monthly project focusing on using data from your favorite games.
Web: Games Nights Viz
X: #GamesNightViz
September 2024: Press Start
Iron Quest
Practice data sourcing, preparation, and visualization skills in a themed monthly challenge.
Web: Iron Quest
X: #IronQuest
Iron Quest – Maps II
Storytelling with Data
Practice data visualization and storytelling skills by participating in monthly challenges and exercises.
Web: Storytelling with Data
X: #SWDChallenge
October 2024: trick (or treat) your tool
Project Health Viz
Uncover new stories by visualizing healthcare data sets provided each month.
Web: Project Health Viz
X: #ProjectHealthViz
Diversity in Data
An initiative centered around diversity, equity & awareness by visualizing provided datasets each month.
Web: Diversity in Data
X: #DiversityinData
Sports Viz Sunday
Create and share data visualizations using rich, sports-themed data sets in a monthly challenge.
Web: Sports Viz Sunday
X: #SportsVizSunday
Real World Fake Data
Create business dashboards using provided data sets for various industries and departments.
Web: Real World Fake Data
X: #RWFD
2024 - Admin Insights
Data Plus Music
A monthly project visualizing the data behind the music we love!
Web: Data Plus Music
X: #DataPlusMusic
関連ストーリー

DataFam Roundup: February 17-21, 2025

DataFam Roundup: February 10-14, 2025

Announcing the 2025 Tableau Visionaries
 2025/02/13
Subscribe to our blog
Tableau の最新情報をメールでお知らせします