DataFam Roundup: October 10-14, 2022
Welcome! Dig into this week's DataFam Roundup—a weekly blog that brings together community content all in one post. As always, we invite you to send us your content—and the DataFam content from your peers that have inspired you! Find the content submission form here.
DataFam content
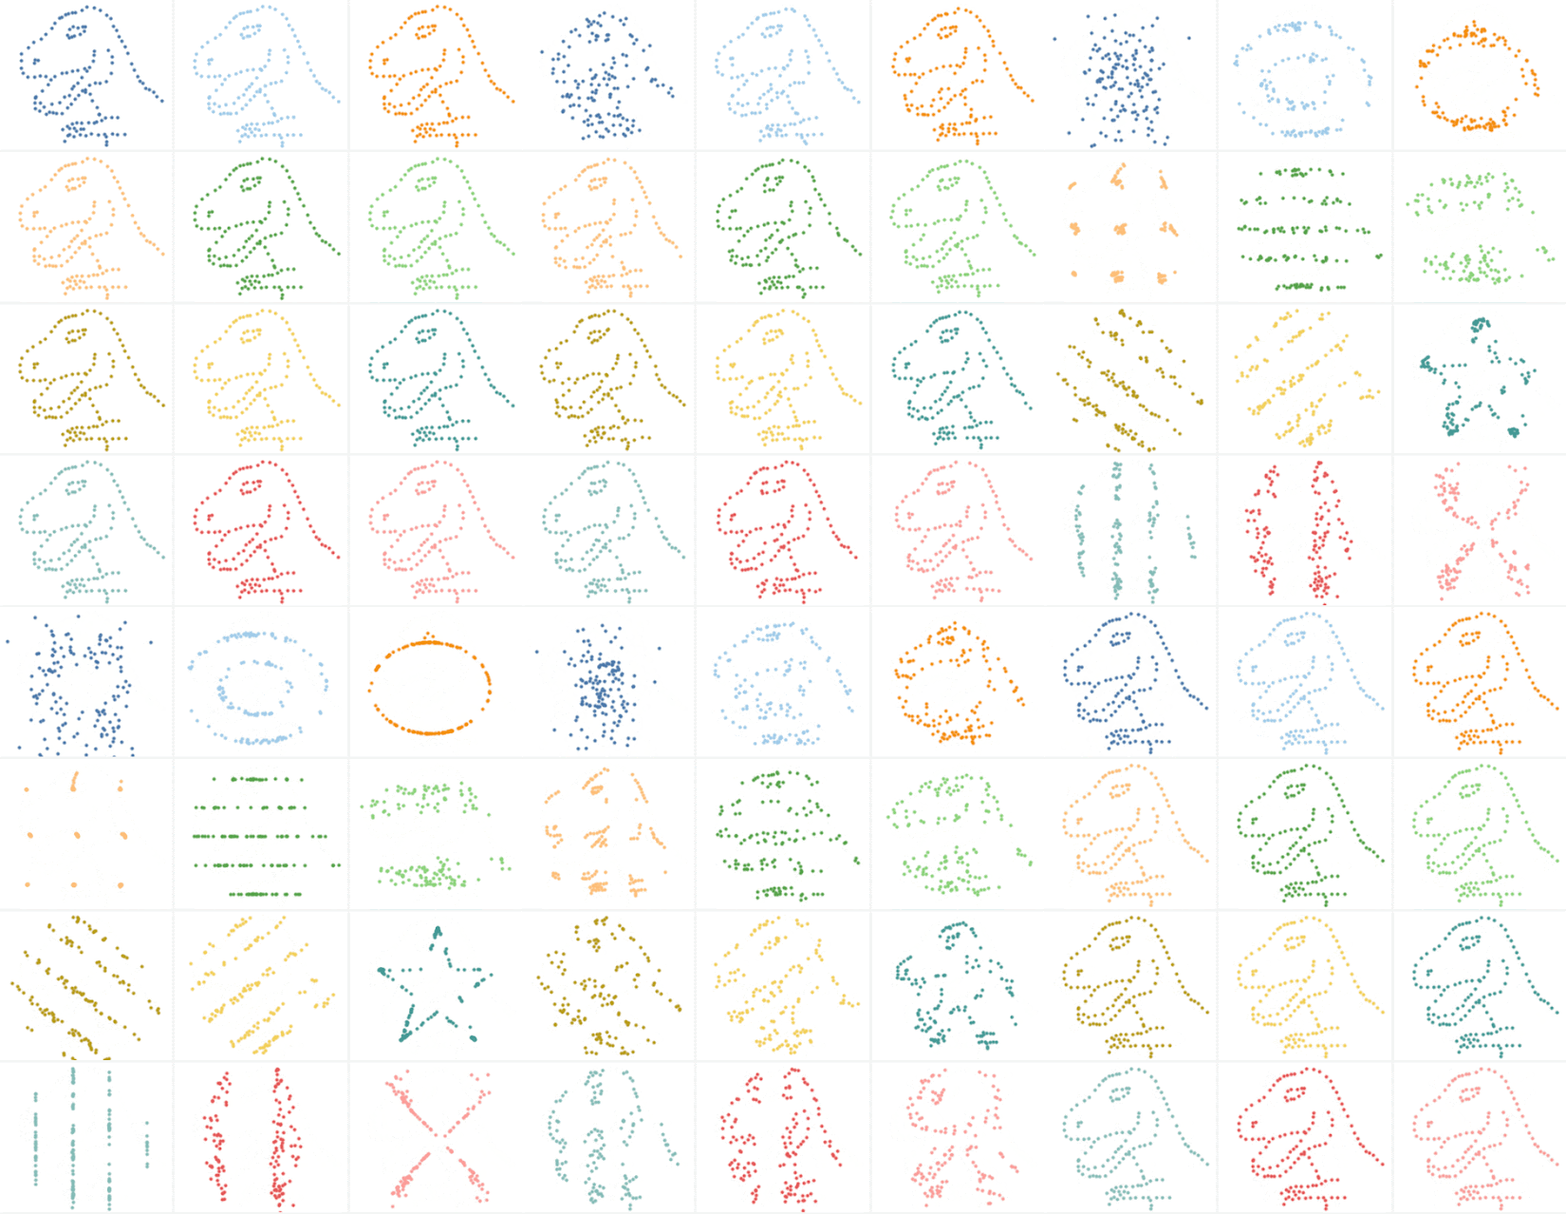
Alexander Mou, vizdiff: Recreating Datasaurus Dozen in Tableau
Dive into content created by the Tableau Community:
-
Mark Bradbourne: Triple Star Ranger! What does it all mean? by Just 5 Minutes
-
Sarah Bartlett, Sarah Loves Data: Reasons to Enter Iron Viz 2023
-
Maha Hussari, DataWithMaha: How to Remove Highlighting in Tableau
-
Sarah Battersby: Custom map file archive
-
Kavin G Kumar: 10 THINGS YOU SHOULD DO WHILE PUBLISHING YOUR VISUALIZATION TO TABLEAU PUBLIC
-
Alexander Mou, vizdiff: Recreating Datasaurus Dozen in Tableau
-
みのる: [Tableau Tips]特殊なスペースでラベル位置を微調整する方法 [Tableau Tips] How to tweak label position in special spaces
-
Klaus Schulte, COdata: World Population Cartograms
-
Annabelle Rincon, Rativiz:
-
Ken Flerlage, Flerlage Twins: Tableau Set Control Part 1: The Basics
-
Louis Yu: #GamesNightViz IronViz Edition: Tips from the Team
-
Lindsay Betzendahl: Figma + Tableau: Organizing Your Design Files
Team Tableau
- Iron Viz Qualifiers are open until October 30, 2022. Learn about the theme and get vizzing.
- Tableau Forums Ambassador Spotlight: Budi Lubis
- What’s New with Tableau User Groups
- What is the Tableau Community Project—Back to Viz Basics?
-
Participating in the Iron Viz Qualifiers? Here’s How to Save Time
- Featured Authors: Back to School Edition
Upcoming events and community participation
-
Iron Viz Feedback Initiative 2023: Book a 15-minute feedback session with Tableau community members and prior Iron Viz contestants who will review your viz and share feedback on your Iron Viz entry.
-
October 15th 2022 #OneCommunity Hangout Registration on Remo: Organized by Tableau Visionary Adam Mico, the purpose is a meetup and hangout in a relaxing atmosphere with no more than eight people per table and a chance to move around and meet many people in our greater community.
-
Storytelling With Data - London Workshop: Join Cole and members of the team in London to learn about visualization and data storytelling best practices in an engaging, hands-on in-person session!
Vizzes
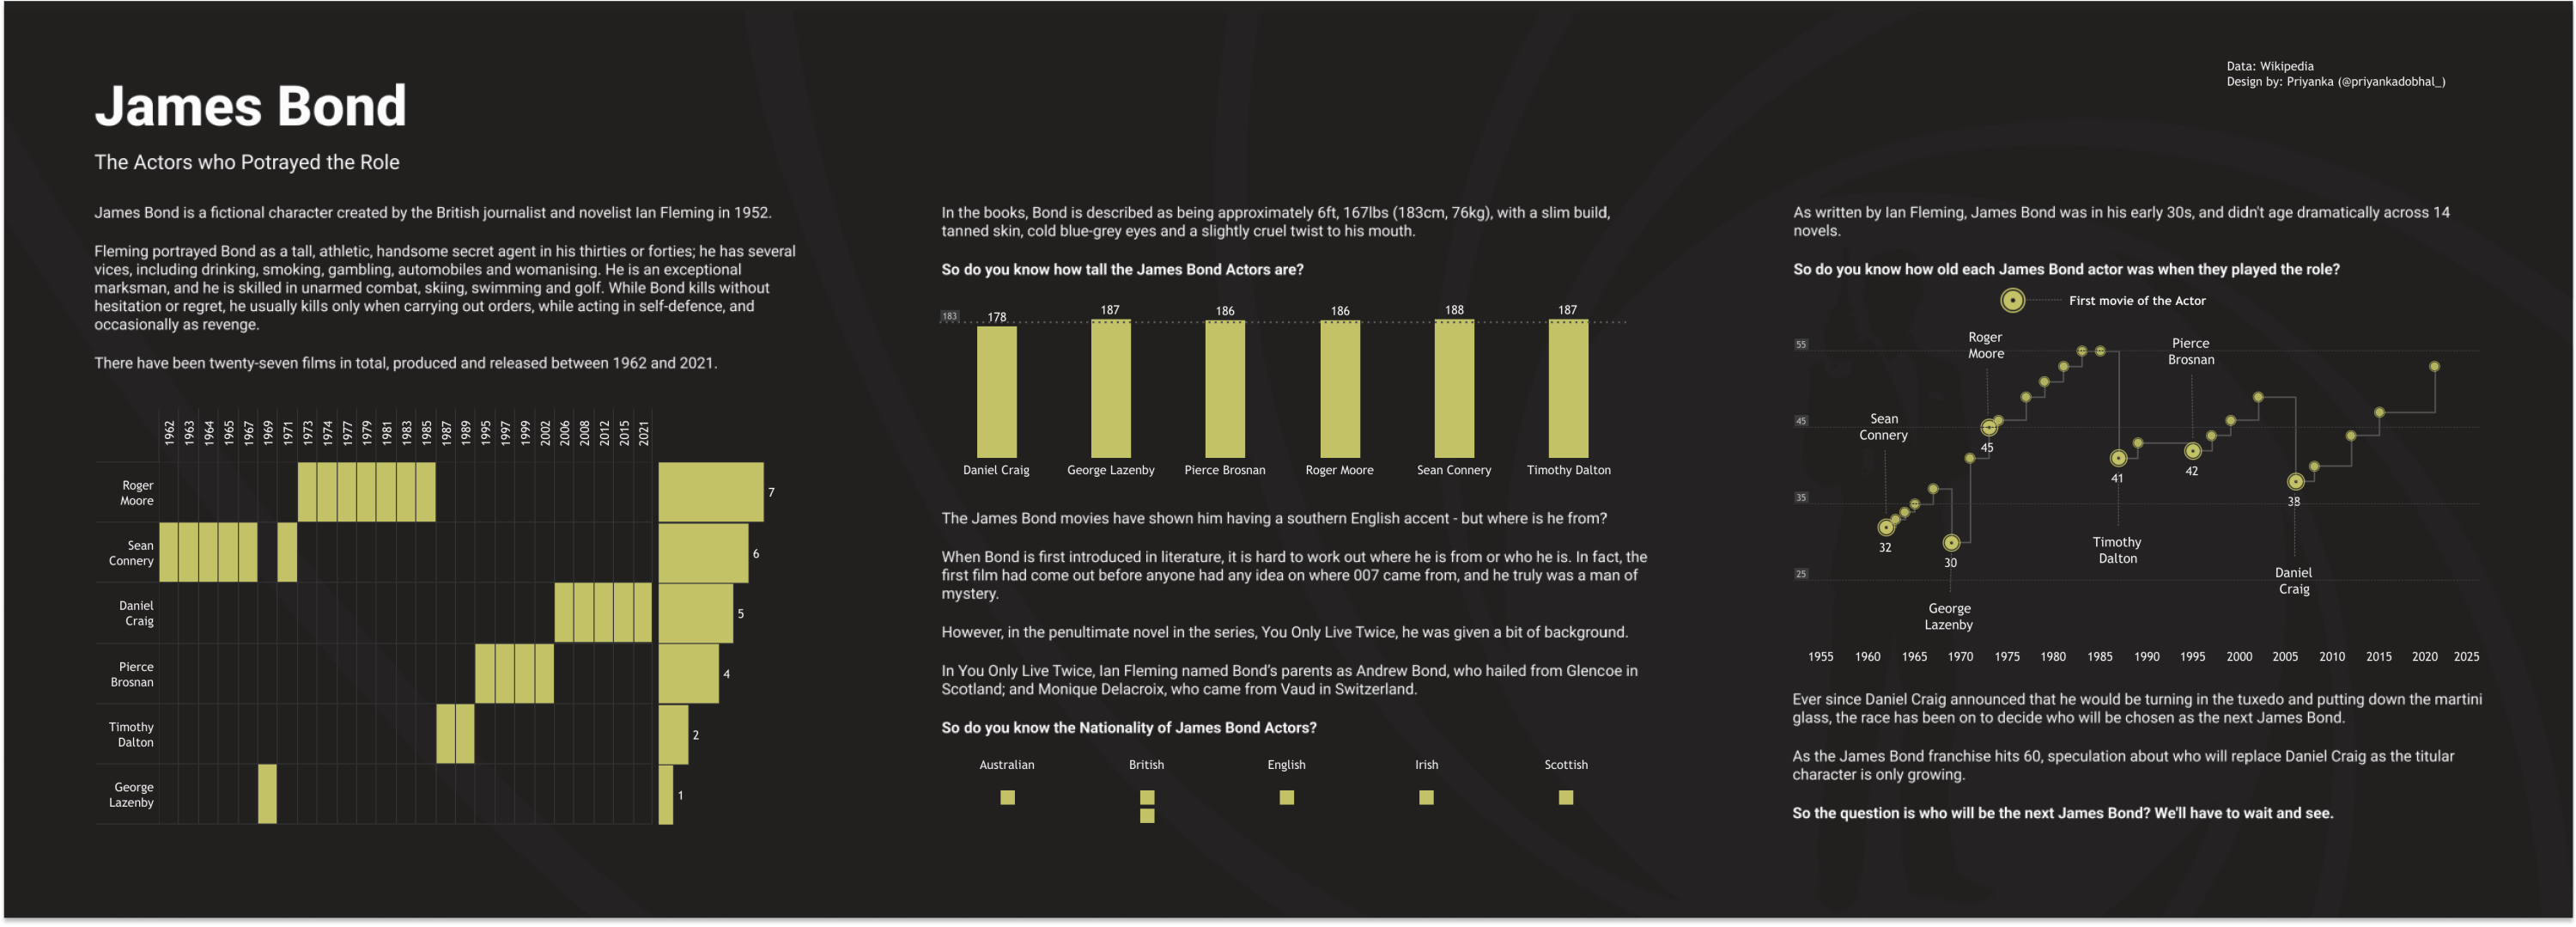
Priyanka Dobhal: James Bond: The Actors who Portrayed the Role
See the latest Viz of the Day, trending vizzes, featured authors, and more on Tableau Public.
Check out some inspirational vizzes created by the community:
- Sam Epley: Tableau Public Featured Authors: Back to School Edition - September 2022 Cohort
- Priyanka Dobhal: James Bond: The Actors who Portrayed the Role
- Ken Flerlage: Tableau Set Control Use Cases
- Sagar Kapoor: VizConnect sessions Recap
- Nicole Mark: Twitter Engagement Monitor
- Marius Nikiforovas: Data Stories: Are we becoming more renewable?
Community Projects
Back 2 Viz Basics
A bi-weekly project helping those who are newer in the community and just starting out with Tableau. Not limited just to newbies!
Web: Back 2 Viz Basics
Twitter: #B2VB
Week 21: Source Your Own Data
Workout Wednesday
Build your skills with a weekly challenge to re-create an interactive data visualization.
Web: Workout Wednesday
Twitter: #WOW2022
Week 41: Can you do YoY comparisons?
Makeover Monday
A weekly social data project.
Web: Makeover Monday
Twitter: #MakeoverMonday
Week 41: UN Human Development Index
Preppin' Data
A weekly challenge to help you learn to prepare data and use Tableau Prep.
Web: Preppin’ Data
Twitter: #PreppinData
Week 41: Dynamic Times Tables
DataFam Con
A monthly challenge covering pop culture and fandoms.
Web: DataFam Con
Twitter: #DataFamCon
October 2022: Stranger Things + Music Nostalgia Month
EduVizzers
A monthly project connecting real education data with real people.
Web: Eduvizzers
September 2022: Detailed Years of School Completed by People 25 Years and Over by Sex, Age Groups, Race and Hispanic Origin: 2021
Games Night Viz
A monthly project focusing on using data from your favorite games.
Web: Games Nights Viz
Twitter: #GamesNightViz
September 2022: Montages
Iron Quest
Practice data sourcing, preparation, and visualization skills in a themed monthly challenge.
Web: Iron Quest
Twitter: #IronQuest
August 2022: The Tour: The Sound of Games with #DataPlusMusic
Public Policy Viz
Bridging the gap between analytics professionals and policy practitioners.
Web: Public Policy Viz
Twitter: #PublicPolicyViz
Project 1: Redlining in Pittsburgh, PA
Data Plus Music
A monthly project visualizing the data behind the music we love!
Web: Data Plus Music
Twitter: #DataPlusMusic
July 2022: The Intro
Storytelling with Data
Practice data visualization and storytelling skills by participating in monthly challenges and exercises.
Web: Storytelling with Data
Twitter: #SWDChallenge
September 2022: known to novel
Project Health Viz
Uncover new stories by visualizing healthcare data sets provided each month.
Web: Project Health Viz
Twitter: #ProjectHealthViz
August 2022: Mental Health Care Professionals Shortages
Diversity in Data
An initiative centered around diversity, equity & awareness by visualizing provided datasets each month.
Web: Diversity in Data
Twitter: #DiversityinData
September 2022: Global Women
Sports Viz Sunday
Create and share data visualizations using rich, sports-themed data sets in a monthly challenge.
Web: Sports Viz Sunday
Twitter: #SportsVizSunday
August 2022: Commonwealth Games
Viz for Social Good
Volunteer to design data visualizations that help nonprofits harness the power of data for social change.
Web: Viz for Social Good
Twitter: #VizforSocialGood
Sept 2-Sept 30 2022: India Water Portal/Arghyam
Real World Fake Data
Create business dashboards using provided data sets for various industries and departments.
Web: Real World Fake Data
Twitter: #RWFD
Session 3: Community Service Requests
SDG Viz Project
Visualize data about Sustainable Development Goals provided by the World Health Organization.
Web: SDG Viz Project
Twitter: #TheSDGVizProject
関連ストーリー
Subscribe to our blog
Tableau の最新情報をメールでお知らせします


