DataFam Roundup: June 3–7, 2024


Welcome! Dig into this week's DataFam Roundup—a weekly blog that brings together community content all in one post. As always, we invite you to send us your content—and the DataFam content from your peers that have inspired you! Find the content submission form here.
Community Highlight
To recognize new and consistent Tableau contributors—we’re excited to have a section within the weekly DataFam Roundup called the Tableau Community Highlight. Find out how to get involved.

Gordon Quach, Lead Data Scientist
Virginia, USA
Gordon began using Tableau through his coursework at Virginia Tech. He attributes most of his learning to Tableau User Groups, reverse engineering Tableau Public visualizations, hands-on work, and connecting with other members of the DataFam. Gordon now also contributes to the Tableau Community by participating in community projects and serving as a mentor and Tableau instructor.
As a Tableau instructor, Gordon has facilitated Tableau workshops at his alma mater, Virginia Tech, created a case study experience that led students through how to design effective charts, and taught Tableau ad hoc for mentees, colleagues, and others in his network who are interested. Gordon’s long term goal is to become a university professor and get students excited about learning how to use Tableau to make amazing data products & effective visualization designs in a more formal academic setting.
Connect with Gordon on Linkedin, X, and Tableau Public.
DataFam content
Dive into content created by the Tableau Community:
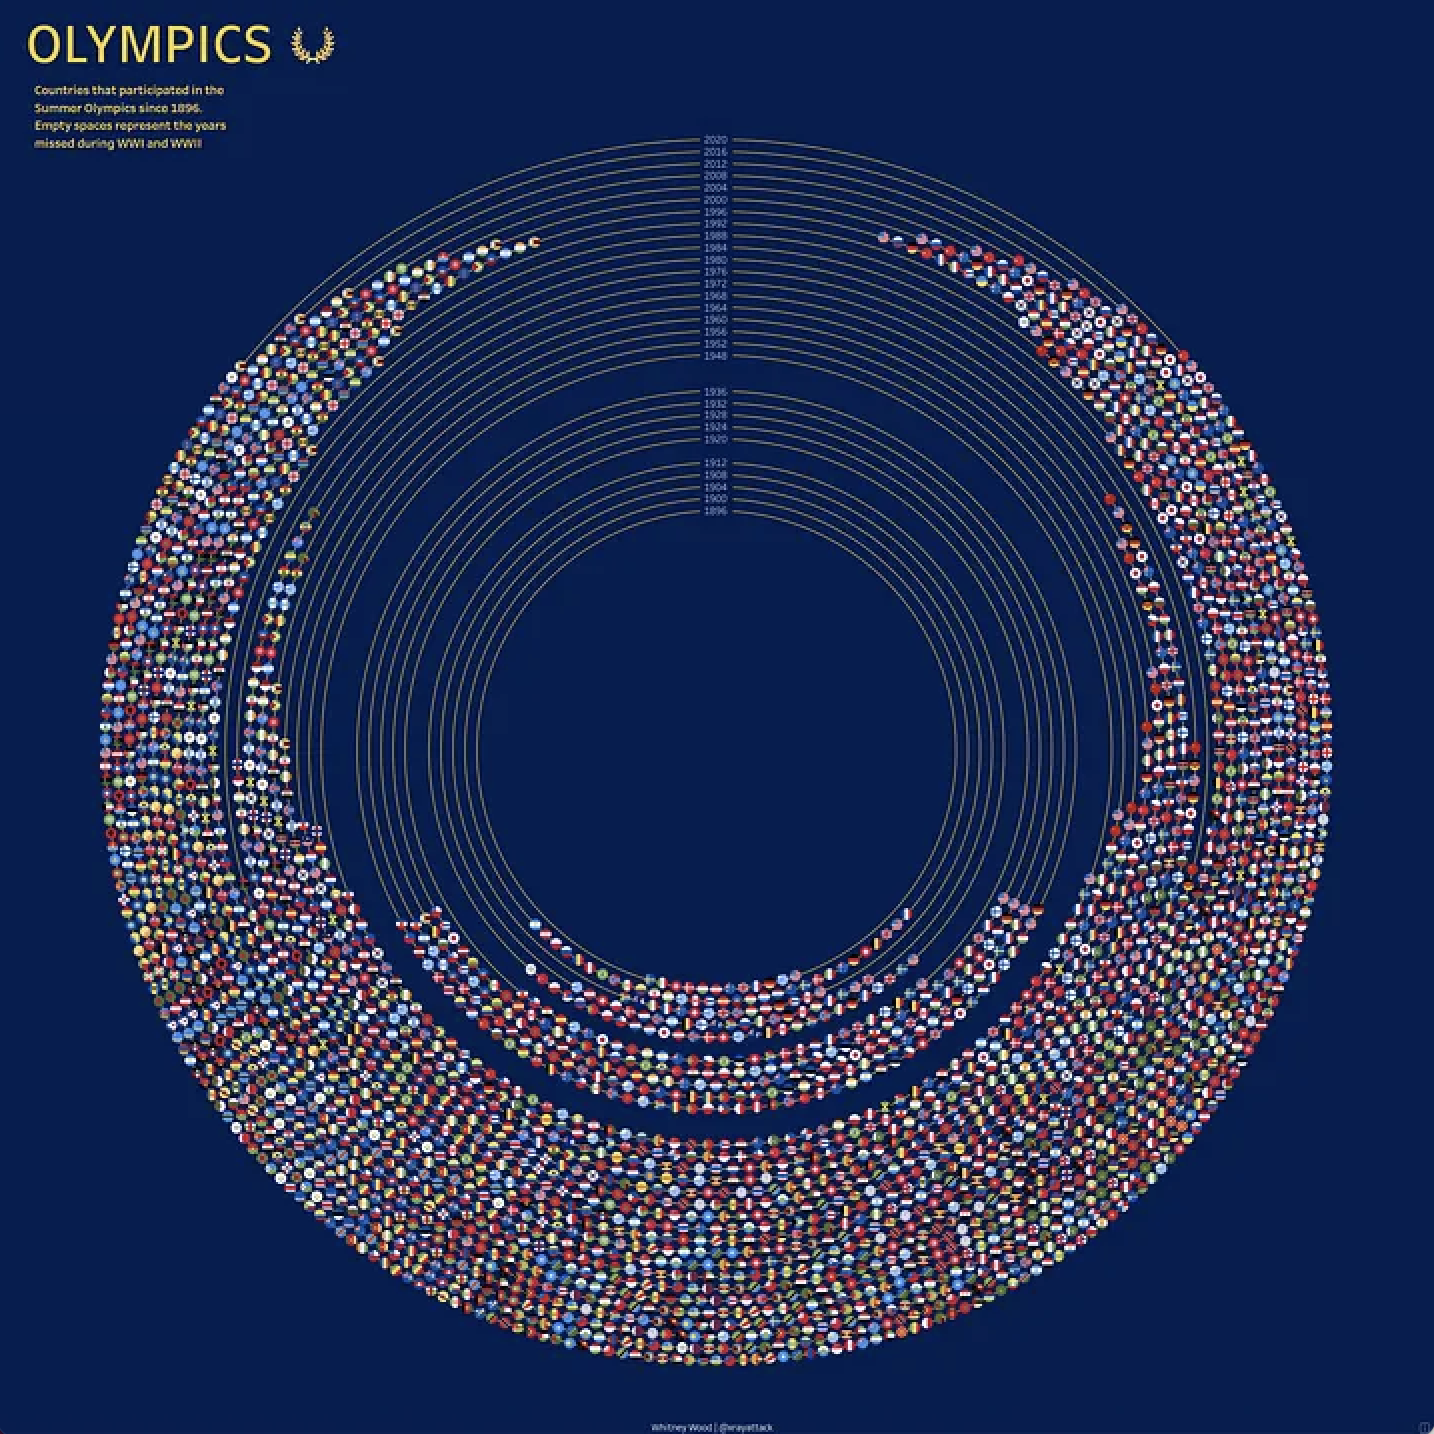
Whitney Wood: Behind the Viz: “Olympics” with Python and Tableau
- Ayodeji Omokehinde: Mastering Tableau Public: Eliminate the White Box in Your Legend for a Sleek, Professional Look
- Emily De Padua: Apply Anyway: Tableau Ambassador Program Edition — Emily De Padua
- Ivett Kovács: Get coordinates from addresses to create Maps in Tableau
- Whitney Wood: Behind the Viz: “Olympics” with Python and Tableau
- Zach Bowders: Data + Love = Daphne Draws Data with Cole Nussbaumer Knaflic
- Sarah Bartlett: Iron Quest Women – Recap
- Amy Esselman: is your point clear? — storytelling with data
- Chris Westlake, Westlake Analytics: Becoming an Iron Viz Champion
Team Tableau
- Tableau Ambassador nominations and applications are open
- Tableau Public Featured Authors: June 2024
- What can you learn from attending the Tableau Public User Group?
Upcoming events and community participation
- Lights, Camera, Action: Tableau and IMDb Launch Data Visualization Campaign for Movie Lovers
- DataFam Birthday Roundup! In the effort of continuing support for one another, we thought it would be fun to gather data on DataFam birthdays! If you're willing, could you let us know which day you celebrate your birthday? Just go ahead and pick the day from this year's calendar, since it's a leap year and all possible days are available to choose from!
- Mentorship Program by the Data Visualization Society
- Women in Dataviz Virtual Coffee Breaks: Held every sixth Thursday morning and every sixth Wednesday afternoon in the EST time zone, Virtual Coffee Breaks are a casual networking event. Feel free to drop in and out as you need toduring the hour, and stay for as little time or as long as you want.
Vizzes
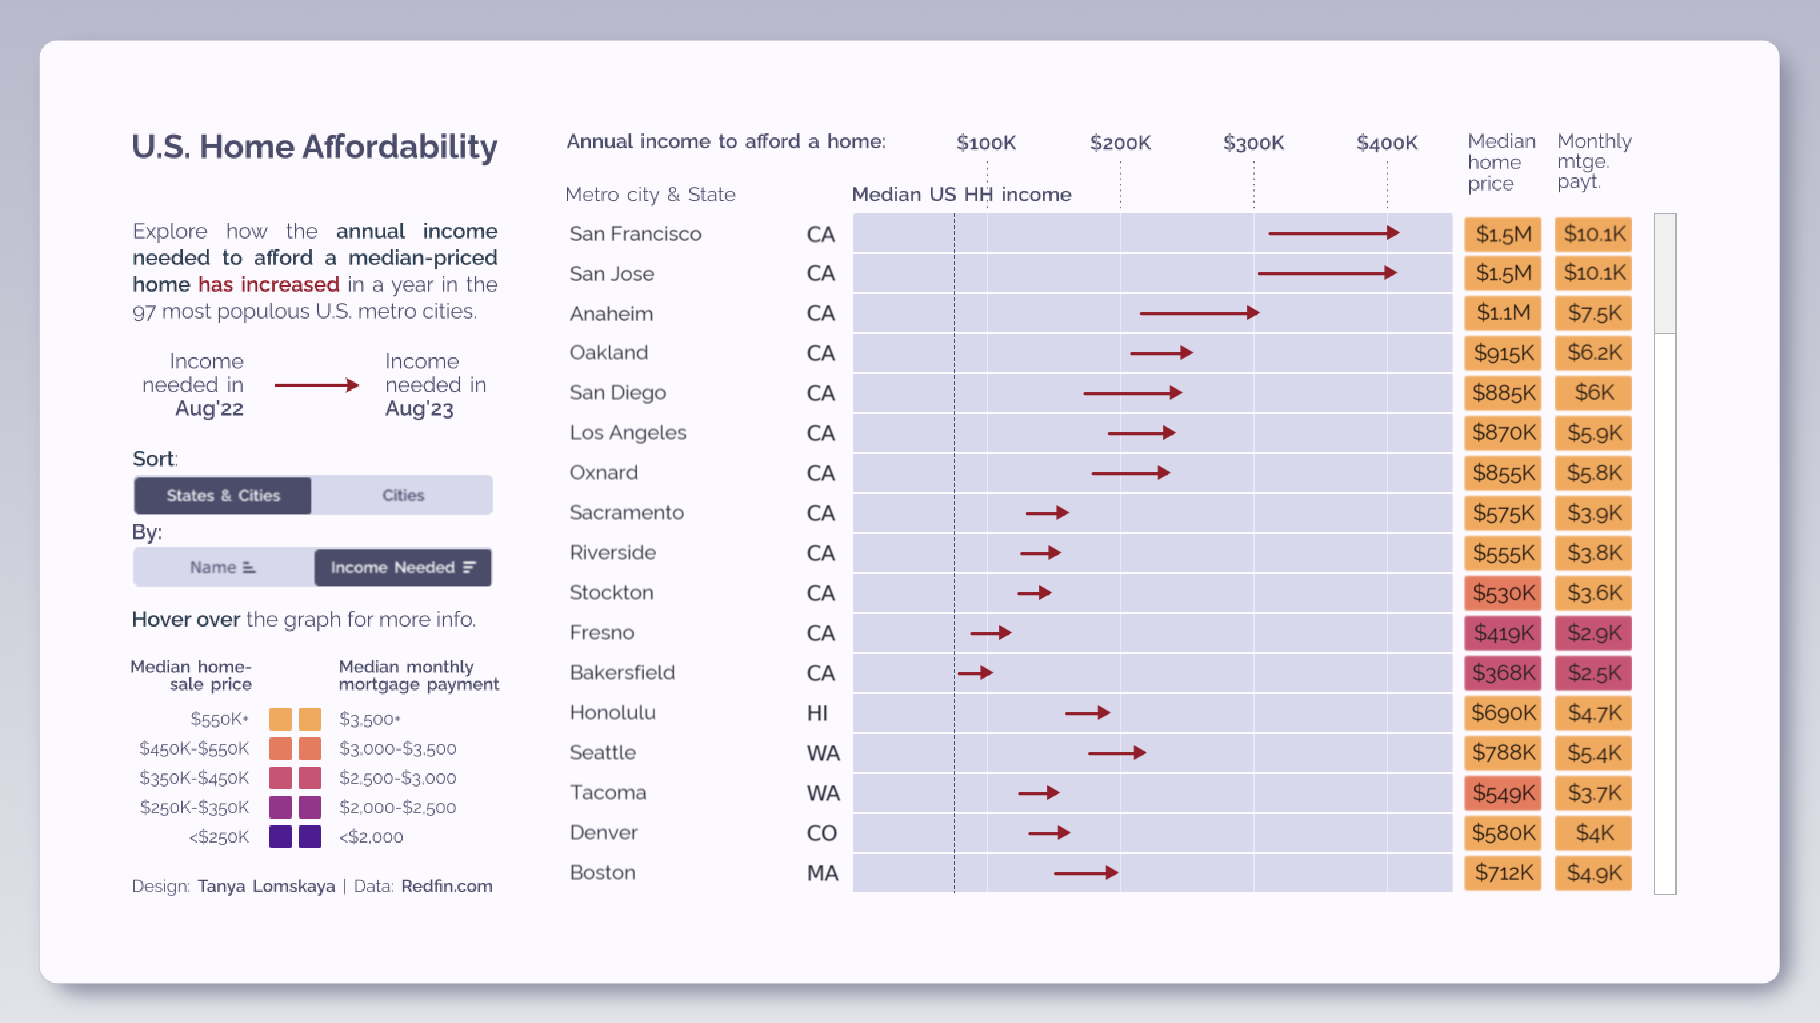
Tanya Lomskaya: U.S. Home Affordability #MakeoverMonday 2024 W22 (+saving the font)
See the latest Viz of the Day, trending vizzes, featured authors, and more on Tableau Public.
Check out some inspirational vizzes created by the community:
- Yash Sakhuja: My Steps Trends 2023 Calendar
- Zainab Ayodimeji: The Artists of MoMA
- Felicia Styer (graph_hopper): MM24w23 LGBTQ+ Gallup Poll
- Dennis Kao: Michael Chang | #IronViz 2023
- Donna Coles: 2024_06_05_WW23_MoveParameterInput
- Tanya Lomskaya: U.S. Home Affordability #MakeoverMonday 2024 W22 (+saving the font)
Community Projects
Back 2 Viz Basics
A bi-weekly project helping those who are newer in the community and just starting out with Tableau. Not limited just to newbies!
Web: Back 2 Viz Basics
X: #B2VB
Week 11: Use Color Purposefully
Workout Wednesday
Build your skills with a weekly challenge to re-create an interactive data visualization.
Web: Workout Wednesday
X: #WOW2022
Week 23: Manually overwrite a value in a table
Preppin' Data
A weekly challenge to help you learn to prepare data and use Tableau Prep.
Web: Preppin’ Data
X: #PreppinData
Week 23: SuperBytes Salaries
Makeover Monday
Create business dashboards using provided data sets for various industries and departments.
Web: Makeover Monday
X: #MakeoverMonday
Week 23: 7.2 Percent of U.S. Adults Identify as LGBT
DataFam Con
A monthly challenge covering pop culture and fandoms.
Web: DataFam Con
X: #DataFamCon
March 2024 Challenge: Sports Movies Edition
EduVizzers
A monthly project connecting real education data with real people.
Web: Eduvizzers
May 2024: Data + Movies + Education (IMDB)
Viz for Social Good
Volunteer to design data visualizations that help nonprofits harness the power of data for social change.
Web: Viz for Social Good
X: #VizforSocialGood
May 2 - June 6, 2024: Global Deaf Research Institute
Games Night Viz
A monthly project focusing on using data from your favorite games.
Web: Games Nights Viz
X: #GamesNightViz
Season 2: With great power comes great vizzes
Iron Quest
Practice data sourcing, preparation, and visualization skills in a themed monthly challenge.
Web: Iron Quest
X: #IronQuest
Women
Storytelling with Data
Practice data visualization and storytelling skills by participating in monthly challenges and exercises.
Web: Storytelling with Data
X: #SWDChallenge
April 2024: Napoleon's April
Project Health Viz
Uncover new stories by visualizing healthcare data sets provided each month.
Web: Project Health Viz
X: #ProjectHealthViz
Diversity in Data
An initiative centered around diversity, equity & awareness by visualizing provided datasets each month.
Web: Diversity in Data
X: #DiversityinData
Sports Viz Sunday
Create and share data visualizations using rich, sports-themed data sets in a monthly challenge.
Web: Sports Viz Sunday
X: #SportsVizSunday
Real World Fake Data
Create business dashboards using provided data sets for various industries and departments.
Web: Real World Fake Data
X: #RWFD
2024 - Admin Insights
Data Plus Music
A monthly project visualizing the data behind the music we love!
Web: Data Plus Music
X: #DataPlusMusic
関連ストーリー

DataFam Roundup: February 24-28, 2025

DataFam Roundup: February 17-21, 2025

DataFam Roundup: February 10-14, 2025
Subscribe to our blog
Tableau の最新情報をメールでお知らせします