DataFam Roundup: July 8–12, 2024


Welcome! Dig into this week's DataFam Roundup—a weekly blog that brings together community content all in one post. As always, we invite you to send us your content—and the DataFam content from your peers that have inspired you! Find the content submission form here.
Community Highlight
To recognize new and consistent Tableau contributors—we’re excited to have a section within the weekly DataFam Roundup called the Tableau Community Highlight. Find out how to get involved.

Federica Pinza, Business Student
Liguria, Italy
Federica Pinza is a business student currently completing a double degree at Dublin City University and Università Cattolica del Sacro Cuore. Federica was the recent winner of the EDHC Student Dataviz challenge.
After being introduced to Tableau through one of her courses, Federica became immediately captivated by the tool and the ability to transform data into compelling stories. While creating her first dashboard, she felt Tableau was a hidden talent she had just discovered which inspired her to enroll in the EDHC Student Dataviz Challenge. She aimed to create something new and learn along the way but was met with victory. Federica’s goal is to prioritize crafting a clear and engaging narrative over simply explaining the data tables and their construction.
Connect with Federica on Linkedin, Tableau Public, and check out her winning viz here.
DataFam content
Dive into content created by the Tableau Community:
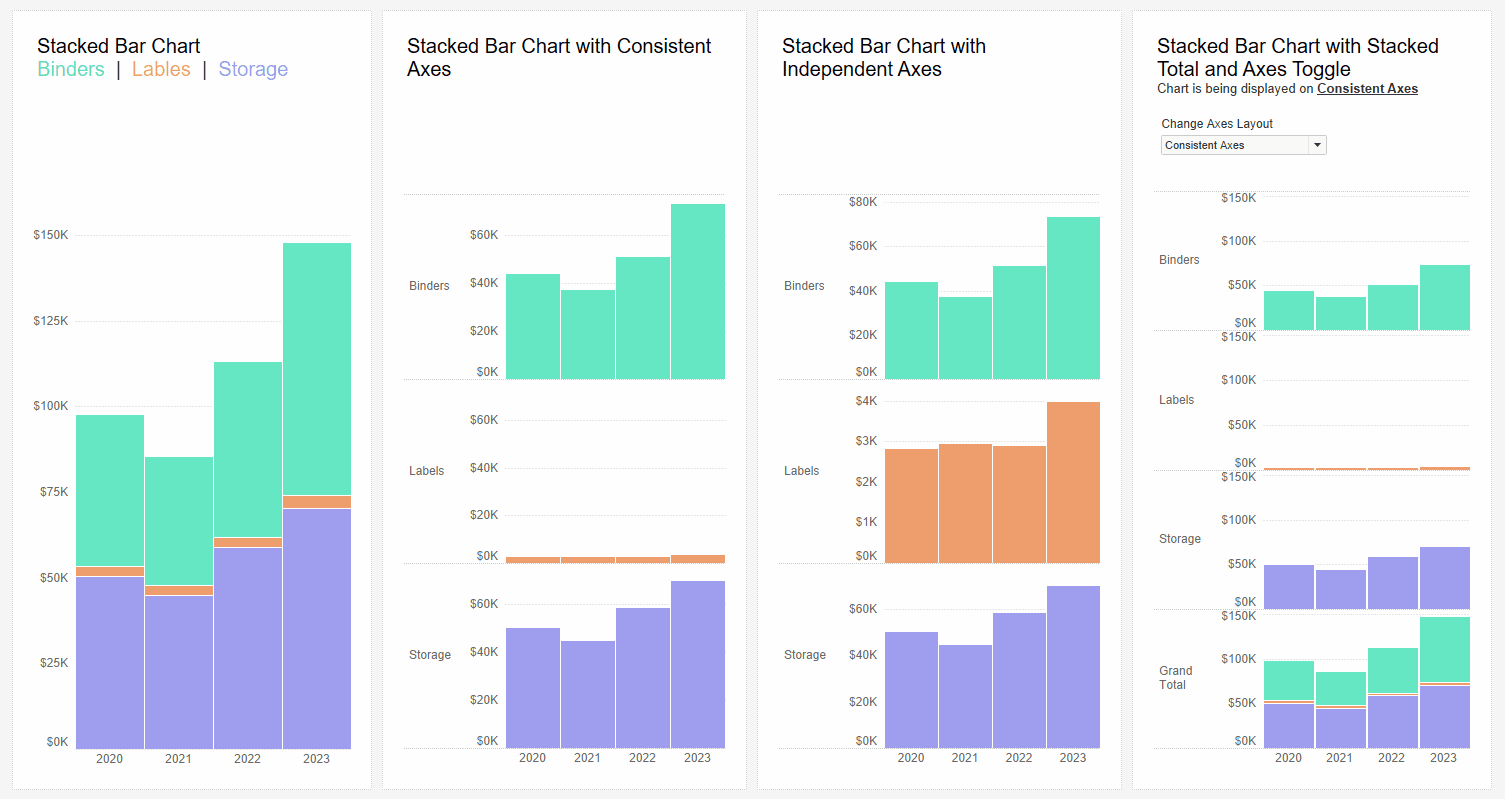
Kevin Flerlage, The Flerlage Twins: User Toggle for Consistent or Independent Axes: A solution for stacked bar charts
- Adam Green: Colour Bank No.5 | Tom Cruise Filmography
- Tableau2024.2】共享维度和“多事实关系模型”-Tableau喜乐君-敏捷BI布道师
- Kevin Flerlage, The Flerlage Twins: User Toggle for Consistent or Independent Axes: A solution for stacked bar charts
- Darrick Bartley, The Data Leadership Collaborative: Fresh Data: Managing a Key Business Asset
- Louis Yu: Secrets of the Viz: Volunteer Impact
- Brittany Rosenau: Tableau Polygons 101
- Rika Fujiwara: Let's Talk About the New Image of the Tableau Creator
- Kyle Massey: Tableau API Authentication: A Deep Dive
- Will Sutton: Breath of the Wild: Vegan Mode | The Legend of Zelda | #GamesNightViz
- Anirudh Somadas: Real time data streaming with Tableau
-
Christina Gorga: What It Looks Like to Show Up as a Leader When Life Throws a Wrench
-
Zach Bowders: Data + Love = From Dentures to Data with Heather Cox
Team Tableau
- Build Your Data Analytics Portfolio with These 5 Essential Chart Types
- Winning with Tableau: Paul Ross’s Tips from Beginner to Iron Viz Champion
- Extend Your Visual Analytics with Tableau Viz Extensions
Upcoming events and community participation
- Contest Announcement with the AI + Tableau User Group: Create our Logo and Banner with AI! We’re excited to announce a contest for creating a new logo and banner for our community!
- CRM Analytics Community Office Hours! Have CRM Analytics questions? Want to know how to work with data? Want to learn something new? Have visualization ideas you want to share or need feedback on? Want to just hang out with a bunch of us? Come join us (virtual)!
- Lights, Camera, Action: Tableau and IMDb Launch Data Visualization Campaign for Movie Lovers
- DataFam Birthday Roundup! In the effort of continuing support for one another, we thought it would be fun to gather data on DataFam birthdays! If you're willing, could you let us know which day you celebrate your birthday? Just go ahead and pick the day from this year's calendar, since it's a leap year and all possible days are available to choose from!
- Mentorship Program by the Data Visualization Society
- Women in Dataviz Virtual Coffee Breaks: Held every sixth Thursday morning and every sixth Wednesday afternoon in the EST time zone, Virtual Coffee Breaks are a casual networking event. Feel free to drop in and out as you need toduring the hour, and stay for as little time or as long as you want.
Vizzes
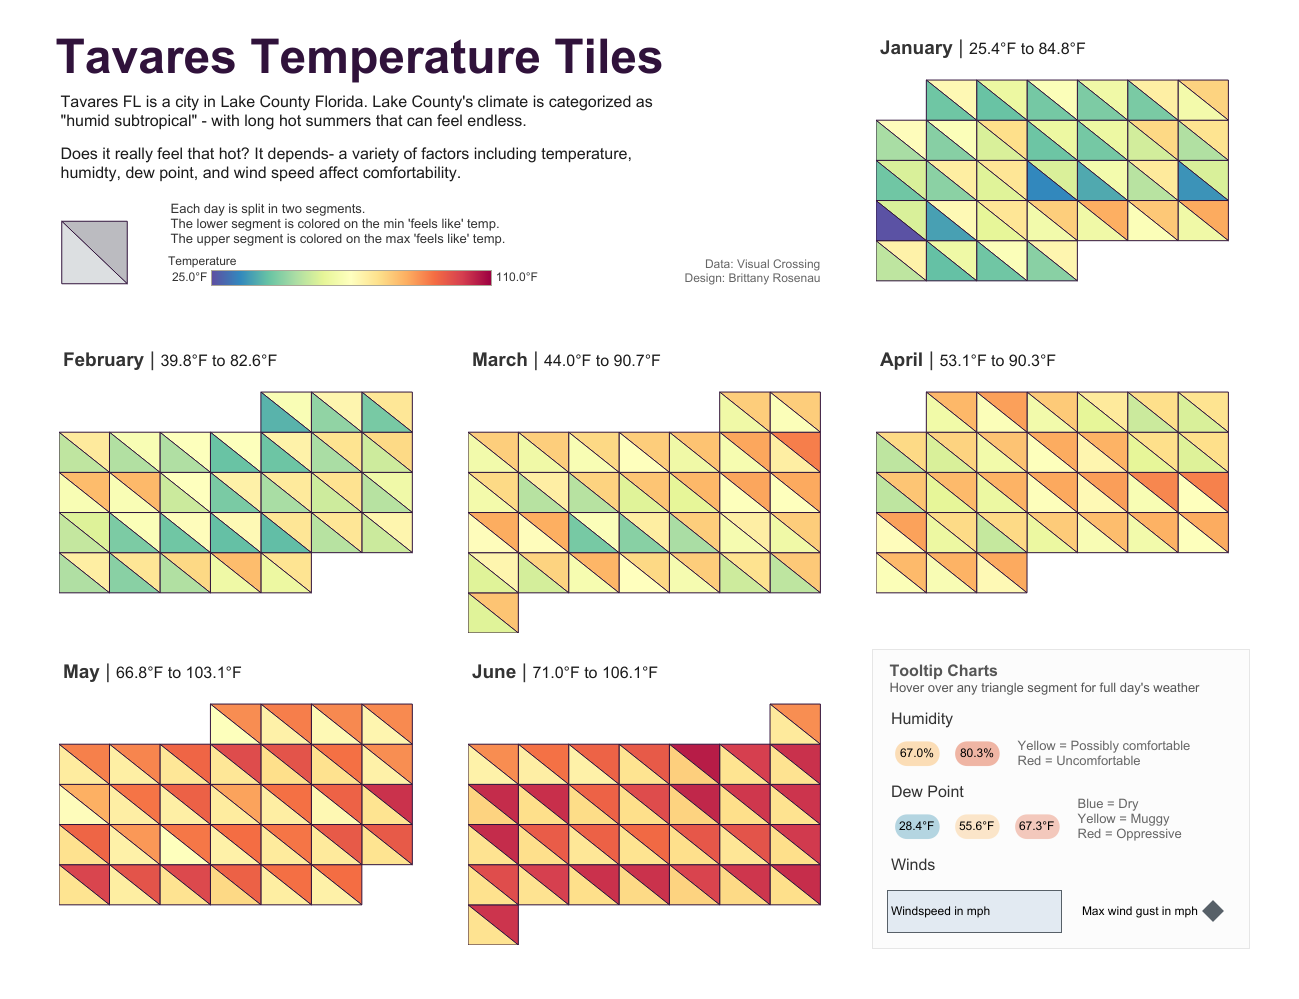
Brittany Rosenau: Tavares Temperature Tiles
See the latest Viz of the Day, trending vizzes, featured authors, and more on Tableau Public.
Check out some inspirational vizzes created by the community:
- Marc Reid: UK 2024 Election - % Votes vs. % Seats
- Joshua Preston: Zelda Recipes | #GamesNightViz
- Rob Taylor: Lewis Hamilton | The Great British F1 Driver
- Brittany Rosenau: Tavares Temperature Tiles
-
Rida Hamid: European Championship 2024
Community Projects
Back 2 Viz Basics
A bi-weekly project helping those who are newer in the community and just starting out with Tableau. Not limited just to newbies!
Web: Back 2 Viz Basics
X: #B2VB
Week 13: Build a Box & Whisker Plot
Workout Wednesday
Build your skills with a weekly challenge to re-create an interactive data visualization.
Web: Workout Wednesday
X: #WOW2022
Week 28: Can you design a multi-dimensional Panel Chart for detailed analysis?
Preppin' Data
A weekly challenge to help you learn to prepare data and use Tableau Prep.
Web: Preppin’ Data
X: #PreppinData
Week 27: Wimbledon Special
Makeover Monday
Create business dashboards using provided data sets for various industries and departments.
Web: Makeover Monday
X: #MakeoverMonday
Week 28: The Rise & Rise of LLM's
DataFam Con
A monthly challenge covering pop culture and fandoms.
Web: DataFam Con
X: #DataFamCon
March 2024 Challenge: Sports Movies Edition
EduVizzers
A monthly project connecting real education data with real people.
Web: Eduvizzers
July 2024: Texas Education Agency
Viz for Social Good
Volunteer to design data visualizations that help nonprofits harness the power of data for social change.
Web: Viz for Social Good
X: #VizforSocialGood
Games Night Viz
A monthly project focusing on using data from your favorite games.
Web: Games Nights Viz
X: #GamesNightViz
Season 2: Cooking up the Spice of Data
Iron Quest
Practice data sourcing, preparation, and visualization skills in a themed monthly challenge.
Web: Iron Quest
X: #IronQuest
Women
Storytelling with Data
Practice data visualization and storytelling skills by participating in monthly challenges and exercises.
Web: Storytelling with Data
X: #SWDChallenge
July 2024: graphing for—or with—kids
Project Health Viz
Uncover new stories by visualizing healthcare data sets provided each month.
Web: Project Health Viz
X: #ProjectHealthViz
Diversity in Data
An initiative centered around diversity, equity & awareness by visualizing provided datasets each month.
Web: Diversity in Data
X: #DiversityinData
Sports Viz Sunday
Create and share data visualizations using rich, sports-themed data sets in a monthly challenge.
Web: Sports Viz Sunday
X: #SportsVizSunday
Real World Fake Data
Create business dashboards using provided data sets for various industries and departments.
Web: Real World Fake Data
X: #RWFD
2024 - Admin Insights
Data Plus Music
A monthly project visualizing the data behind the music we love!
Web: Data Plus Music
X: #DataPlusMusic
関連ストーリー

DataFam Roundup: February 24-28, 2025

DataFam Roundup: February 17-21, 2025

DataFam Roundup: February 10-14, 2025
Subscribe to our blog
Tableau の最新情報をメールでお知らせします