DataFam Roundup: January 15–19, 2024
Welcome! Dig into this week's DataFam Roundup—a weekly blog that brings together community content all in one post. As always, we invite you to send us your content—and the DataFam content from your peers that have inspired you! Find the content submission form here.
Community Highlight
To recognize new and consistent Tableau contributors—we’re excited to have a section within the weekly DataFam Roundup called the Tableau Community Highlight. Find out how to get involved.
Maureen Okonkwo, Business Intelligence Analyst
Lagos State, Nigeria
Maureen Okonkwo is a Business Intelligence Analyst. She stays active in the community by participating in Tableau User Groups, the Tableau Forums, and community projects such as Workout Wednesday and Back 2 Viz Basics, however, Maureen’s most significant contribution to the Tableau Community is her podcast, Real Time with T&M.
In addition to using Tableau at work to build business dashboards and in her personal life to make her interests come to life on Tableau Public, Maureen describes Tableau as a way that she has been able to learn storytelling skills through learning how to present data in an interactive way.
When starting out her career as a data analyst, Maureen recalls dealing with feelings of imposter syndrome. After connecting with many women in the Nigerian community who shared similar experiences, Maureen was prompted to share her journey on a platform where people could not only hear about her successes but also her struggles. Her podcast, Real Time with T&M, is focused on the career trajectories of industry professionals and aims to provide listeners with a realistic view of the industry and practical advice on navigating their own paths.
Connect with Maureen on Linkedin, X, and Tableau Public.
DataFam content
Dive into content created by the Tableau Community:

-
Alexander Waleczek, Curved Discussion:
-
Brittany Rosenau: 5 Tiny Tips to get the most out of Tableau Public
-
Mark Palmer, The Data Leadership Collaborative: Decentralized Data Governance as a Center of Excellence
-
Jennifer Dawes, Jade Corley, Lauren Morrison, Katie Benton, Her Data: Iron Viz and Analytic Vizion
-
David Kelly, Data + Love: Guerilla Analytics, Data Doctoring, and Tableau Prep
-
Bridget Cogley: How are sheets named? Tableau Tip
-
Sean Miller, HipsterVizNinja: How have MLB salaries changed over the last 20 years? - HipsterVizNinja
-
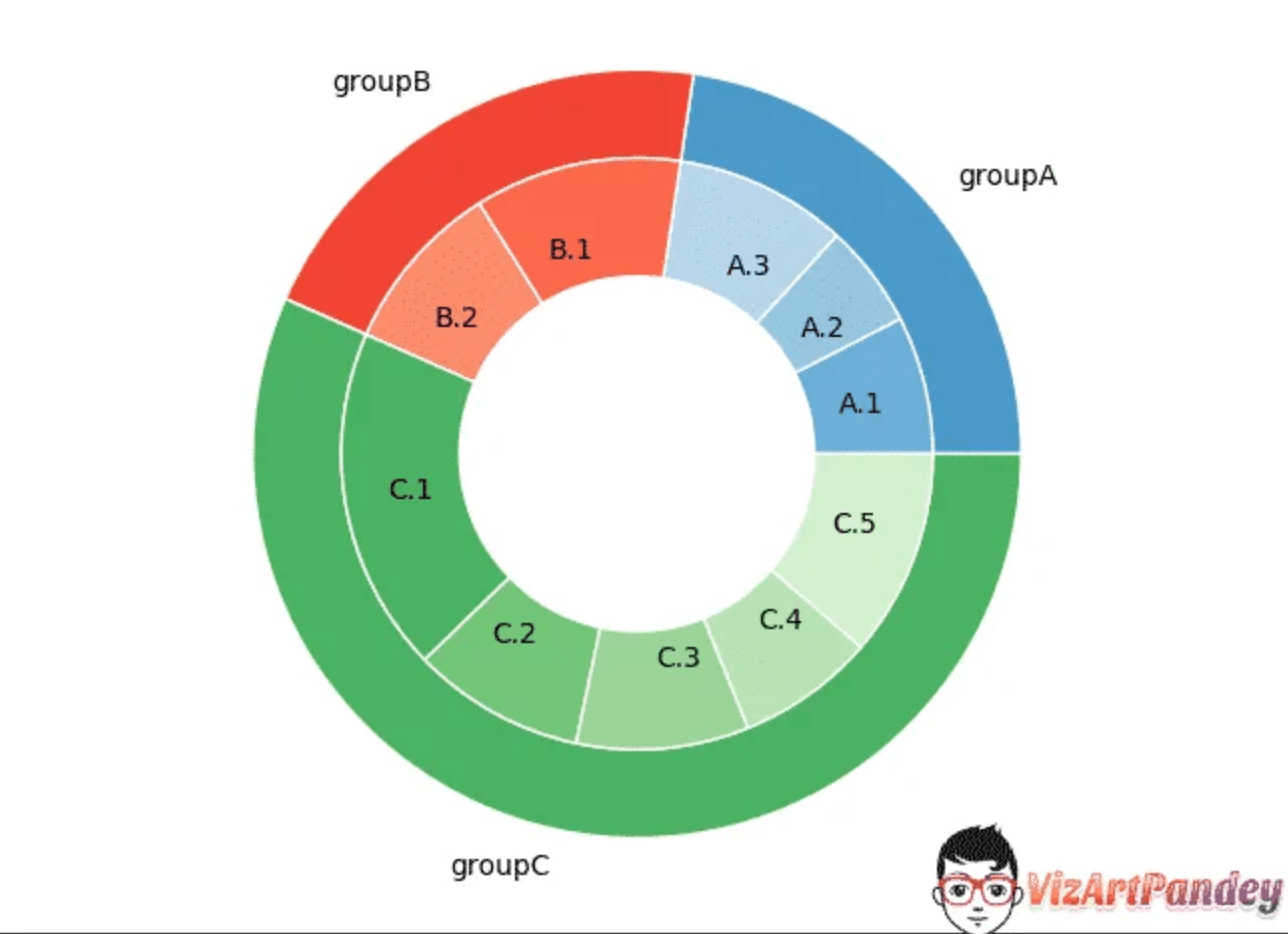
Rajeev Pandey: Nested Pie Charts in Tableau
-
Tore Levinsen: #TinyTableauTip
Team Tableau
-
Practice and Grow Your Data Skills with Tableau Community Projects
- Transforming Ideas into Features: Tableau's Commitment to Community-Driven Innovation
- How Victor Muñoz Landed a Data Visualization Gig Using Hire Me
Upcoming events and community participation
-
Lights, Camera, Action: Tableau and IMDb Launch Data Visualization Campaign for Movie Lovers
-
READY TO SUPERCHARGE YOUR DATA SKILLS? The Information Lab has free, on demand training courses will help you to make sense of your data and take you from zero to data hero. Developed by our industry leading trainers, our expansive courses cover the basics to intermediate levels of Tableau, Alteryx and Tableau Prep! You can take advantage of the whole course or simply choose the modules you need to brush up on your skills. Start your data journey today by simply selecting your training course below.
-
Demystifying the way to learn Data Visualization! Are you looking for a way to learn Data Visualization and feeling lost? We all have been there and I am going to help you understand the fundamentals and look for a way to learn data visualization.
-
Viz Collab: Hello everyone! I’m excited to be opening #VizCollab back up for another round of matches! In the last year I matched around 40 people for some amazing vizzes, including Viz of the Days and a viz that was featured in a local publication. So if you want to find a collaboration partner sign up.
Vizzes
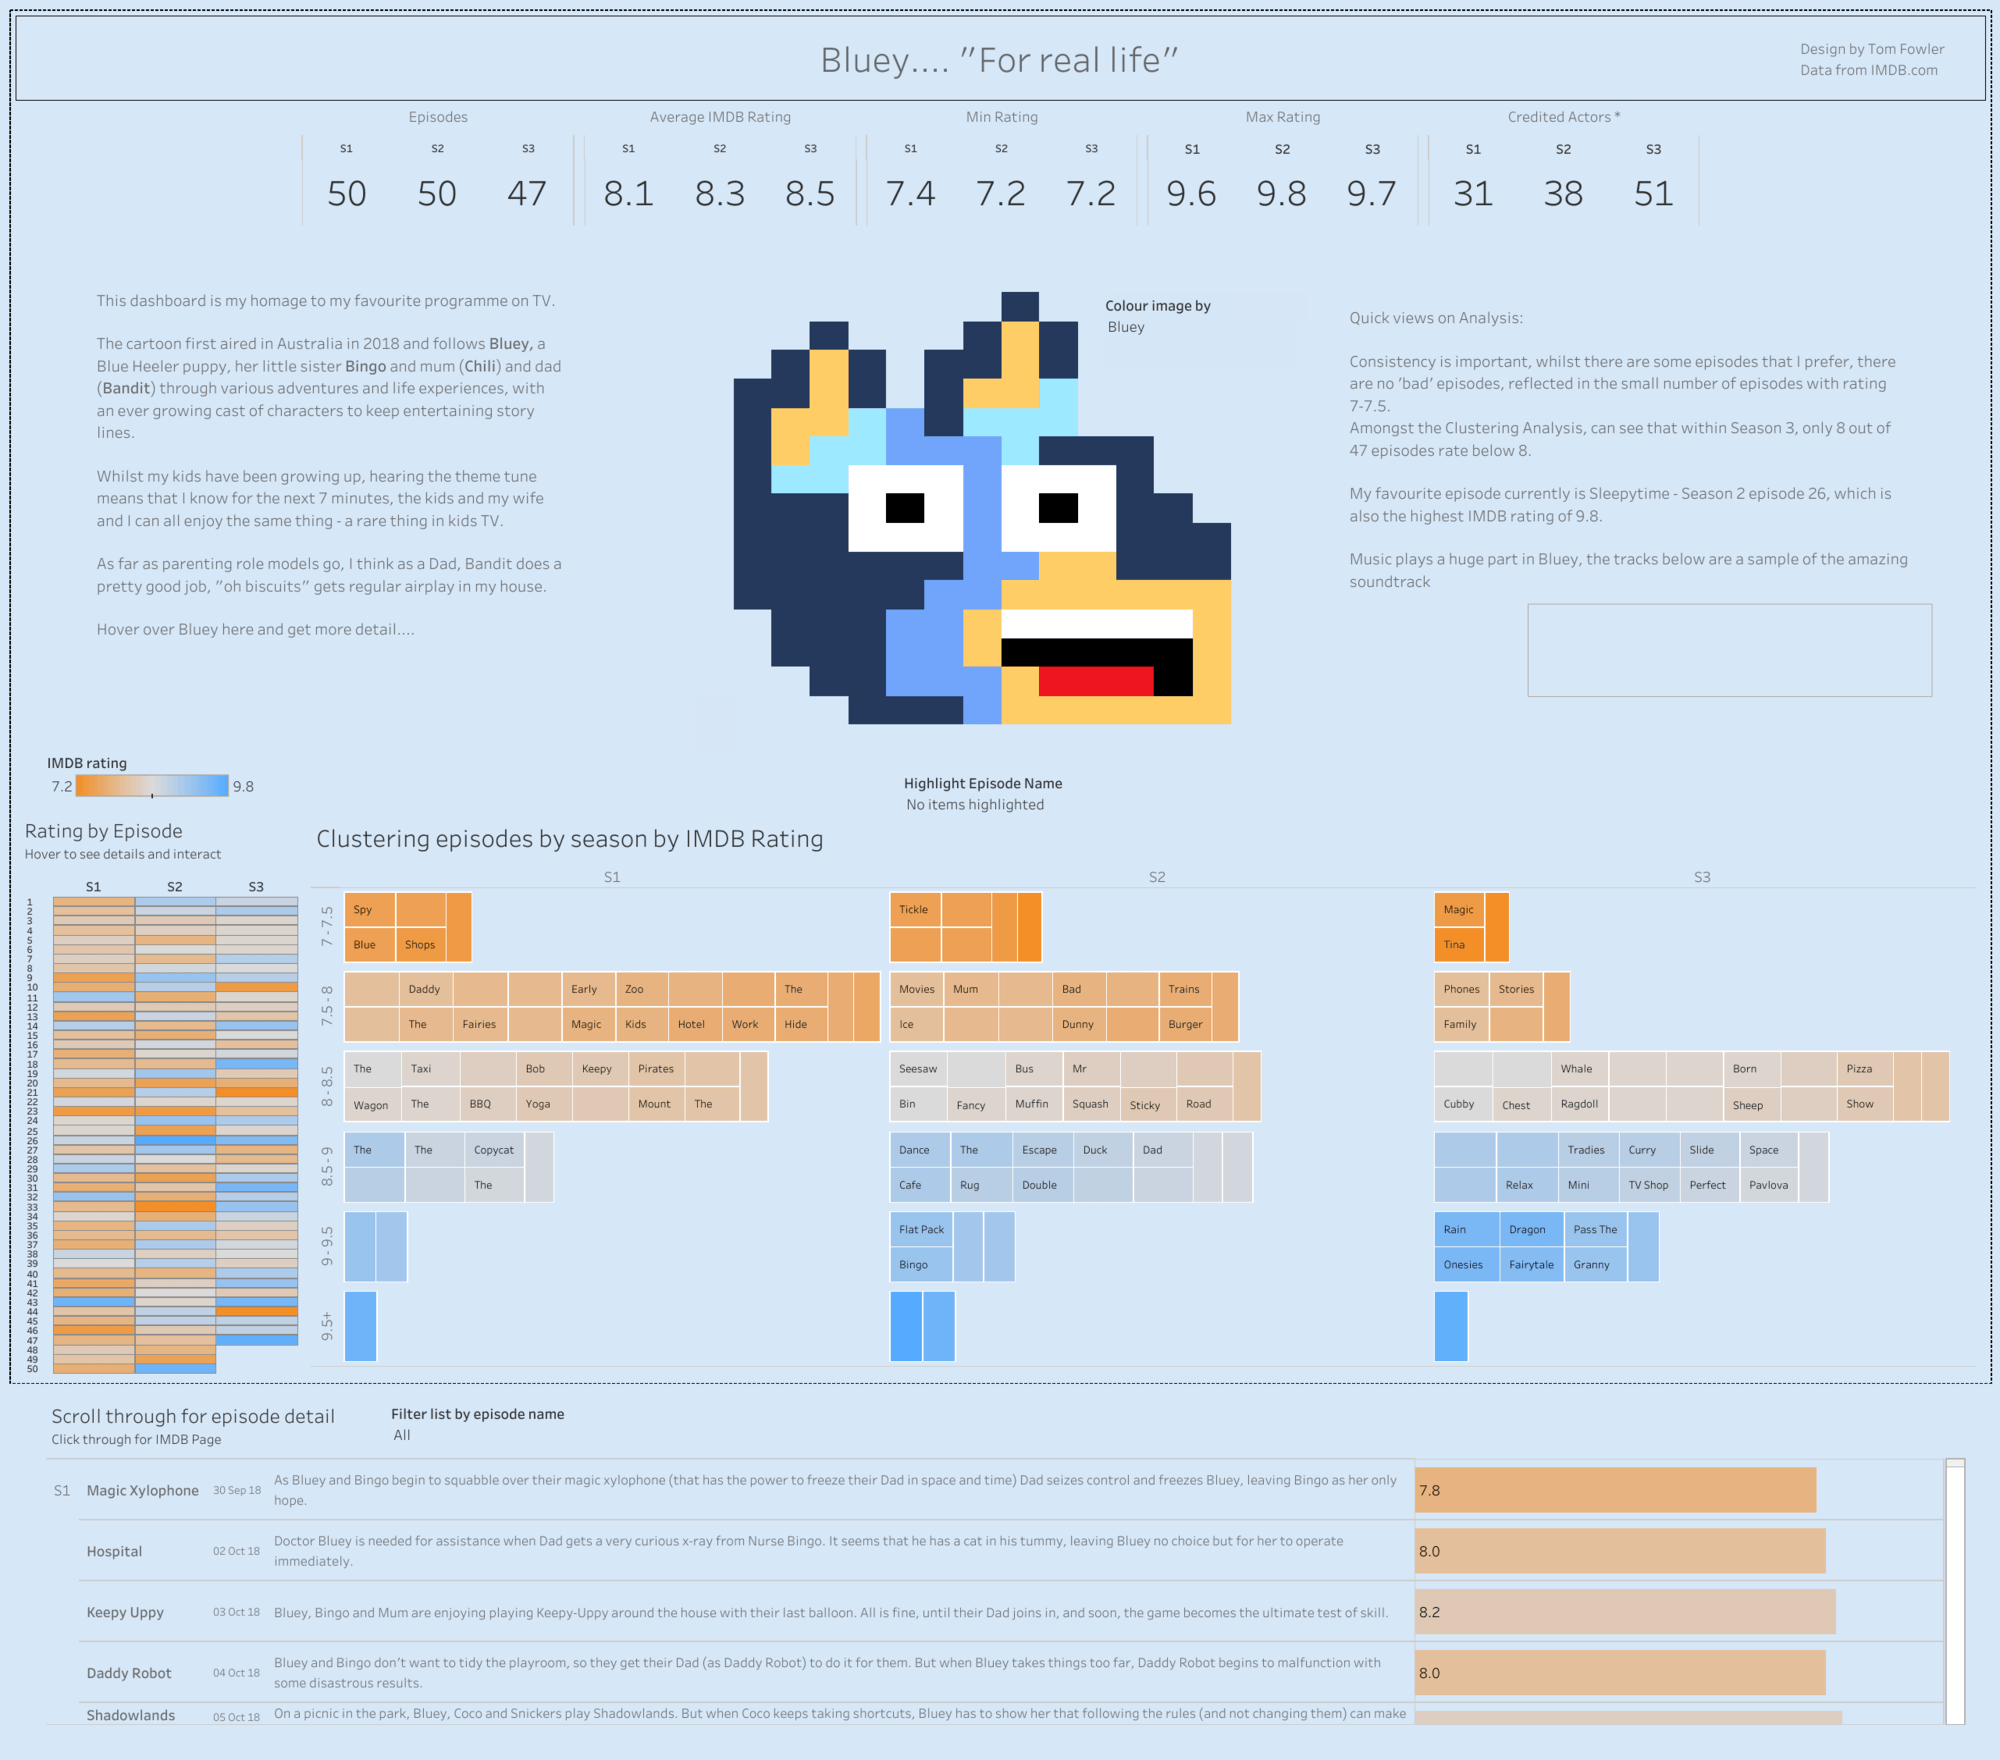
Tom Fowler: Bluey
See the latest Viz of the Day, trending vizzes, featured authors, and more on Tableau Public.
Check out some inspirational vizzes created by the community:
-
Jay Charole: New Year Resolution
-
Jessica Moon and Elisa Davis: Iron Viz Qualifier Entries 2024
-
Sam Epley: #MakeoverMonday 2022 Week 51: The Decline of Christianity & Growth of Non-Religious Belief
- Jennifer Dawes: Mamma Mia - Thank you for the Music
- Chimdi Nwosu: #MakeoverMonday 2024 Wk1 - New Year Resolutions
-
Adrian Zinovei: MOM_W01_2024_Done
-
Joy (Jhoie) Victor: Age's Effect on New Year Resolutions
-
Shreya Arya: New Year Resolutions | Makeover Monday
-
Naresh Suglani: KPI Cards | London Crime
-
Tom Fowler: Bluey
Community Projects
Back 2 Viz Basics
A bi-weekly project helping those who are newer in the community and just starting out with Tableau. Not limited just to newbies!
Web: Back 2 Viz Basics
Twitter: #B2VB
Week 1: Build a Line Chart
Workout Wednesday
Build your skills with a weekly challenge to re-create an interactive data visualization.
Web: Workout Wednesday
Twitter: #WOW2022
Week 3: Can you dynamically zoom into a clustered area?
Preppin' Data
A weekly challenge to help you learn to prepare data and use Tableau Prep.
Web: Preppin’ Data
Twitter: #PreppinData
Week 3: Performance Against Targets
DataFam Con
A monthly challenge covering pop culture and fandoms.
Web: DataFam Con
Twitter: #DataFamCon
January 2024: Award-Winning Pictures
EduVizzers
A monthly project connecting real education data with real people.
Web: Eduvizzers
January 2024: The State of School Feeding Worldwide
Games Night Viz
A monthly project focusing on using data from your favorite games.
Web: Games Nights Viz
Twitter: #GamesNightViz
November 2023: Disney's Stacked Bar
Iron Quest
Practice data sourcing, preparation, and visualization skills in a themed monthly challenge.
Web: Iron Quest
Twitter: #IronQuest
White Space
Storytelling with Data
Practice data visualization and storytelling skills by participating in monthly challenges and exercises.
Web: Storytelling with Data
Twitter: #SWDChallenge
January 2024: upskill with UpSets
Project Health Viz
Uncover new stories by visualizing healthcare data sets provided each month.
Web: Project Health Viz
Twitter: #ProjectHealthViz
October 2023: Customizing Shapes with Opacity in Tableau
Diversity in Data
An initiative centered around diversity, equity & awareness by visualizing provided datasets each month.
Web: Diversity in Data
Twitter: #DiversityinData
November 2023: Disney Demographics
Sports Viz Sunday
Create and share data visualizations using rich, sports-themed data sets in a monthly challenge.
Web: Sports Viz Sunday
Twitter: #SportsVizSunday
Viz for Social Good
Volunteer to design data visualizations that help nonprofits harness the power of data for social change.
Web: Viz for Social Good
Twitter: #VizforSocialGood
Real World Fake Data
Create business dashboards using provided data sets for various industries and departments.
Web: Real World Fake Data
Twitter: #RWFD
Session 6: HR Cross-Function Mobility
Makeover Monday
Create business dashboards using provided data sets for various industries and departments.
Web: Makeover Monday
Twitter: #MakeoverMonday
Data Plus Music
A monthly project visualizing the data behind the music we love!
Web: Data Plus Music
Twitter: #DataPlusMusic
関連ストーリー
Subscribe to our blog
Tableau の最新情報をメールでお知らせします


