DataFam Roundup: August 9 - 13, 2021
Dig into the latest DataFam Roundup—a weekly blog that brings together community content all in one post. As always, we invite you to send us your content—and the DataFam content from your peers that have inspired you! Find the content submission form here.
DataFam content
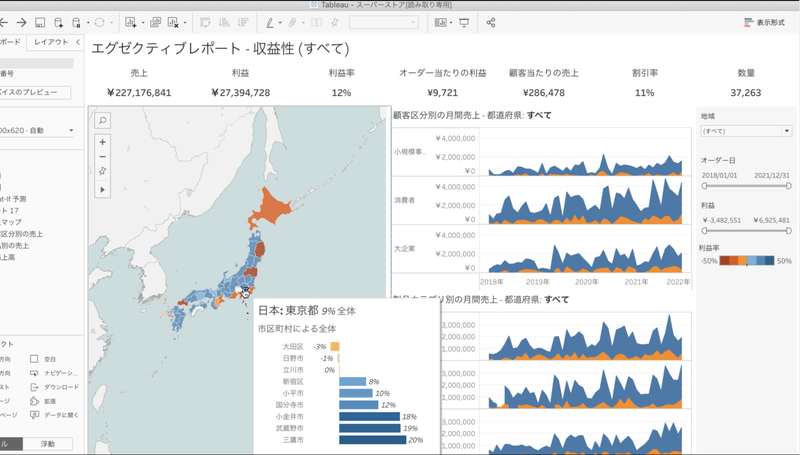
マーケターもも, なぜマーケターの私がTableau製品にハマったのか (Why I'm a Marketer I'm Addicted to Tableau Products, Japanese)
Dive into content created by the Tableau Community:
- Akanksha Ramchandani: Here’s why you need to add a Language Extension on Tableau
- Priyanka Dobhal: Tableau: Min(0), Avg(0)? Where would I use this?
- Donabel Santos, sqlbelle: Tableau Top 6-10 LOD Expressions - Practical Examples
- マーケターもも, なぜマーケターの私がTableau製品にハマったのか (Why I'm a Marketer I'm Addicted to Tableau Products, Japanese)
- Marcel Kintscher: How I prepared for the Tableau Server Certified Associate Exam
- Lindsay Betzendahl: Figma + Tableau - Using Alignment Tools
- Aishwarya Gupta: 5 Amazing Formatting Tips & Tricks For Tableau Dashboards
- Kevin Flerlage, The Flerlage Twins: Obscure PowerPoint Tricks
- Vani Agarwal, Tableau Tips and Tricks: Date Calculations Made Easy
- Simon Beaumont, Vizionary: Your Tableau Web-Edit Playbook
- Carl Alchin, Preppin' Data: How to… create a Running Total
- Noel Myung, Tableau Wiki: 평균으로부터의 거리를 구하는 Z-Score 활용하기 (Tableau Chart Using Z Score, Korean)
- Tim Ngwena, Tableau Tim: How to do multi-line calculations and edits for Tableau: Quick Tip
- Pearle Lundeen: Pearle’s Iron Viz 2021 Qualifiers Roundup of Joy!
Vizzes
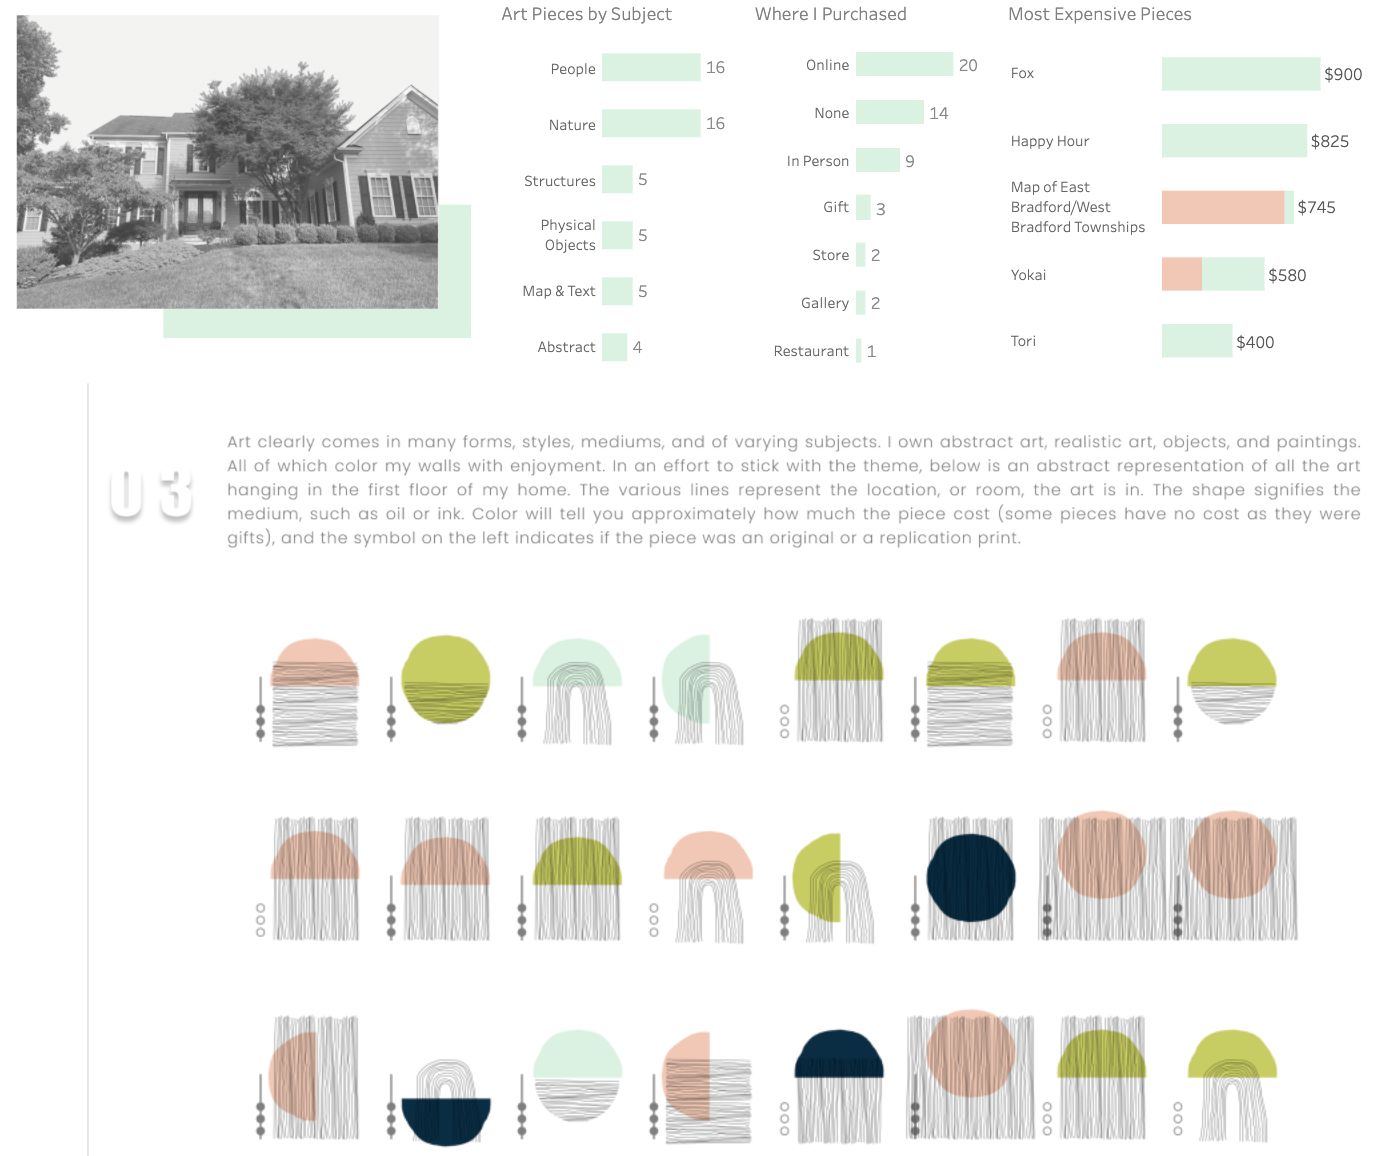
Lindsay Betzendahl: My House My Art
Catch this week’s Viz of the Days here and subscribe to get them emailed directly to your inbox.
Check out some inspirational vizzes created by the community:
-
Yoshitaka Arakawa: Tableau Release History
-
Lorela Ferhati: London Bike Collisions (2015-2019)
-
Lindsay Betzendahl: My House My Art
Makeover Monday
Join the community every Monday to work with a given data set and create better, more effective visualizations.
Web: Makeover Monday
Twitter: #MakeoverMonday
Week 32: Monthly Mortality Rates in England and Wales
Workout Wednesday
Build your skills with a weekly challenge to re-create an interactive data visualization.
Web: Workout Wednesday
Twitter: #WOW2021
Week 32: Tableau: Visualize our Survey Data
Sports Viz Sunday
Create and share data visualizations using rich, sports-themed data sets in a monthly challenge.
Web: Sports Viz Sunday
Twitter: #SportsVizSunday
August 2021: UFC
Iron Quest
Practice data sourcing, preparation, and visualization skills in a themed monthly challenge.
Web: Iron Quest
Twitter: #IronQuest
August 2021: Travel & Vacations
Storytelling with Data
Practice data visualization and storytelling skills by participating in monthly challenges and exercises.
Web: Storytelling with Data
Twitter: #SWDChallenge
August 2021: dashboard stories
Project Health Viz
Uncover new stories by visualizing healthcare data sets provided each month.
Web: Project Health Viz
Twitter: #ProjectHealthViz
SDG Viz Project
Visualize data about Sustainable Development Goals provided by the World Health Organization.
Web: SDG Viz Project
Twitter: #TheSDGVizProject
Goal 17: Partnerships for the Goals
Preppin' Data
A weekly challenge to help you learn to prepare data and use Tableau Prep.
Web: Preppin’ Data
Twitter: #PreppinData
Week 29: Changing Star Signs
Real World Fake Data
Create business dashboards using provided data sets for various industries and departments.
Web: Real World Fake Data
Twitter: #RWFD
Dataset #12: Hospitality
Viz 2 Educate
Each month, create vizzes on global education syllabus topics as resources for teachers worldwide.
Web: Viz 2 Educate
Twitter: #Viz2educate
Topic: Microbiology
Diversity in Data
An initiative centered around diversity, equity & awareness by visualizing provided datasets each month.
Web: Diversity in Data
Twitter: #DiversityinData
June 2021: Pride Month
Viz for Social Good
Volunteer to design data visualizations that help nonprofits harness the power of data for social change.
Web: Viz for Social Good
Twitter: #VizforSocialGood
関連ストーリー
Subscribe to our blog
Tableau の最新情報をメールでお知らせします


