DataFam Roundup: August 19-23, 2024


Welcome! Dig into this week's DataFam Roundup—a weekly blog that brings together community content all in one post. As always, we invite you to send us your content—and the DataFam content from your peers that have inspired you! Find the content submission form here.
Community Highlight
To recognize new and consistent Tableau contributors—we’re excited to have a section within the weekly DataFam Roundup called the Tableau Community Highlight. Find out how to get involved.

Aanchal Soni, Data Engineering Specialist
Pune, India
Aanchal Soni is a Data Engineering Specialist and YouTuber. She uses Tableau in her work, conducts training sessions as part of the Center of Excellence at work, and publishes content and tutorials related to Tableau on her YouTube channel. Aanchal got started with Tableau at a point in her career when she was looking to broaden her skillset. She was introduced to the tool by a friend who helped her get started and she began her learning journey using the content available on Tableau.com and by participating in community projects like Workout Wednesday and Makeover Monday.
With the goal of giving back to the community, Aanchal started her YouTube channel. She hopes to help newbies strengthen their skills by creating content that includes introductory and explanatory videos, tips, shortcuts, custom implementations, interview questions, and more. Aanchal derives inspiration for her videos from roadblocks that she has encountered as well as problems that are shared with her from her viewers and other community members.
Connect with Aanchal on Linkedin, X, Tableau Public, and on her YouTube channel.
DataFam content
Dive into content created by the Tableau Community:
- Jennifer Dawes, her data: The Power of Collaboration in Data Visualization: Why Tableau Thrives on Shared Learning
- Louis Yu: Secrets of the Viz: Follower Stats
- Zach Bowders: Data + Love = Roses, Rockets, and Iron Viz with Jessica Moon by Data + Love
- Anastasiya Kuznetsova : How Charts Lie?
- Adam Mico: Evolving the Tableau Analyst’s Role in the Age of AI
- Waqar Ahmed Shaikh: Retail Transactions Business Dashboard using Tableau (End to End Project)
- Alexander Waleczek: The Future of Tableau!?
Team Tableau
- Data Literacy Basics Everyone Should Know
- Iron Viz 2024: Behind the Build featuring Chris Westlake
- Iron Viz 2024: Behind the Build featuring Pata Gogová
- Iron Viz 2024: Behind the Build featuring Jessica Moon
- Authors available for hire on Tableau Public
- 5 Tips from a Data Career Mentor
- Winning with Tableau: Paul Ross’s Tips from Beginner to Iron Viz Champion
Upcoming events and community participation
- Dreamin' in Data Dreamin’ in Data is the first Salesforce Community Conference purpose-built to help showcase the entire journey of your organization’s data, from Salesforce (your CRM), through integrations with other applications (using MuleSoft), and finally to analysis and determining the story your data is telling (using Tableau) – ultimately to help your organization make smarter decisions faster and stay ahead of your competition.
- Discussing Effective Design and data prep in Tableau, August 17
- Mark your calendars and join the Data Book Club as we explore, Chart Spark by Alli Torban, and the book's key themes and practical applications in our professional and personal lives. We will be meeting virtually starting August 2nd at 11am CT, but we also have a Slack space to discuss the book asynchronously as well as share notes, ideas, and resources!
- Contest Announcement with the AI + Tableau User Group: Create our Logo and Banner with AI! We’re excited to announce a contest for creating a new logo and banner for our community!
- CRM Analytics Community Office Hours! Have CRM Analytics questions? Want to know how to work with data? Want to learn something new? Have visualization ideas you want to share or need feedback on? Want to just hang out with a bunch of us? Come join us (virtual)!
- Lights, Camera, Action: Tableau and IMDb Launch Data Visualization Campaign for Movie Lovers
- DataFam Birthday Roundup! In the effort of continuing support for one another, we thought it would be fun to gather data on DataFam birthdays! If you're willing, could you let us know which day you celebrate your birthday? Just go ahead and pick the day from this year's calendar, since it's a leap year and all possible days are available to choose from!
- Mentorship Program by the Data Visualization Society
- Women in Dataviz Virtual Coffee Breaks: Held every sixth Thursday morning and every sixth Wednesday afternoon in the EST time zone, Virtual Coffee Breaks are a casual networking event. Feel free to drop in and out as you need toduring the hour, and stay for as little time or as long as you want.
Vizzes
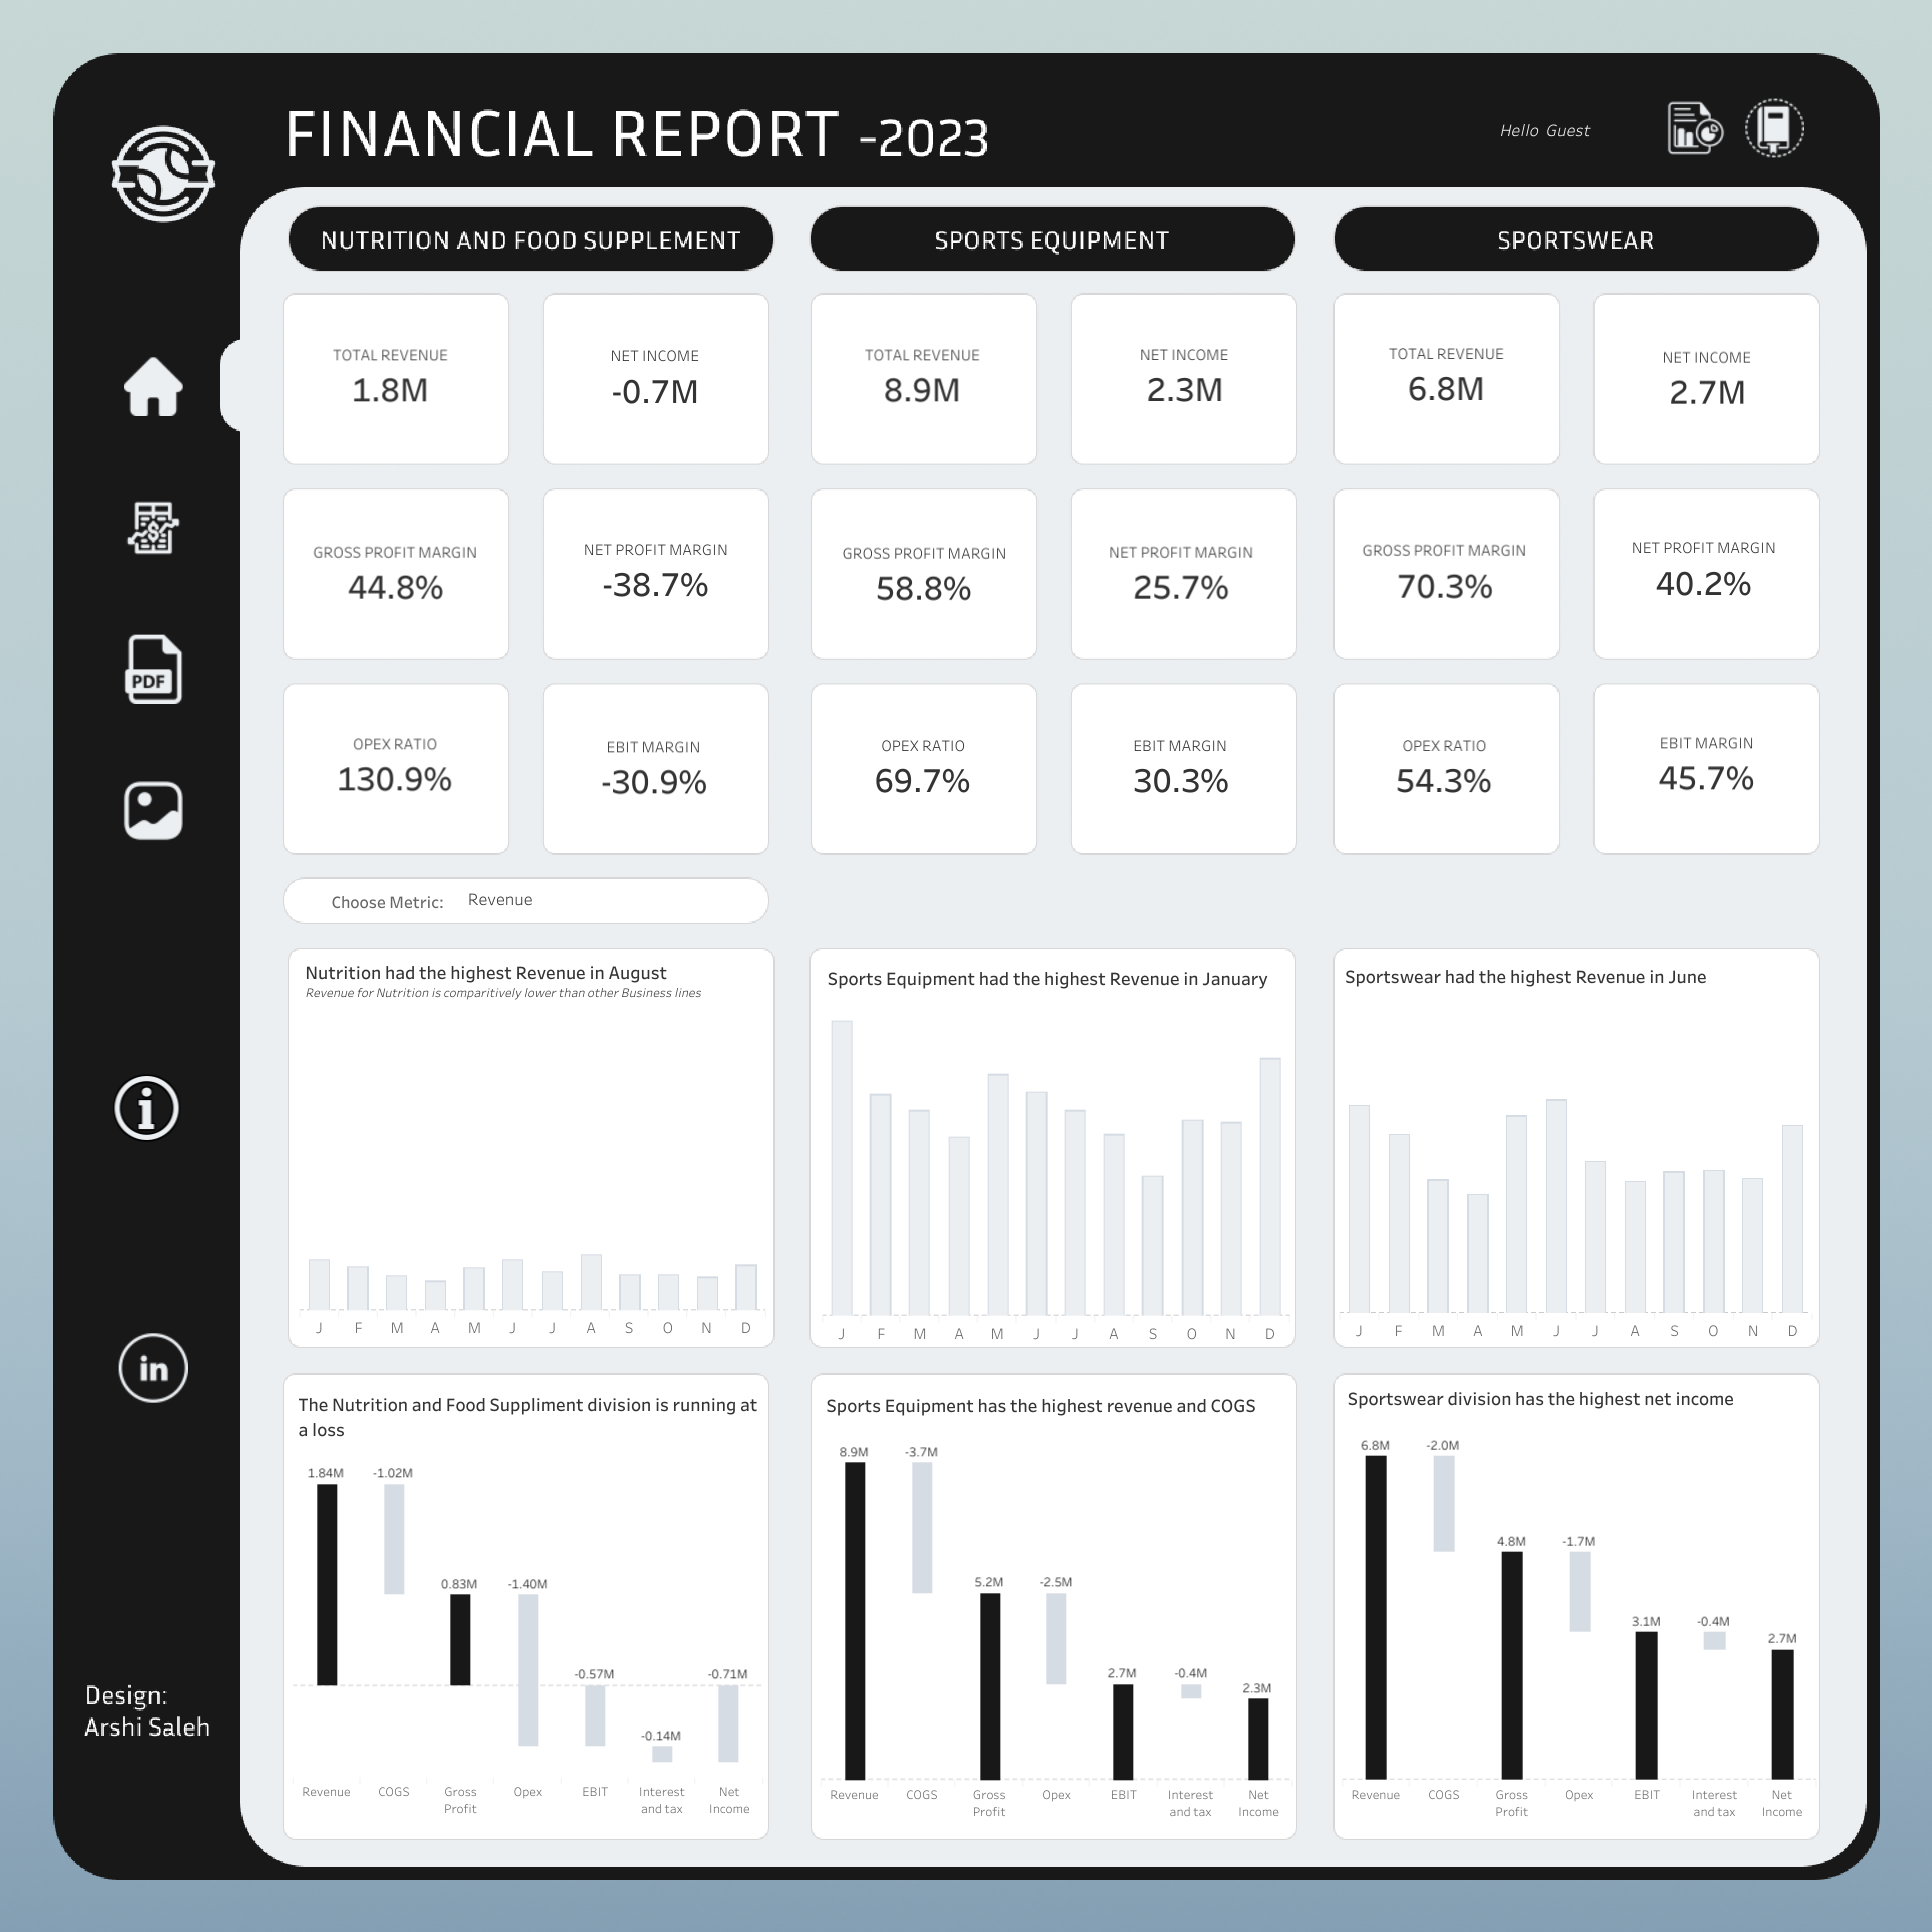
Arshi Saleh: Financial Performance Report - #OnyxDataChallenge
See the latest Viz of the Day, trending vizzes, featured authors, and more on Tableau Public.
Check out some inspirational vizzes created by the community:
- Kirk Munroe: The many kilometers travelled during a Formula 1 season
- Tamás Varga: US Social Media Usage
- Israel Ayoola: Media Freedom
- Tobiloba Babajide: Social Media Usage
- Uduak Afang: Help Desk Dashboard #RWFD
- Jonathan Akpogbo Chris: What Social Media Platform do Americans use the most? | #Makeovermonday Week 34
- Uduak Afang: SocialMedia Usage Demographics #MakeverMonday
- Hideaki Yamamoto / Chasoso: My Tableau Public Portfolio
- Arshi Saleh: Financial Performance Report - #OnyxDataChallenge
- Ojoswi Basu: Pigeons of NYC
Community Projects
Back 2 Viz Basics
A bi-weekly project helping those who are newer in the community and just starting out with Tableau. Not limited just to newbies!
Web: Back 2 Viz Basics
X: #B2VB
Week 16: Build a Sankey Chart
Workout Wednesday
Build your skills with a weekly challenge to re-create an interactive data visualization.
Web: Workout Wednesday
X: #WOW2022
Week 34: Can You Control the Displayed Data Based On Sub-Category Assignment?
Preppin' Data
A weekly challenge to help you learn to prepare data and use Tableau Prep.
Web: Preppin’ Data
X: #PreppinData
Week 34: The Prep School Birthday Cakes part 3
Makeover Monday
Create business dashboards using provided data sets for various industries and departments.
Web: Makeover Monday
X: #MakeoverMonday
Week 34: Which social media platforms are most common?
Visual Climate
Collaborate and share climate data.
Web: Visual Climate
X: #VisualClimate
Gender Equality_ Women Entrepreneurship Participation
DataFam Con
A monthly challenge covering pop culture and fandoms.
Web: DataFam Con
X: #DataFamCon
March 2024 Challenge: Sports Movies Edition
EduVizzers
A monthly project connecting real education data with real people.
Web: Eduvizzers
August 2024: Analyze Boston – Department of Innovation and Technology
Viz for Social Good
Volunteer to design data visualizations that help nonprofits harness the power of data for social change.
Web: Viz for Social Good
X: #VizforSocialGood
: Future Fridays
Games Night Viz
A monthly project focusing on using data from your favorite games.
Web: Games Nights Viz
X: #GamesNightViz
Season 2: Cooking up the Spice of Data
Iron Quest
Practice data sourcing, preparation, and visualization skills in a themed monthly challenge.
Web: Iron Quest
X: #IronQuest
Iron Quest – Maps II
Storytelling with Data
Practice data visualization and storytelling skills by participating in monthly challenges and exercises.
Web: Storytelling with Data
X: #SWDChallenge
July 2024: graphing for—or with—kids
Project Health Viz
Uncover new stories by visualizing healthcare data sets provided each month.
Web: Project Health Viz
X: #ProjectHealthViz
Diversity in Data
An initiative centered around diversity, equity & awareness by visualizing provided datasets each month.
Web: Diversity in Data
X: #DiversityinData
Sports Viz Sunday
Create and share data visualizations using rich, sports-themed data sets in a monthly challenge.
Web: Sports Viz Sunday
X: #SportsVizSunday
Real World Fake Data
Create business dashboards using provided data sets for various industries and departments.
Web: Real World Fake Data
X: #RWFD
2024 - Admin Insights
Data Plus Music
A monthly project visualizing the data behind the music we love!
Web: Data Plus Music
X: #DataPlusMusic
関連ストーリー

DataFam Roundup: February 24-28, 2025

DataFam Roundup: February 17-21, 2025

DataFam Roundup: February 10-14, 2025
Subscribe to our blog
Tableau の最新情報をメールでお知らせします