Collaboration at the U.S. Army and Beyond
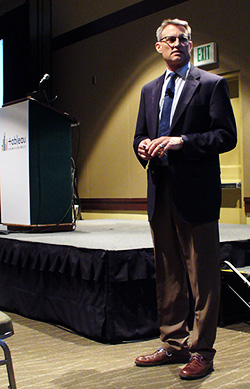
“It’s hard to get organizations that don’t see a compelling reason, to change,” said Charles Driessnack, formerly of the Army and now a vice president at SAIC. Driessnack presented at Tableau Conference last week.
"If there is a crisis in the organization, then it is a lot easier to get people to understand that they have to change,” he said. “What is the compelling reason that DOD (U.S. Department of Defense) has to change when we are the single superpower in the world?”

“The way to do that was to give them a single picture, what we call the Common Operating Picture (COP) that everyone sees,” he said. After exhaustively testing all the major players in data visualization software, SAIC and the DOD chose Tableau as their platform for rapid data integration and visualization.
“We wanted to have these views impact every part of the organization,” said Driessnack. “So, it wasn’t just a senior level dashboard, it wasn’t just for the staff. Every layer of the organization needed to be impacted. So, we had to create views that addressed the analyst level rolled up to the staff level. And then you had the leadership area that tied it all together.”
“It is happening in a big way with these views. When you show someone a picture and they see what is going on then you have given them a reason to change,” he said. And what a picture: Tableau dashboards can fill an entire wall of an Army strategic command center. “There can be 6 or 7 disciplines in that venue. Once you get one (dashboard implemented), then you get another and another into an integrated view," he said.
“Now the view is shaping what they are doing. It is shaping the culture. The view allows for that collaboration.” Each organization involved in the enterprise can really see the big picture and how their efforts are contributing to mission readiness for the Army.
“Foundationally, this is a very powerful approach. To change the culture we get the information in front of them and get them to see why they need to do something.”
To “see the bottlenecks or the short-fall and see that we will not be able to complete our mission and so we need to do something else,” he said.
“The view is showing them where they were, where they are now, and what they need to do.”
Watch a video from the Army Materiel Command featuring Tableau dashboards.
関連ストーリー
Subscribe to our blog
Tableau の最新情報をメールでお知らせします


