Best of the Tableau Web... August 2013
August has flown by and a fresh batch of stellar Tableau related content is ready for your consumption! I'm filling in for Andy this month to bring you a roundup of some awesome content from all of the deep, dark corners of the web!
Tableau tips
- The Information Lab Cascading Quick Filters in Tableau
- Interworks Understanding Layout Containers in Tableau
- Paint by Numbers A quick Tableau Tip - showing and hiding labels
- Tableau Love Friday “Simple but amazingly useful” nugget for #Tableau
- ScraperWiki Adventures in Tableau – loading files
- Breaking BI Calculating Top and Bottom N% of Customers
- 3danim8's Blog How to use a trick in #Tableau for adjusting a scatter plot trend line
Tableau use cases
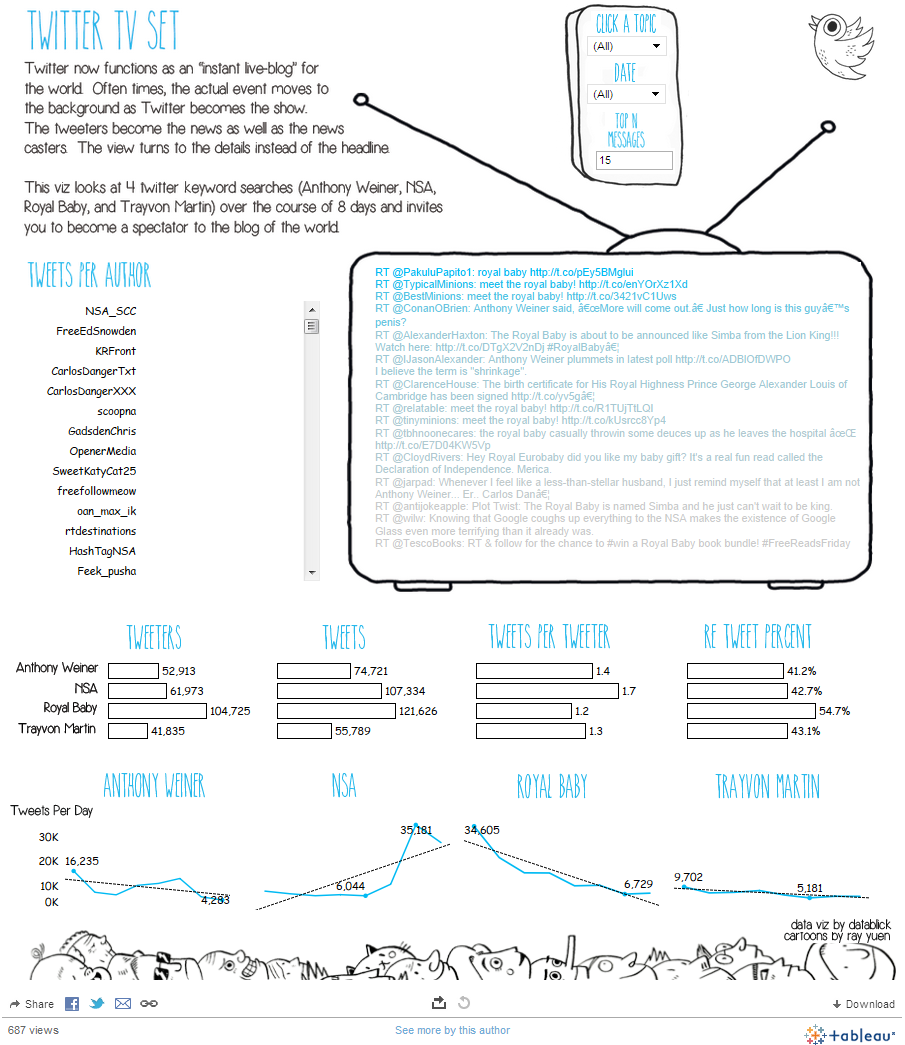
- Datablick Jimmy Jet and his Twitter TV Set
- Concentra Deprivation in your area of London – How does it look?
- The Guardian Visualised: biking the London-Surrey 100
- Data Remixed Worldwide Open Data Sites
Tableau Jedi
- Alan Smithee Presents Tableau Menu Navigation using Parameters
- Tableau Friction Dashboard Text Links - Adding and Customizing, no Worksheets Needed
- Ben Sullins Embedding Google News Feeds into Tableau Dashboards
- DataRemixed How to View your Website Stats in Tableau
Tableau commentary
- Eager Eyes The Perfect Visualization
- VizPainter Metropolitan Statistical Areas (MSAs) in Tableau
- VizWiz When left-aligned labels go right and right-aligned labels go left....
Tableau hackers
- If We Assume CUBEHELIX now for Tableau!
- VizWiz Tableau Trend Line Art
- Jewel Loree Tableau Hacks: Gifs to Workbooks
That should keep you going for another month. Let Andy know what you think and how we can improve these lists on twitter (@acotgreave)
Subscribe to our blog
Tableau の最新情報をメールでお知らせします


