Tackle your geospatial analysis with ease in Tableau 10.2
Update: Tableau 10.2 is here! Download now to try out the feature outlined below.
Does geography influence your business? Is location the focus of your analysis? Nearly everyone looking for insights into data will answer yes to these questions at some point.
For many of you, working with spatial data is a daily requirement. For you and the rest of the map geeks out there, Tableau 10.2 includes a native connector to spatial data. This capability will make working with any spatial data much easier while improving the performance of working with custom polygons.
The spatial file connector allows anyone to connect to Esri Shapefiles, KML, MapInfo tables, and GeoJSON files. These are the most common spatial file formats and you can find data available for download from open-data portals around the world. Here are some of my favorite examples:
From the US:
- Data.gov: full catalog of open data in the US
- Census.gov: census boundaries
- Open Data Philly: great example of what many major cities are offering
National data portals:
- UK Ordnance Survey: local administrative and electoral boundaries for Great Britain
- Swiss Open Data: administrative, conservation, utilities, and more spatial data of Switzerland
- Instituto Brasileiro de Geografia e Estatística (IBGE): comprehensive administrative and census data for Brasil
Global interest:
- GADM: catalog of administrative boundaries for nearly every country in the world
- HDX (Humanitarian Data Exchange): makes humanitarian data easy to find and use
But this feature is not just about connecting to open data. For many organizations with a GIS analyst or an entire GIS Department, you already have this data. Working with custom geography does not get any simpler and you can easily leverage your existing spatial data.
Get started with spatial files
You can start creating a map in three easy steps:
- Connect to a spatial file from the start page
- Jump to a worksheet
- Drag the Geometry field and the dimension by which to aggregate to the Detail shelf or directly onto the canvas
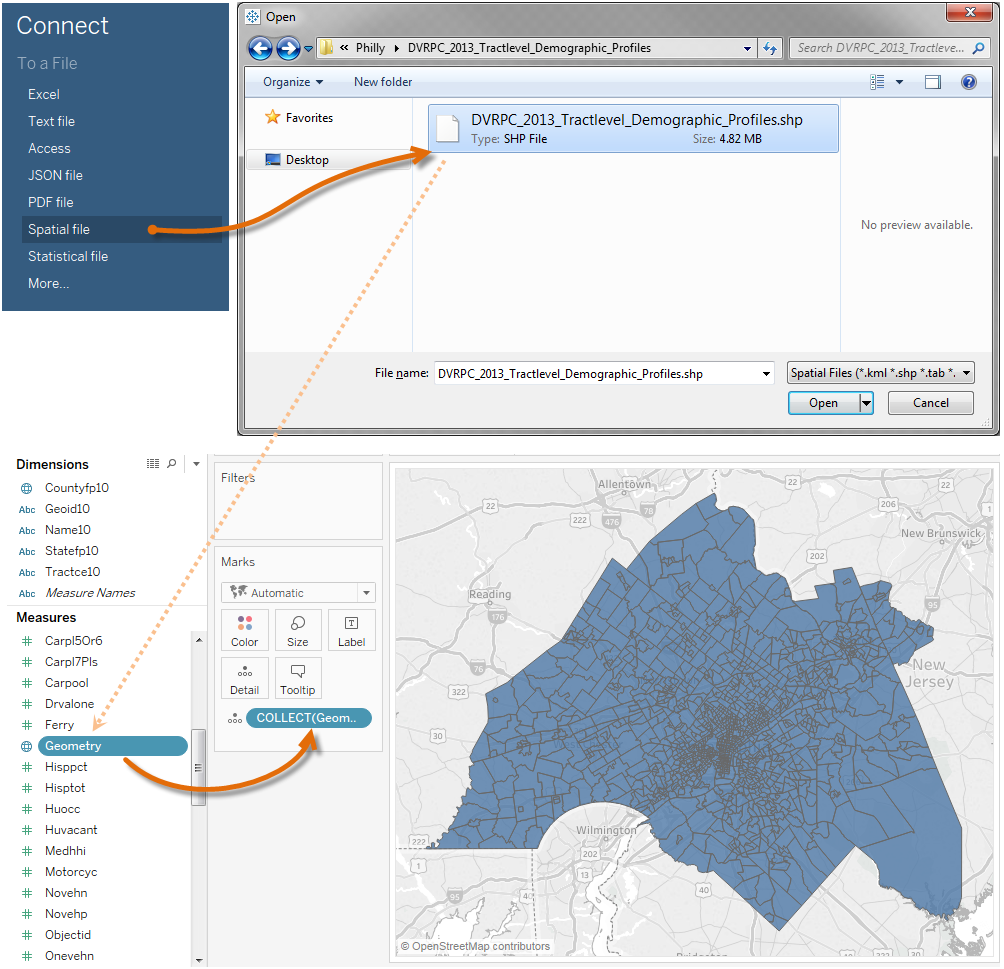
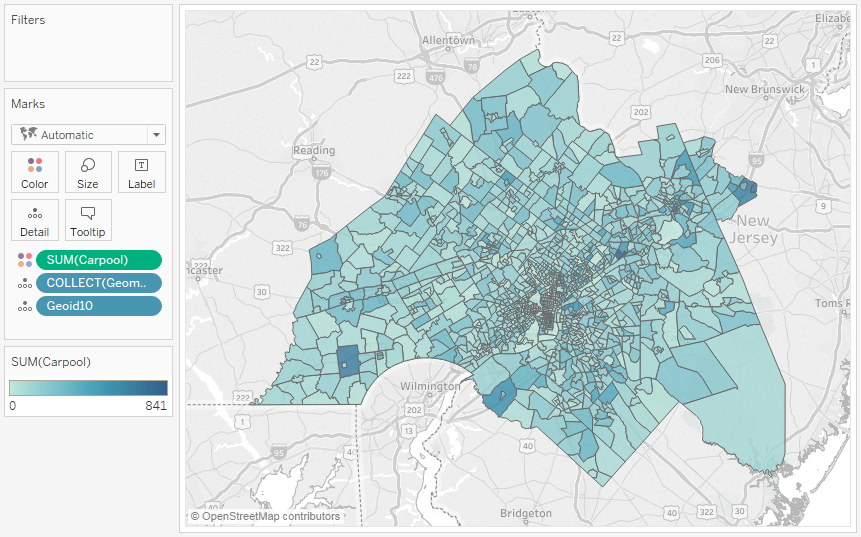
The shapefile I’ve connected to in the example above is from the City of Philadelphia. The file includes demographic profile attributes by census tract. From this file, I picked the attribute I was interested in and simply dragged and dropped. Here is a viz of how many people carpool to work within the city.
Of course not all spatial files will include the attributes you are interested in. Especially for those of you looking to map private data, you will need to combine your data with a spatial file. This too is quite simple by leveraging existing cross-data source join capabilities of Tableau.
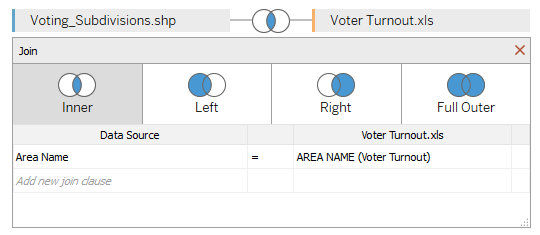
Here is an example of mapping electoral data from the City of Toronto. After connecting to the electoral subdivisions shapefile, I added a connection to a spreadsheet of voting results. Tableau will automatically set up the join for you in many cases. In my case, the join looks like this:
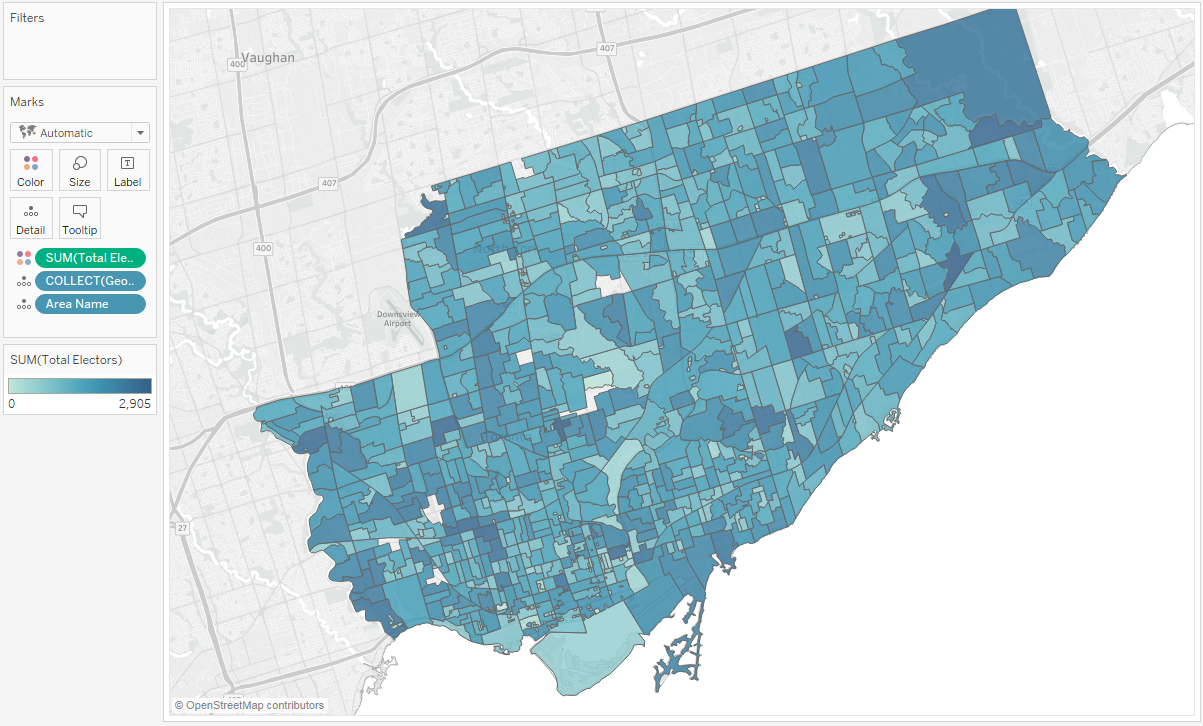
Now you can jump to the worksheet and build your viz. I dropped Geometry, Area_Name, and Eligible Voters onto the canvas to create this map:
It really is that easy.
Integrate your data
Now let’s say you want to crank it up a bit. That’s right, let’s make things a dash more exciting. To do that, let’s explore a custom geographic hierarchy with data from multiple sources. For this example, we're exploring average monthly income in São Paulo, Brazil. The data comes from Instituto Brasileiro de Geografia e Estatística (IBGE).
First we'll start with a table of data that includes demographic variables and codes that link to administrative geographic regions. In this example, we'll work with two geographies: Census Sectors and Districts. Next we’ll add connections to these geographic data sets, joining both to the original table. The join will end up looking like this:
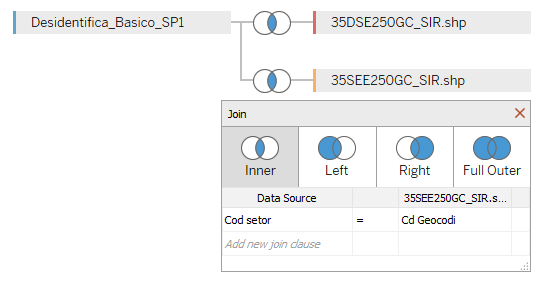
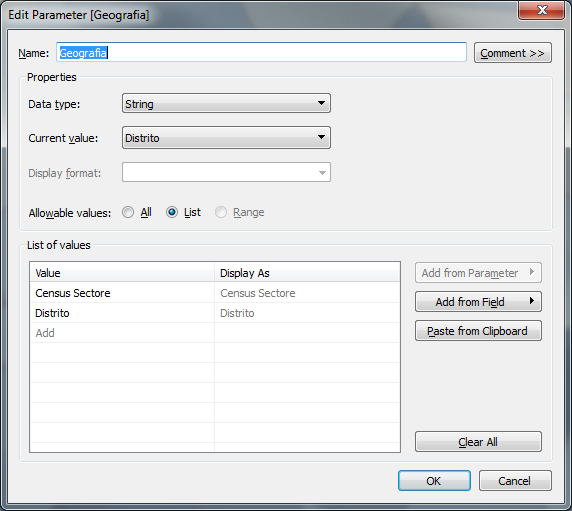
In your worksheet, you will need to setup a parameter and multiple calculated fields. The parameter will be the control for interacting with the viz, and the calculated fields will have logic to swap both the Geometry and Detail of the viz. I configured the parameter like this:
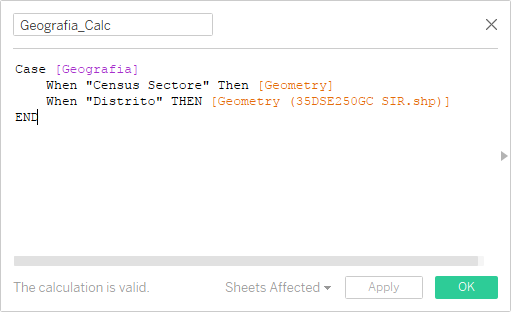
Now both calculated fields use the same pattern for choosing the correct field based on the parameter value. I used this expression to choose which Geometry to use:
Add custom geographic hierarchies
All that is left to do is turn on the parameter control, drag and drop the calculated fields and the average income on to the viz. Now you can interrogate the data in Sao Paulo by District or by the more granular Census Sector.
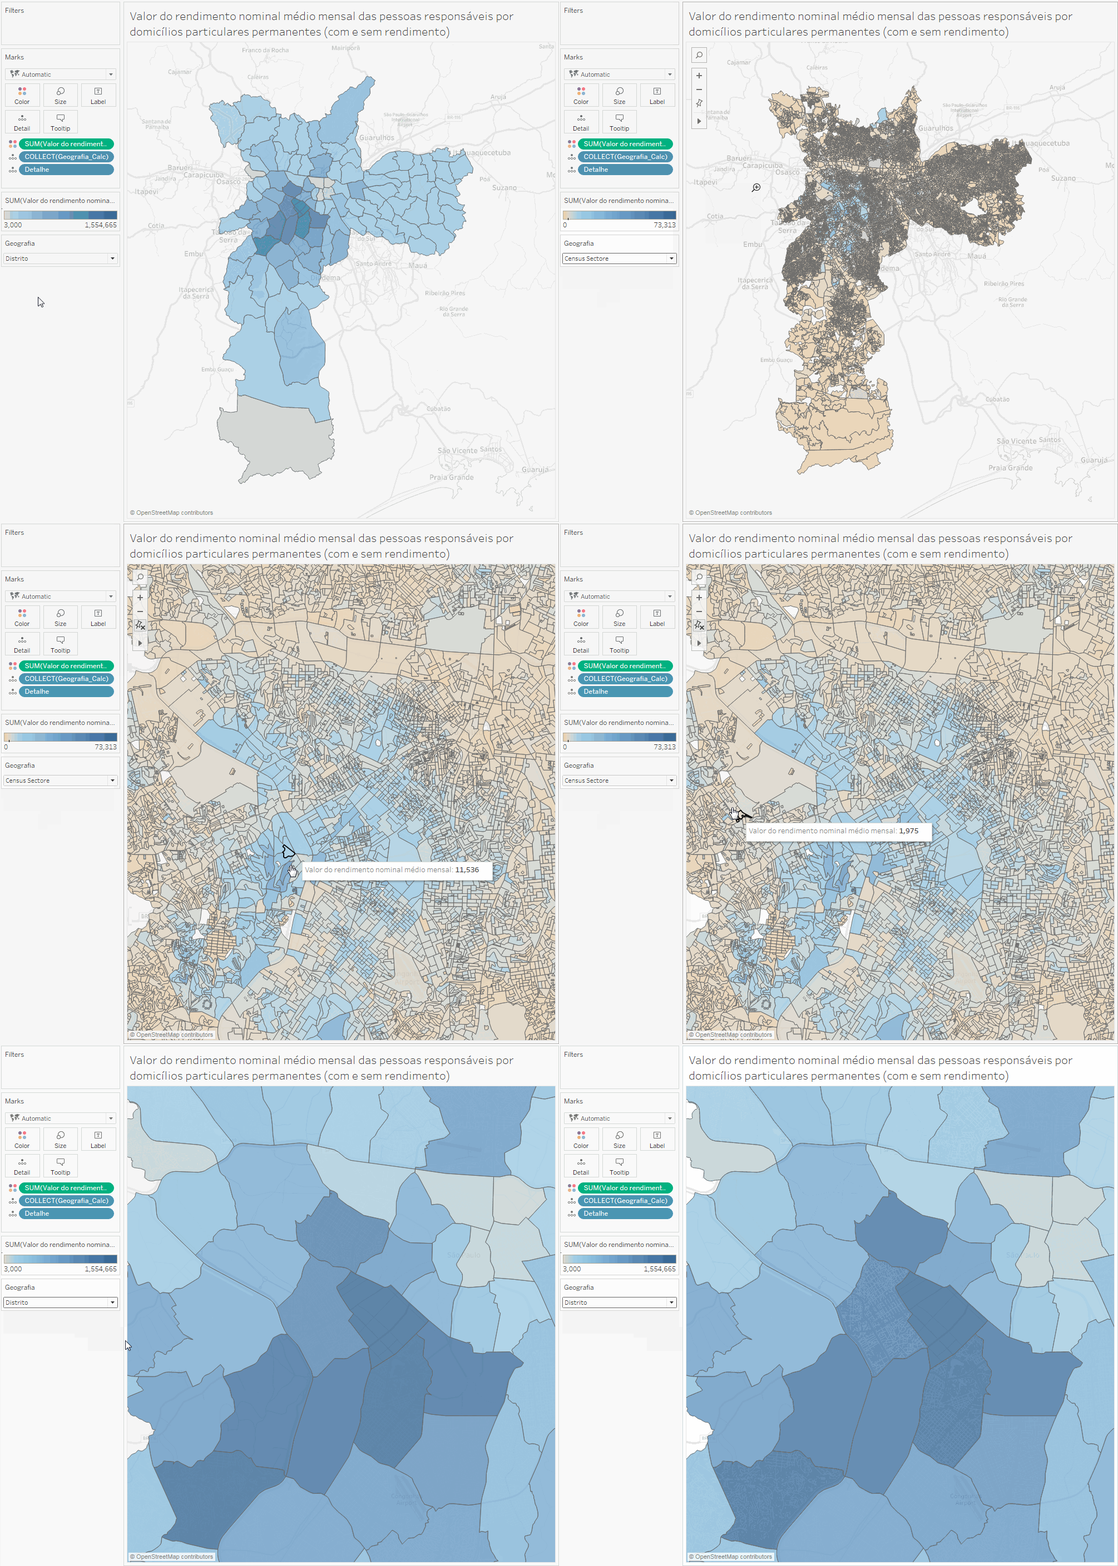
Did you notice how I did not spend time discussing coordinate systems or vertex counts per polygon? That’s because we’ve designed this feature to automatically handle the complexity of working with data from different projections and to perform against large and detailed polygonal data sets.
With the spatial file connector, pre-processing data to use custom polygons becomes a thing of the past. Now you can connect to spatial data like you can a text file, leverage all of awesome capabilities in Tableau (cross data-source joins, parameters, and more), and build beautiful maps with ease.
For those of you who are already familiar with working with spatial data, be assured that this feature is just the beginning. We know there are some limitations, like the first version of spatial file support will not support linear geometries or KML files with multiple layers. This is a great opportunity for you to let us know what is most important for your work and how you want to use spatial data. I encourage you to vote up your requests on the Ideas Forum.
Try Tableau 10.2
Tableau 10.2 is currently in beta. Try these and many other new features by signing up for Tableau’s beta program. And visit our Coming Soon page to learn about all the features we're planning for Tableau 10.2.
相關文章
Subscribe to our blog
在收件匣中收到最新的 Tableau 消息。


