At Tableau, we firmly believe the value of analytics is inversely proportional to how long it takes to answer the question. The more questions we can ask, the better the answer tends to be.
In version 9, we’ve introduced several features to enhance Tableau’s analytic capabilities. To achieve our vision of analytics at the speed of thought we wanted to make calculations easier to author, more discoverable, and more powerful. To do this we greatly enhanced the power of our UI and introduced a brand new element to our calculation language. The features I'll cover in this post include:
- Ad-hoc analytics – Want to enter simple calcs quickly? No problem, with type-in pills you can enter expressions directly in the shelves.
- Drag and drop analytics – Tired of searching menus for analytics features? Try our new analytics pane where you can easily add analytics, such as a reference line, to a viz by just dragging it onto the canvas. You may also discover something you didn't know existed.
- Instant analytics – Curious how a filter to a specific group would change your analytic object? Select marks and instantly compare the subset to population.
- New calculation editor – Ever wish you could modify calculations and watch the viz update in real time? Guess what, the revamped calculation editor no longer blocks access to the viz, allowing quick testing of scenarios and drag and drop calculation authoring.
- LOD expressions – This feature is so revoluationary that it will get its own blog series, but for now suffice it to say we are releasing a new calculation capability that opens an entirely new class of questions up to the analyst.
Version 9 is not only easier and faster to accomplish the same tasks, but the addition of LOD expression opens up an entirely new set of questions and analyses. The additions tend to feel natural and require little to no training, but make us never want to go back to the old way.
Now, let’s check out how these features enhance an analysis of the housing market using Zillow Data.
Ad-hoc Analytics
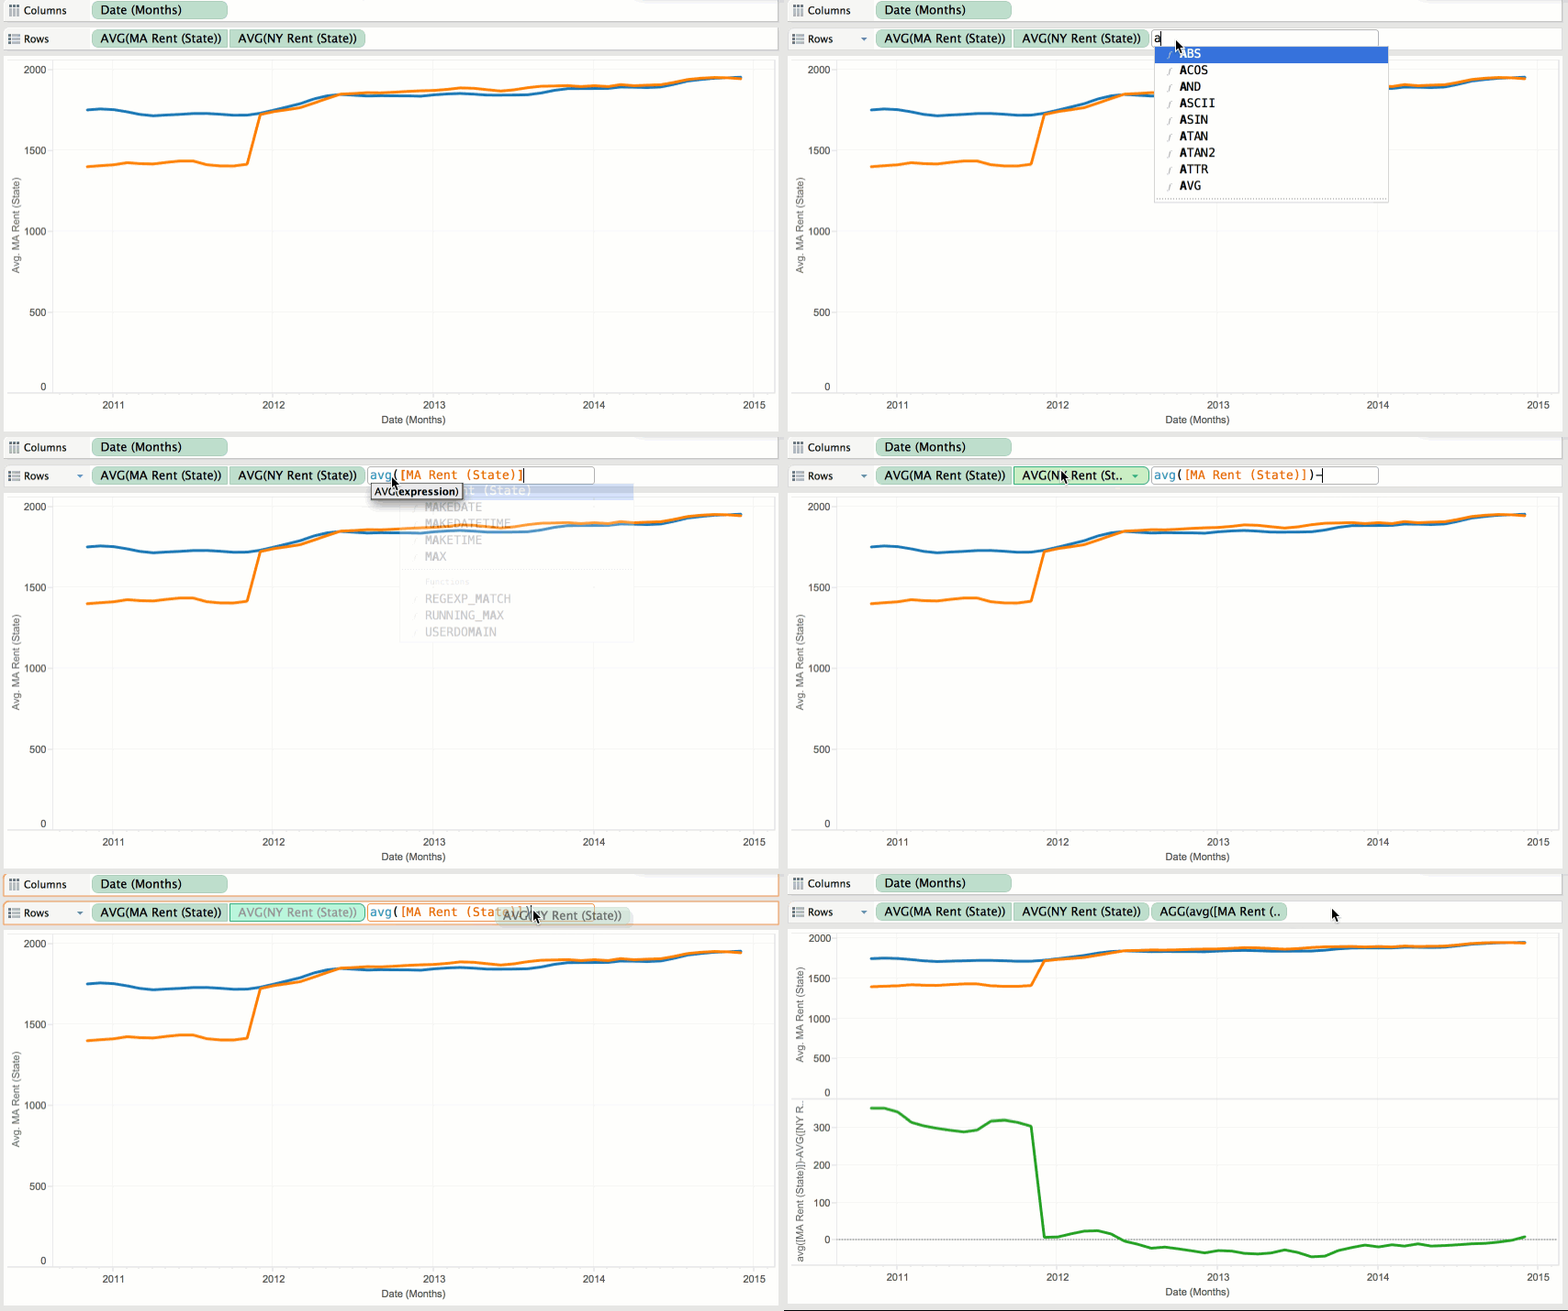
With ad-hoc analytics you can create or edit calculation directly in the pill. As you can see here, we quickly compute the difference between Massachusetts and New York rent by just dragging and dropping into a type-in pill. Note that you can type or drag and drop! Authoring calculations is also now easier than ever before with autocomplete.

In the image above, you can see that we create a new calculation direction in the shelf by utilizing type-in pills. We drag in two other existing calculations and take the difference.
Drag and Drop Analytics
Tired of hunting around for your favorite analytic objects? So were we! To solve this problem, we decided to make it even easier by adding a whole analytics tab to make it crazy simple add deep analytics to your viz.

At the beginning of the animation, we select the new analytics pane and drag out the trend line object. We're then able to remove them by simply dragging off the canvas.
Instant Analytics
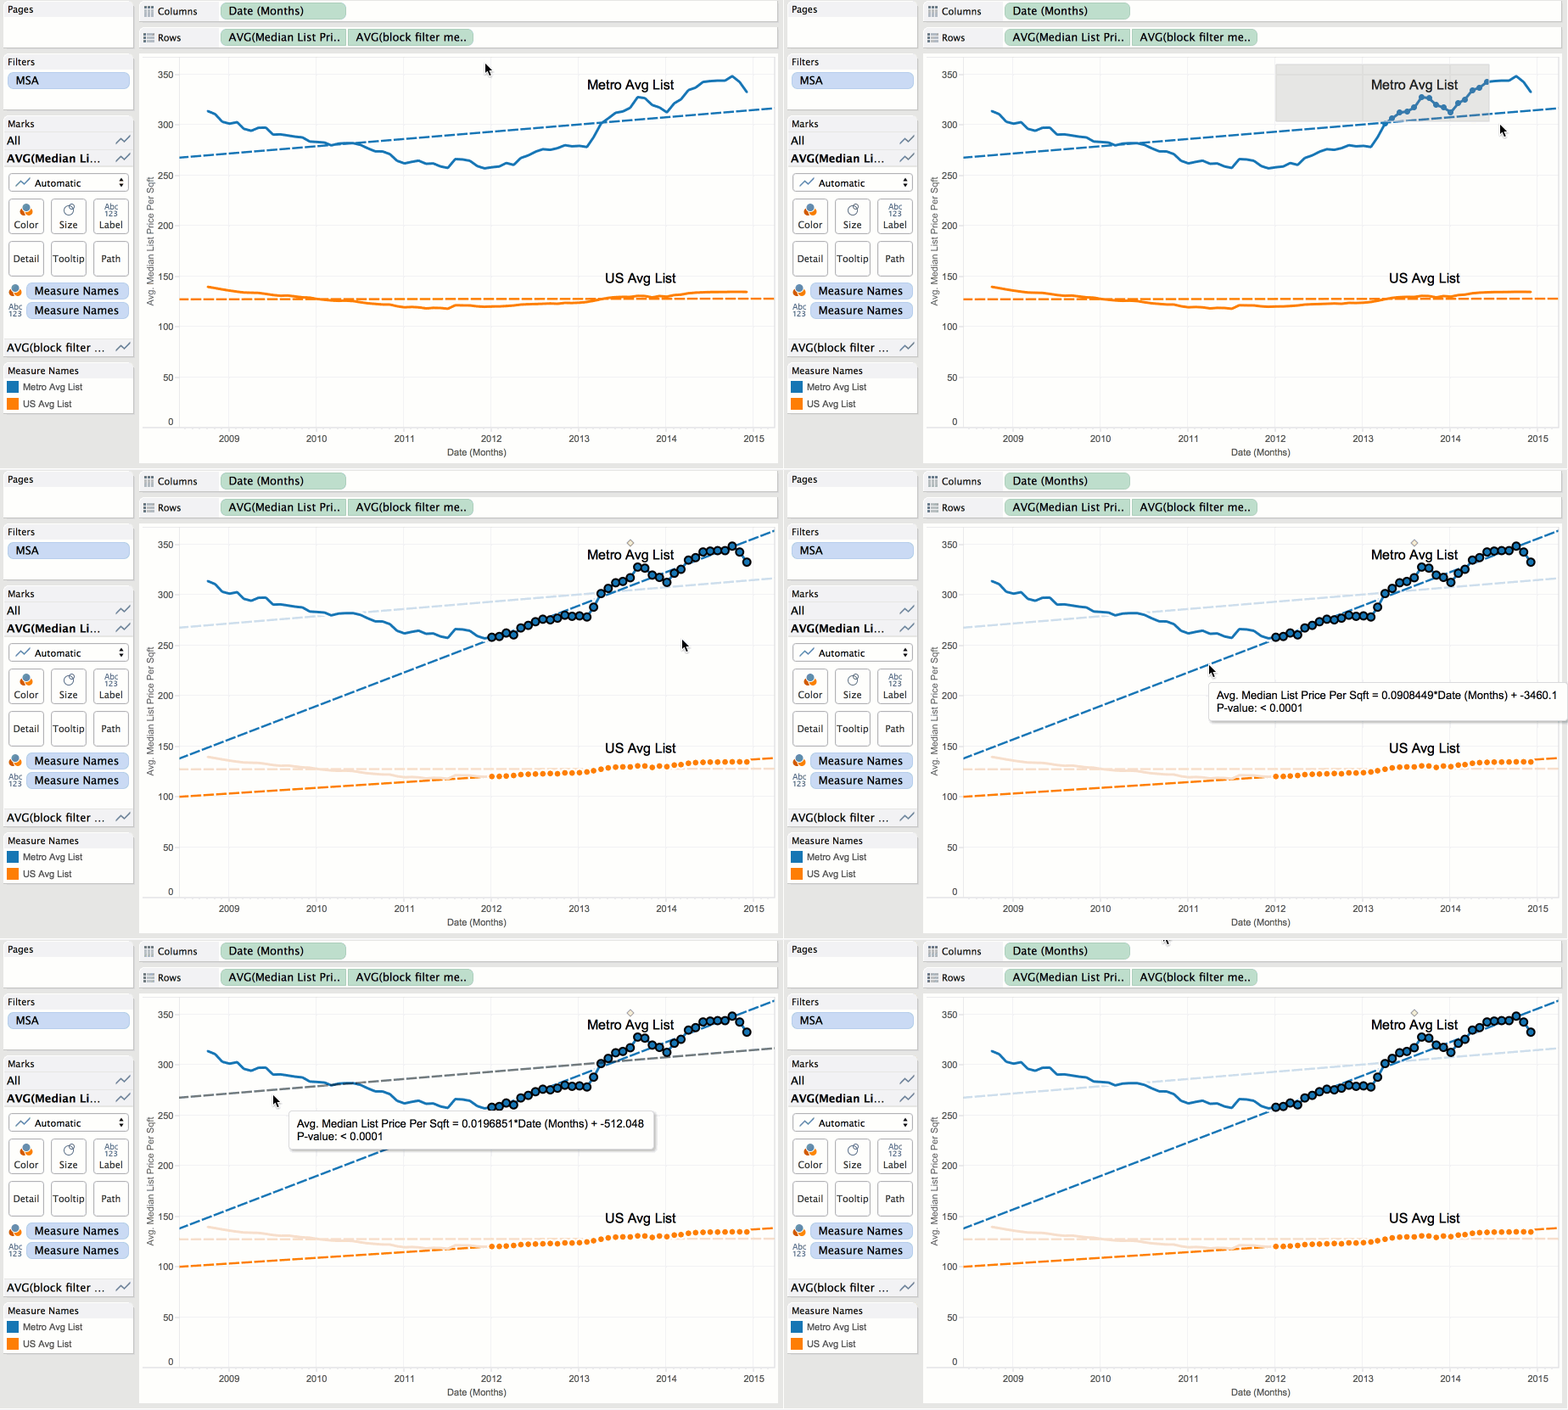
Imagine you get this report showing the trends of rents and housing prices in Seattle/NYC/SF vs the rest of the US, but you want to see what the trend would be if you only included the last half of the data. With a simple drag you can see what happens to the trend line (it gets a lot steeper in the major metro areas). This works for reference lines, totals, and other analytics objects too!

In this image, you can see our new instant analytics capability. When you select marks, the analytics object respond to the selection and show you how the selected group compares to the original population.
New Calculation Editor
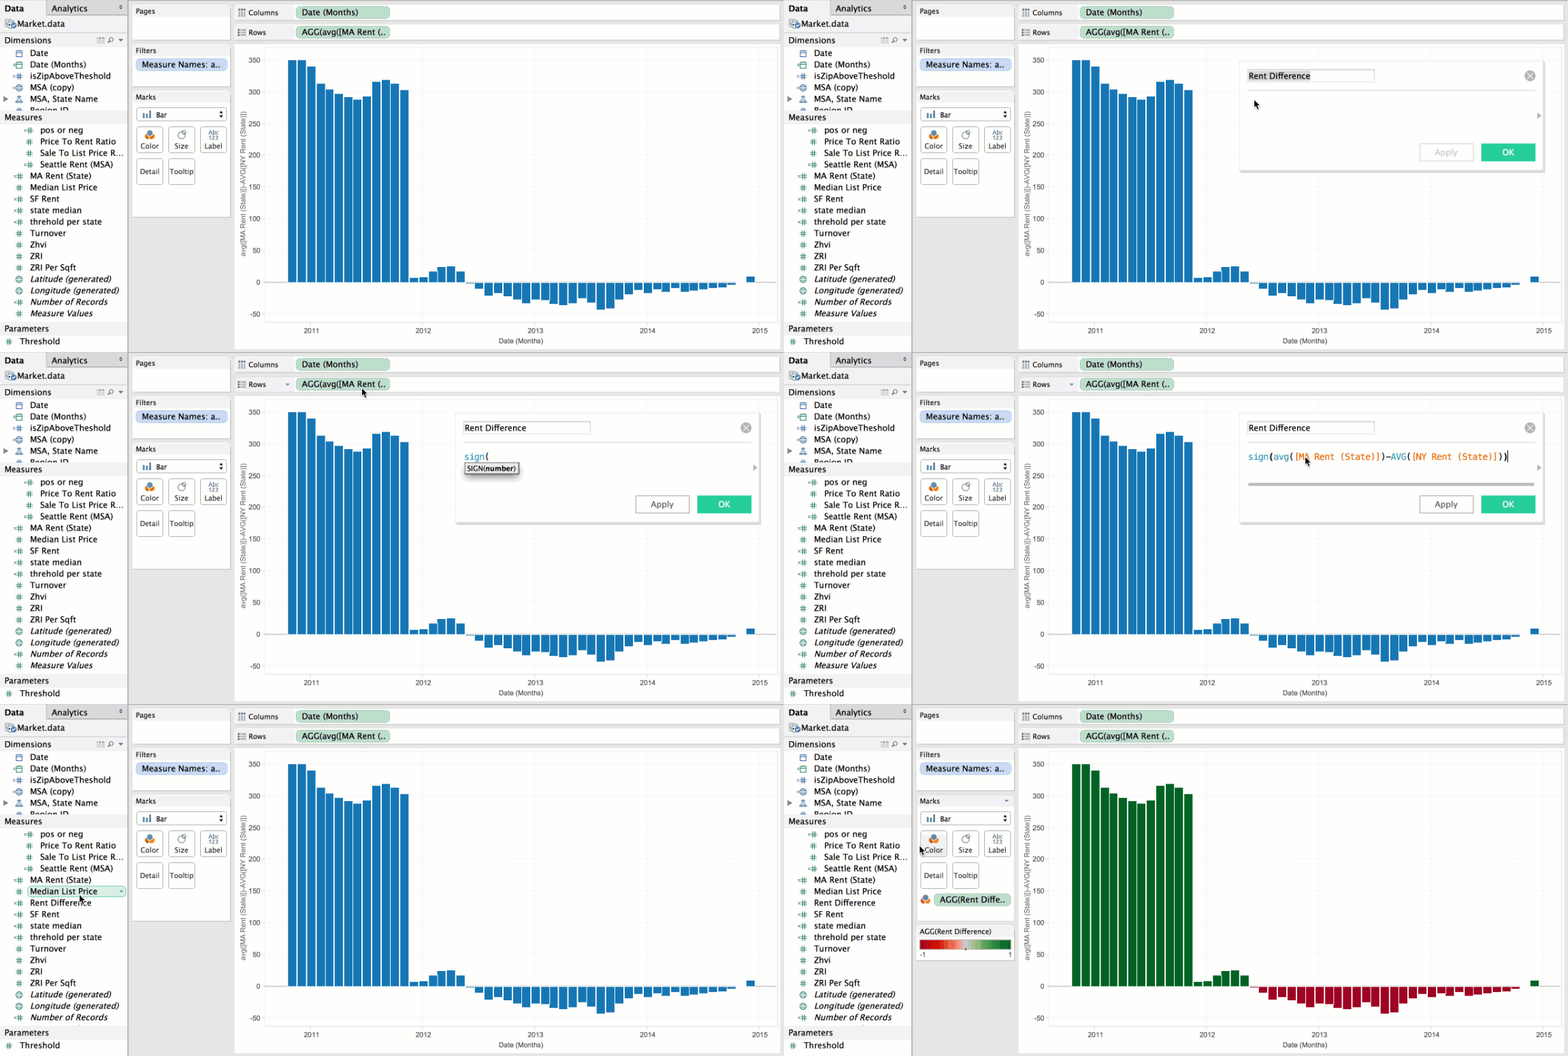
Now I want to format the negative and positive values. I can do this very quickly thanks to new advances in the calculation dialog. You'll notice that it is "non-modal," which is a fancy way of saying it is integrated into the rest of Tableau – It doesn't interfere with your flow at all. You can drag fields or even expressions in and craft your calculation faster than ever. You can even make changes to your calculation and see the effects on your viz without exiting the editor by hitting apply.

Level of Detail Expressions (LOD expressions)
These unleash such a large set of new scenarios that we are going to be covering them with an entire series. Briefly, LOD expressions allow Tableau to easily compute at multiple levels of aggregation in the same viz. This makes computations like cohort analysis and aggregates of aggregates dead simple.
In the example below, you can see where the top 10 percent of richest people per state live. Using LOD expressions, we can find the top 10 percent threshold per state and then filter down to the zip codes in each that are above that threshold. The parameter allows you to adjust what percentile you want to see.
Want to learn more?
Check out our learning center, as well as the rest of our Tableau 9.0 blog series.
Subscribe to our blog
在收件匣中收到最新的 Tableau 消息。


