Tableau 2021.1
Einstein Discovery in Tableau, quick LODs, and a new unified notification experience
Einstein Discovery in Tableau
Einstein Discovery in Tableau brings trusted, intuitive predictions and recommendations from Einstein Discovery to every Tableau user across your organization. Get smarter, guided decisions for every team with cutting-edge, augmented analytics in a no-code required, rapid iteration environment.
รับชมตอนนี้Einstein Discovery integrated into Tableau brings predictive capabilities to the existing inventory of dashboards companies already have, and when that’s combined with auto-generated machine learning models, businesses can explore patterns, trends and correlations in their historical data without ever writing a single line of code.
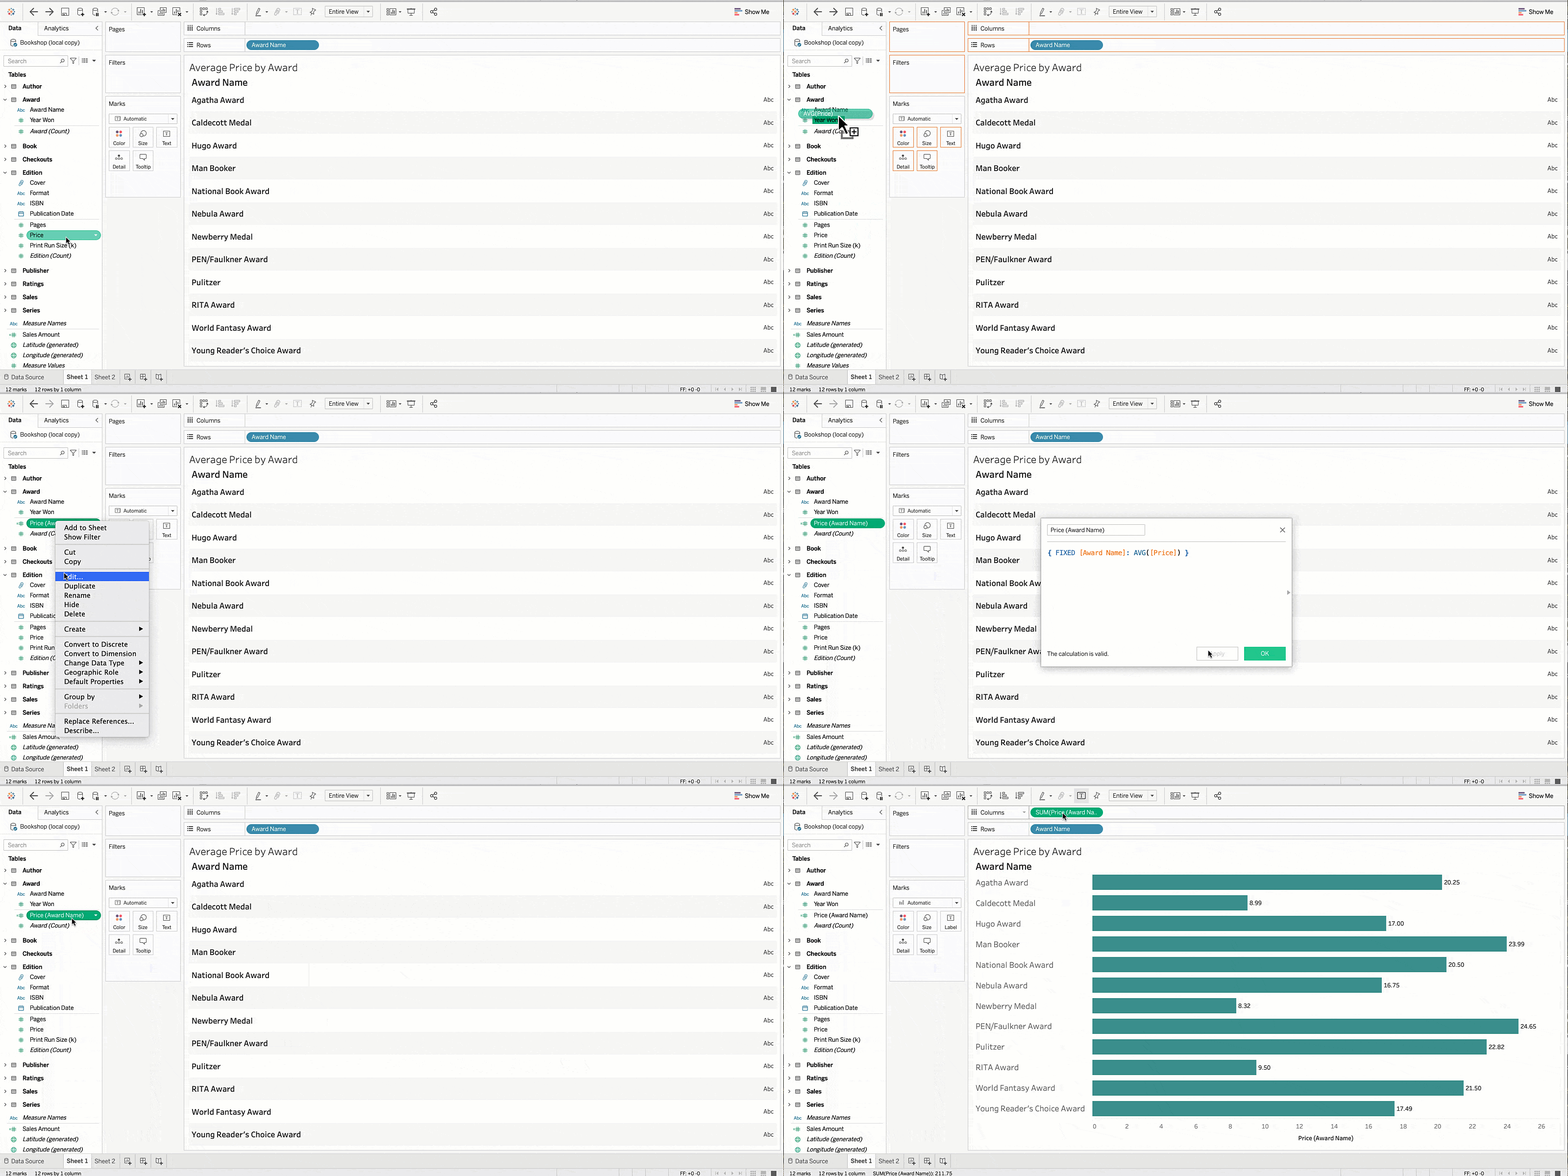
Quick LODs
Create Level of Detail expressions more easily. Use context menus or drag-and-drop a measure onto a dimension to automatically create a Level of Detail expression with the default aggregation.

Unified notification experience
Manage all of your notifications in the newly redesigned notification center within Tableau Server and Online. This dedicated space shows your shares, comments, extracts, and prep flows all in one place, consolidating all of the important changes across your organization. You can also control where you receive these notifications via preferences—directly in Tableau, email notifications, or both—helping you to never miss an important alert to take action.
Tableau 2021.1 Feature Overview
Tune in for an overview of all the new features included in this release.
Watch nowAll Features
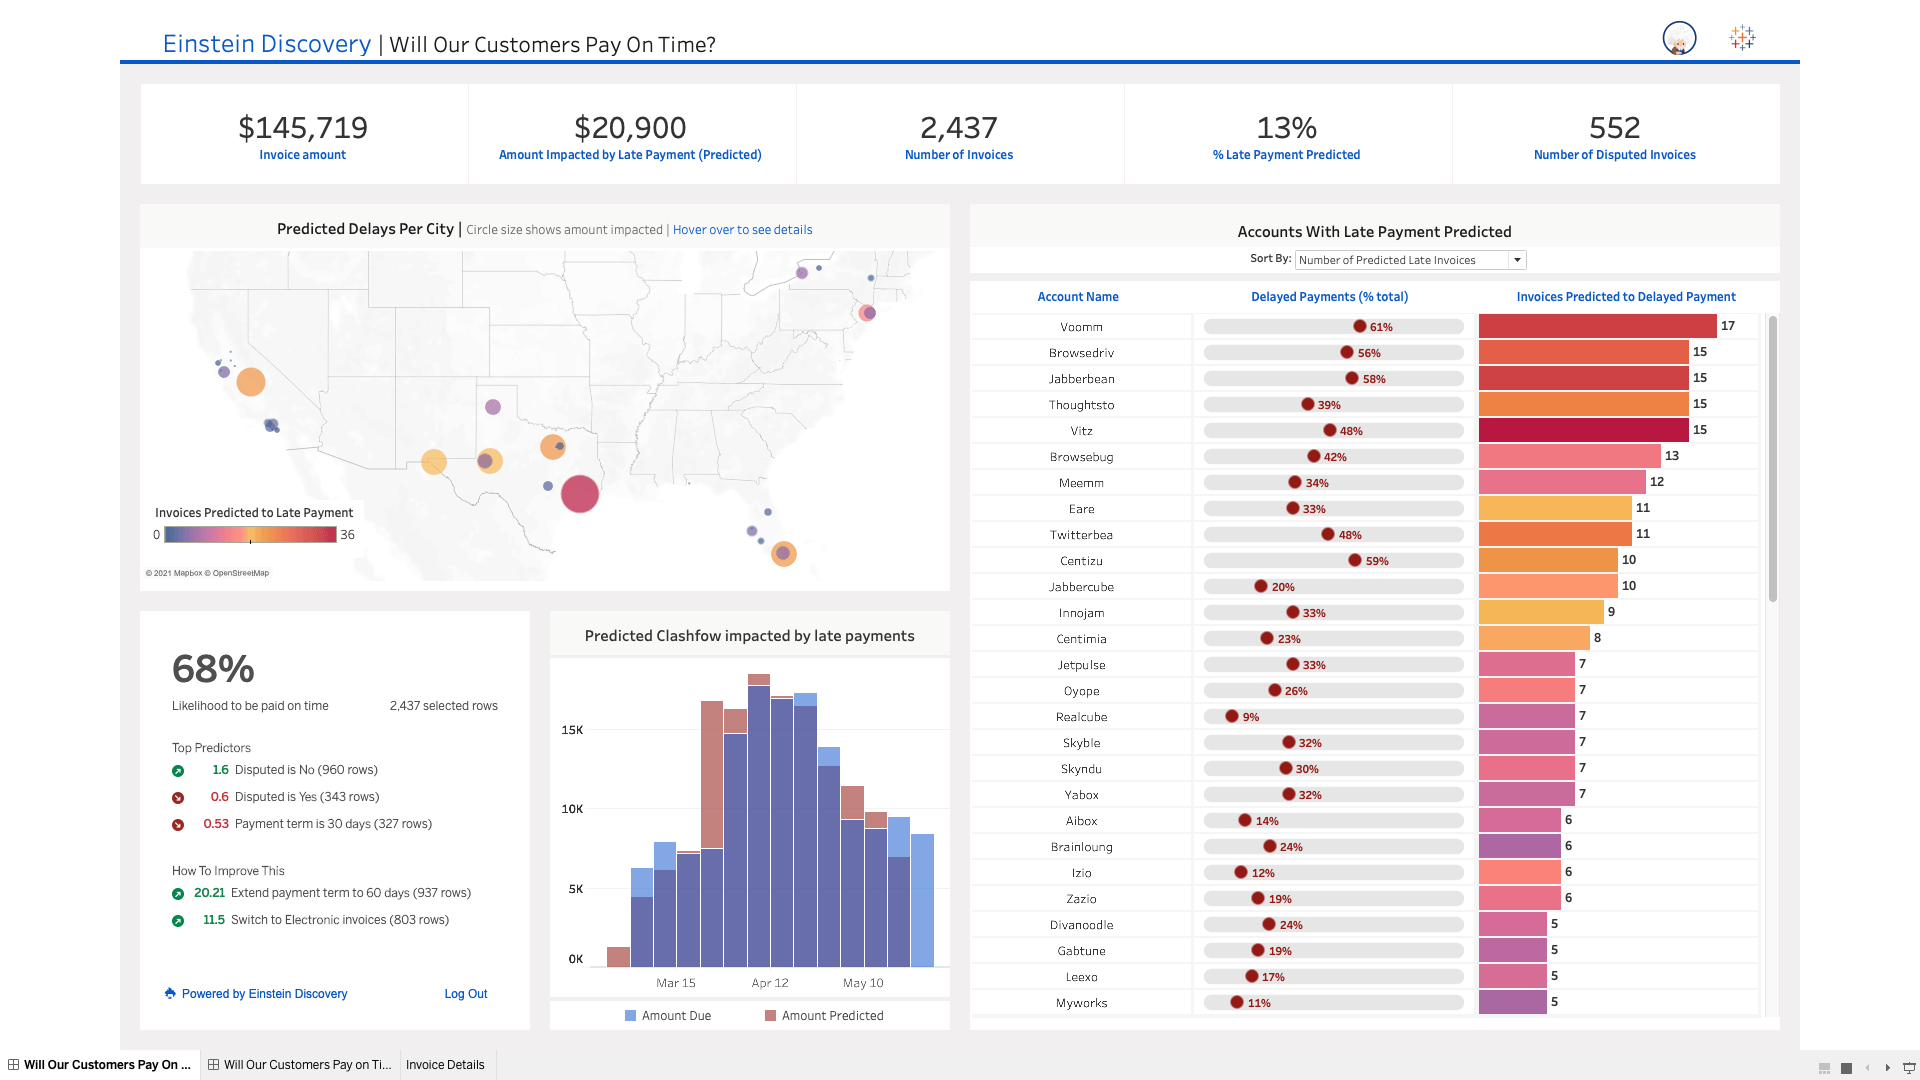
Einstein Discovery in Tableau
Einstein Discovery in Tableau brings trusted, intuitive predictions and recommendations from Einstein Discovery to every Tableau user across your organization. Get smarter, guided decisions for every team with cutting-edge, augmented analytics in a no-code required, rapid iteration environment.
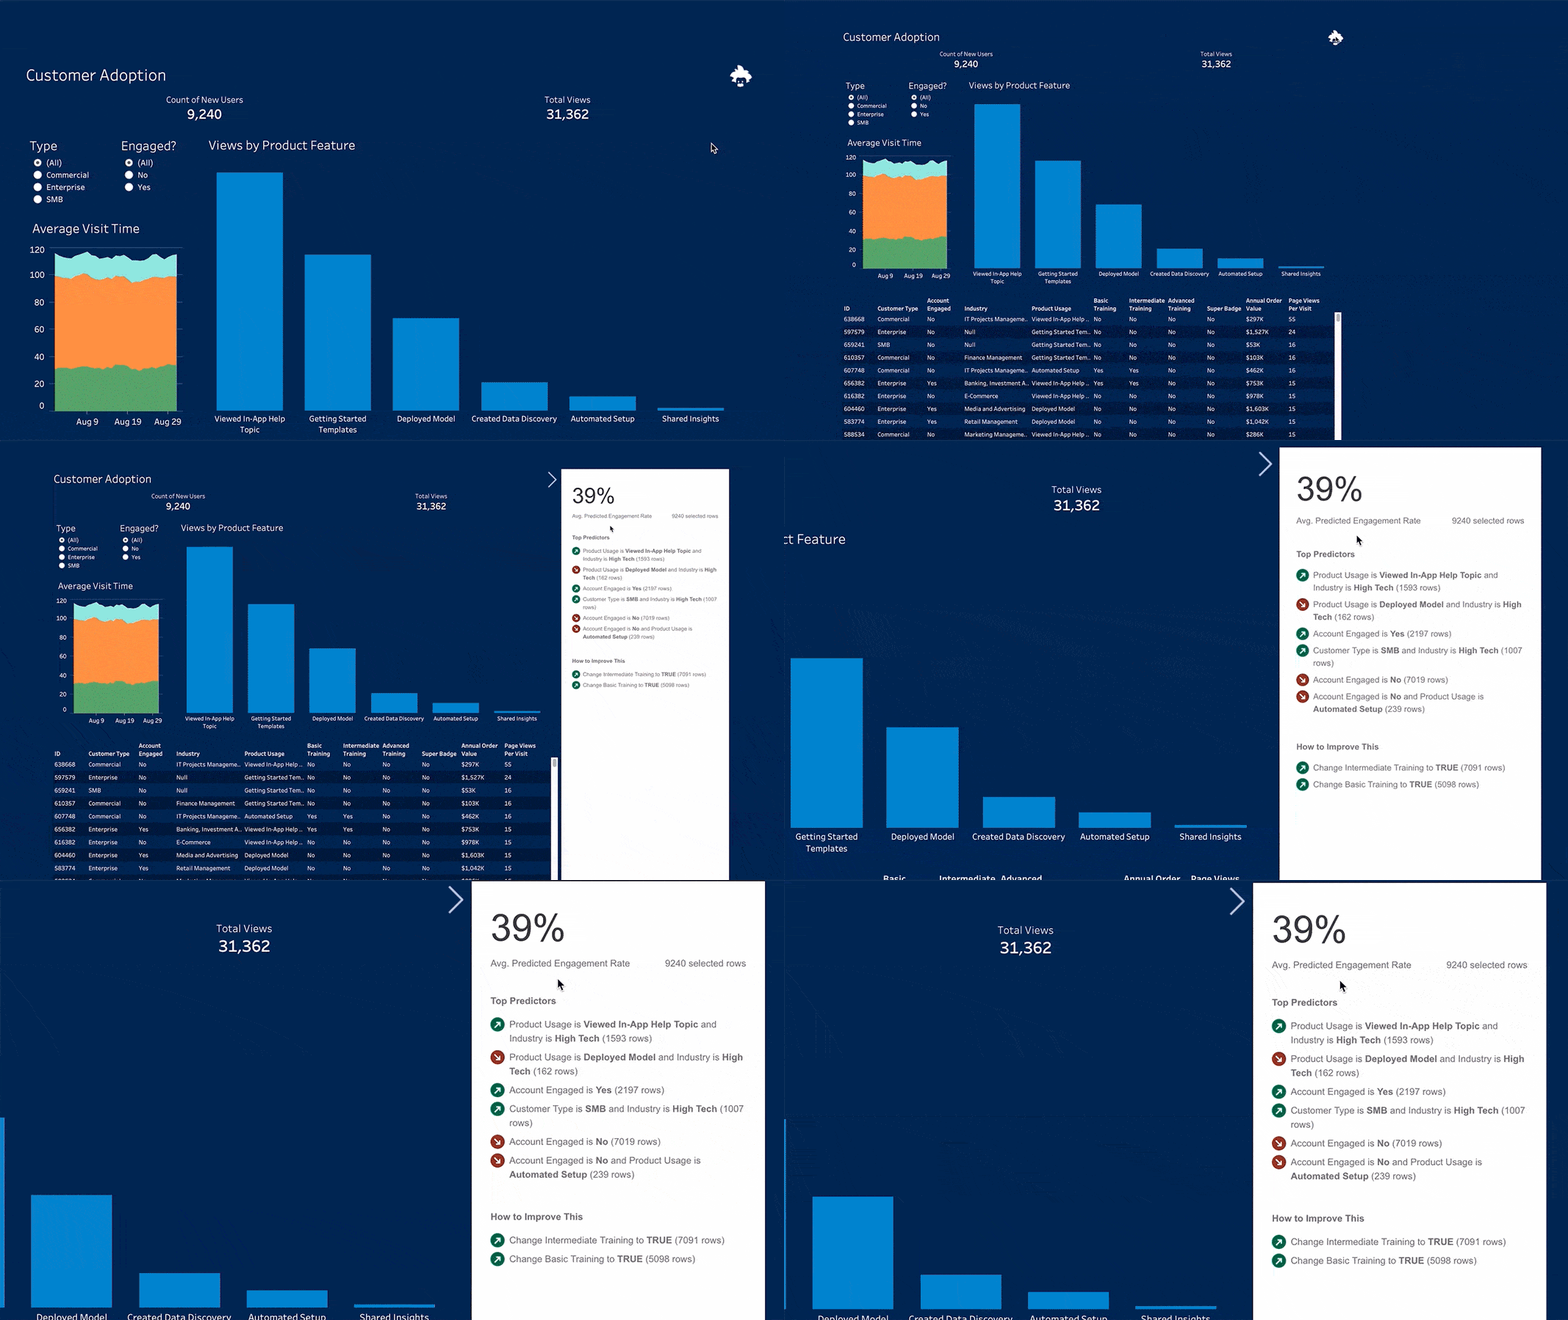
Einstein Discovery dashboard extension
Enjoy on-demand, interpretable ML predictions from Einstein Discovery natively integrated in Tableau dashboards. Users can click on one or more rows of data from a Tableau visualization to get dynamic predictions, see key drivers of predictions, and learn ways to improve predictions based on the model.
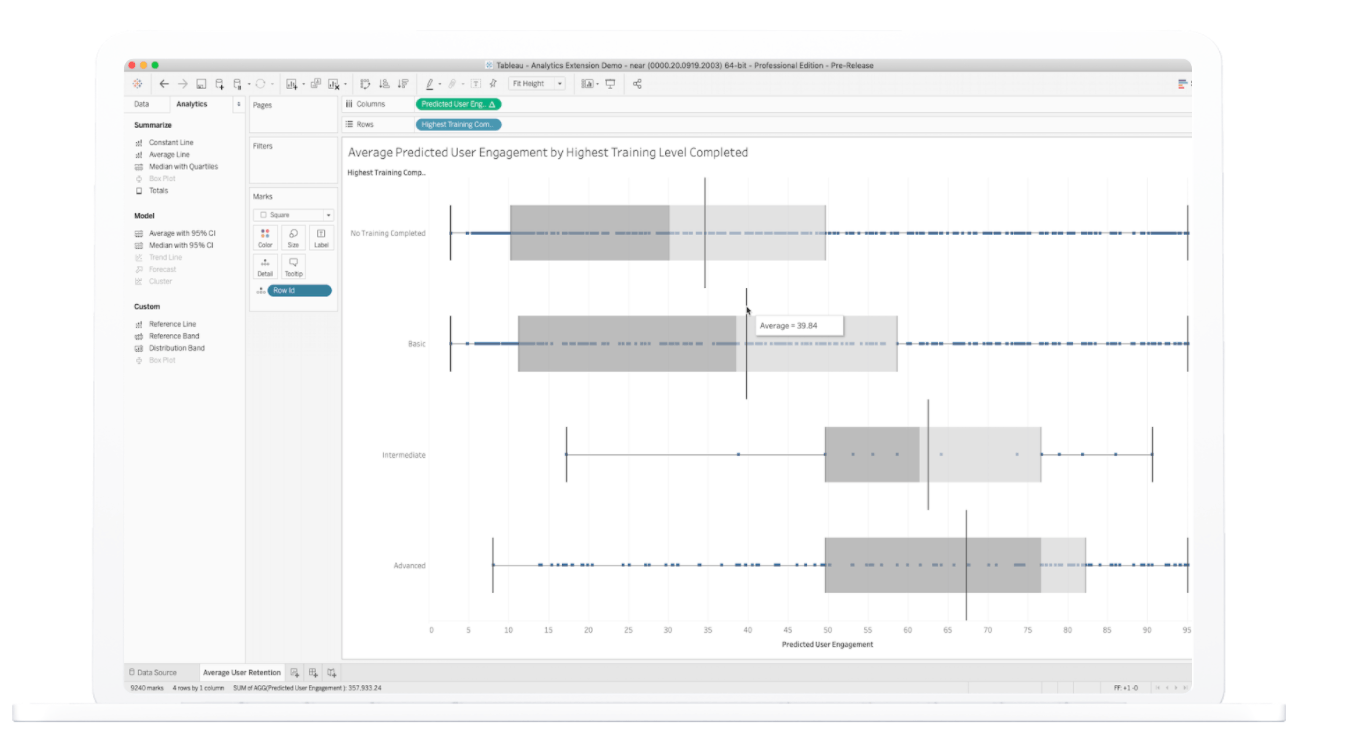
Einstein in Tableau Calcs
Feed Tableau analytics with dynamic predictive intelligence and connect Einstein predictions directly into Tableau calculated fields. Construct, share, and scale interactive visualizations and dashboards incorporating dynamic predictions using existing Tableau infrastructure, and test new scenarios using Tableau parameters. Note: Available in Tableau Desktop and Tableau Server.
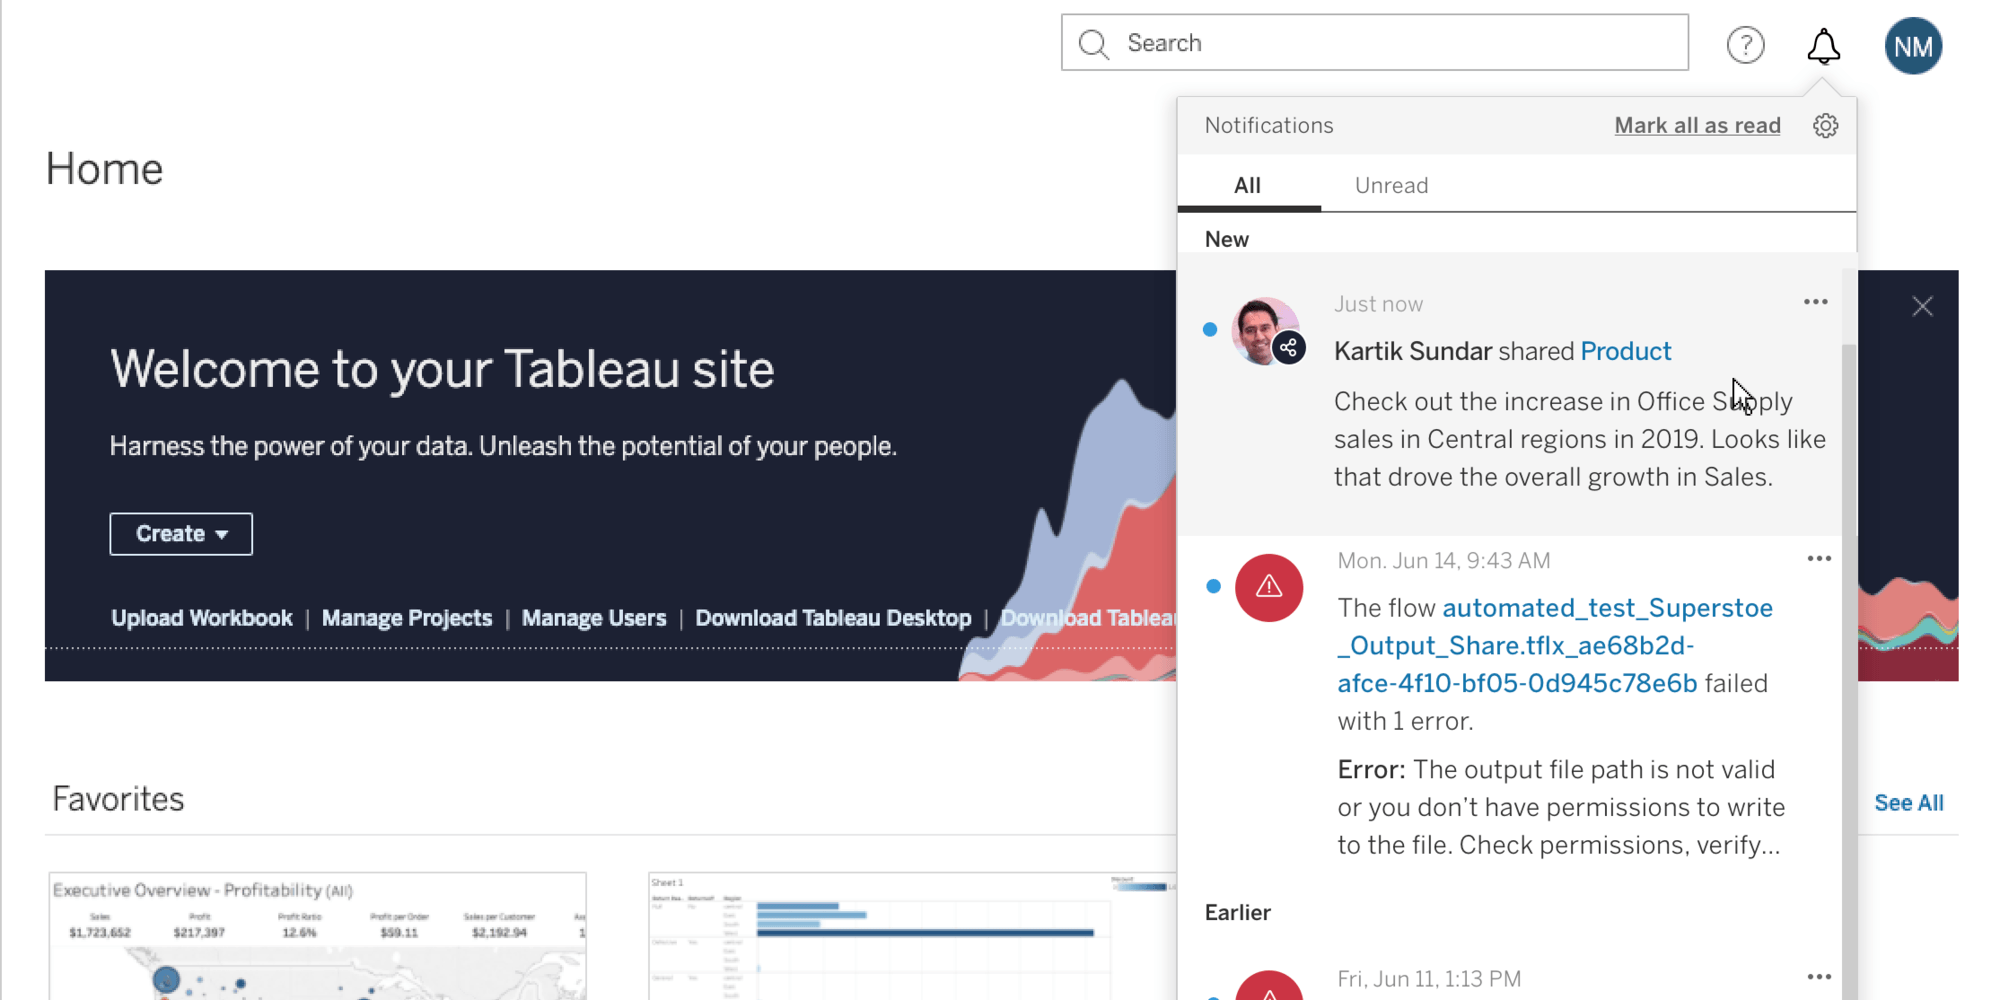
Unified notification experience
Manage all of your notifications in the newly redesigned notification center within Tableau Server and Online. This dedicated space shows your shares, comments, extracts, and prep flows all in one place, consolidating all of the important changes across your organization. You can also control where you receive these notifications via preferences—directly in Tableau, email notifications, or both—helping you to never miss an important alert to take action.
Microsoft Azure connectivity improvements
You can now connect to your data in Azure SQL Database (with Azure Active Directory) and Azure Data Lake Gen 2. In addition, we now have support for Azure Active Directory in two of our existing connectors in Azure Synapse and Azure Databricks. For guidance and best practices around optimizing Tableau and Azure together for analytics, read our updated Tableau Server on Microsoft Azure Whitepaper.
Read our Whitepaper
In-product Extension Gallery
With the in-product Tableau Exchange, all your connectors and extensions are a simple click away. Easily discover connectors and extensions with an enhanced browsing experience, search and filter options, and complete the installations all without leaving your Tableau workflow.

Customer 360 Audiences Connector with Tableau
Natively connect Tableau to Customer 360 Audiences to discover insights from your detailed customer data. From customer engagement to behavioral and transaction data housed in Customer 360 Audiences, you’ll be able to create custom visualizations in Tableau Desktop and Server. Drill down to campaign, channel, and multiple customer dimensions to understand the “who” and “why” behind all your cross-channel engagement results.
Ask Data improvements
The new Ask Data help center centralizes all onboarding and administrative information for Ask Data users. For admins and data source owners, you can find best practices and usage statistics to see what questions your end users are asking. For business users, find helpful training information to learn what kinds of questions you can ask and other helpful tips. Anyone can also submit feedback and suggestions directly to the product team.

Web authoring on Tableau Public (beta)
Create new visualizations on Tableau Public right from a browser. With web authoring in beta on Tableau Public, you can connect to data in Excel and text-based files including CSV, JSON, PDF, Spatial files, Statistical files, Tableau Data Extracts, and Hyper Extracts.
Header and axes improvements
Take advantage of new improvements to display headers and axes in Tableau Desktop, Server, and Online. Notice a better experience in how you draw borders, lines, and tick marks. You can also now reorder headers below a viz, overlapping labels will be skipped on the left, and scrolling will feel smoother. And as a part of this refresh, header and axis objects are now native HTML elements in the browser, so users can search for text with built-in browser search capabilities.
JDBC for SAP HANA connections on Windows
Connecting to SAP HANA databases from Tableau products on Windows platforms will now use a JDBC driver by default instead of an ODBC driver, which makes the connector consistent across Mac, Linux, and Windows systems. Connections from Tableau to SAP HANA on Mac and Linux platforms already use JDBC.

Write to Excel in Tableau Prep
Tableau Prep expands its output capabilities to include ability to write to MS Excel. In addition to writing your data to CSV and Hyper files, you will be able to create new excel files, or add/replace data in existing ones. With the Tableau Prep visual and direct interface, you can easily see what tables are available in your Excel file and determine how your flow fields map to existing fields in the Excel tables.

Automated data quality warnings
Data quality warnings (DQW) will be automatically created based upon extract refresh and Tableau Prep flow run failures so that data freshness (or lack thereof) is communicated without any manual effort. These can be combined with existing DQWs set manually or via API to add another layer of data quality information to your environment.

Tableau Catalog search improvements
Search for a table or a database, and see the most relevant results returned. Matches by name are now ranked higher than matches by columns. To ensure you are finding the most trustworthy content, certified tables and databases will be ranked at the top, and assets with a data quality warning will be ranked lower.
Licensing improvements
New product activation method
Opt-in to Server Authorization to Run (ATR) product activation of Tableau Server deployed in cloud or virtual environments, which abstracts licensing from underlying hardware changes.
Zero downtime licensing
Admins can now apply term and capacity licensing changes to Tableau Server without requiring restarts that disrupt business activities. Additionally, upon subscription renewal, Tableau Desktop and Tableau Prep Builder licenses will automatically be refreshed when they are nearing expiration.
Advanced Management for Tableau Server Improvements
Support for Azure Key Vault for Tableau Server
As part of Advanced Management for Tableau Server, integrate with Azure Key Vault for Tableau Server data extract encryption at rest to centralize key management and unlock more advanced security and compliance scenarios.
Resource Monitoring Tool (RMT) search and filter
Search and filter Tableau Resource Monitoring Tool data to quickly find specific content, events, and sessions generated by Tableau Server.
Learn More About Tableau Releases


