Tableau 2025.1
Tableau Agent Multilingual Support, Tableau Cloud Release Preview Sites, Private Connect for Tableau Cloud, and more

Tableau Agent Multilingual Support
Analyze your data in multiple languages. Users can now communicate with Tableau Agent (and Tableau Pulse!) in conversational French, Italian, German, Spanish, Japanese, and Portuguese. Now, more users have the ability to access conversational analytics in their native language.

Private Connect for Tableau Cloud
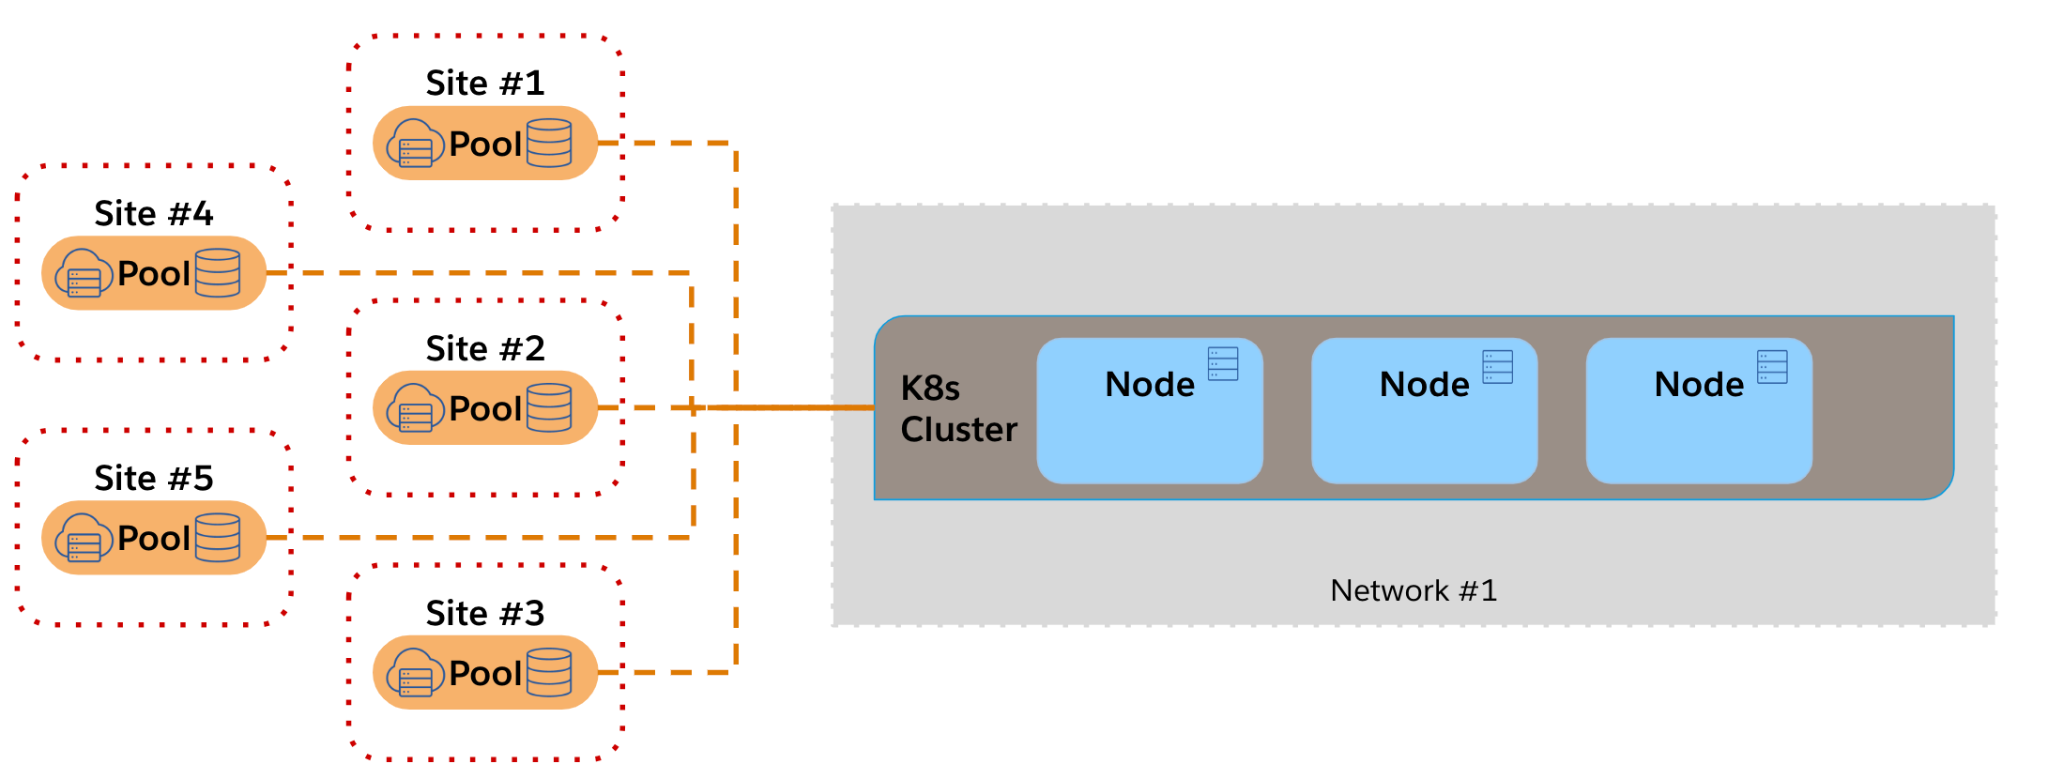
Enhance security by keeping your connection to data private and away from the public internet. Securely connect AWS data to Tableau Cloud with a dedicated and private connection. Private Connect establishes a trusted link between AWS data and Tableau Cloud without exposing your data to the public internet.

Revamped Tableau Pulse Homepage on Mobile
Easily access and compare key metrics on the go. With one glance you can see at least three metrics to instantly identify trends for quicker, easier decision-making.
Learn more about Tableau Pulse feature releases.

VizQL Data Service API
Harness the potential of Tableau published data sources to drive custom solutions. Integrate these robust assets into new or existing systems, creating innovative applications and experiences customized to meet your users' unique needs.

Tableau Cloud Release Preview Sites
Tableau Admins can stay ahead with early access to new releases*. Test out releases in advance for a hands-on understanding of functional changes. See how the updates impact your business' unique content so you're prepared to utilize new features effectively.
*Available soon and as part of Tableau+ edition of Tableau Cloud.

Get the Inside Track on Tableau Releases
Learn from Tableau Product Managers about the new features we're releasing on our DataFam Discovery User Group.
Join Now
All Features

Custom Themes
Ensure consistent and repeatable formatting across all your workbooks. Create a theme once and reuse it when building new workbooks or apply it to existing workbooks to quickly update them; the newly created custom theme will carry over once published to Tableau Cloud and Tableau Server. You can use any existing workbook as the template and 'export' the styling as a theme. Then, apply that custom theme to any other workbook. This new functionality is available under the Format menu in Tableau Desktop.

VizQL Data Service API
The VizQL Data Service API enables Tableau users to access their data without the need for visualizations. It empowers users to use Tableau's analytical engine as a service, unlocking new analytical possibilities and insights using the same data that powers Tableau visualizations.

Recycle Bin
Have you ever accidentally deleted something and wanted to get it back? We all have. Tableau Server and Cloud customers can access deleted workbooks, data sources, or projects through the Recycle Bin area for 30 days - it is enabled by default. All users will see their deleted content, and site admins can see all deleted content from all users on the site. You can restore the content in the bin to a specified location in Tableau Cloud and Server.
Feature from Community Ideas
Note: This feature will be deployed to Tableau Cloud in a weekly release update soon after the initial 2025.1 rollout.

Project Tree in VizPortal
Get a better and faster experience navigating to your Tableau projects. Project Tree view is an optional navigation style that has been added to the Vizportal interface. This view is enabled by default, so users who have many projects nested several levels deep can easily browse through their projects in Tableau Cloud, Server, Desktop, and Public.
Feature from Community Ideas

Dutch Language Support
Users in Dutch-speaking regions can navigate Tableau in their native language. Simply go to the Help menu and choose Language setting for Desktop - My Account Settings, Language and Region setting for Tableau Cloud and Server- to navigate Tableau products and Help pages in Dutch!
Data Model Accessibility
Data Model Accessibility makes it easy for all users to navigate Tableau’s relationship data model using keyboard controls and screen readers. Analysts can move between tables and relationships to better understand how data is connected, ensuring everyone can explore and analyze data effectively.

View Data Model
Ensure your visualizations are built using the right data with View Data Model. This dynamic tool helps you understand the relationships between logical tables and confirms you're using the correct fields. As you modify your visualization, the data model view updates in real time—giving you confidence in your analysis and insights.
Decouple Email Address from Username
Admins can enable Tableau Cloud users to update their email for notification purposes. Users may no longer have access to their stale email address's inbox or have been created with a username pointing to an unresolvable inbox. By decoupling the username and email address fields, users can keep updated to receive important notifications from Tableau Cloud.
Note: We have temporarily turned off this feature and are evaluating timelines to reenable it.

Refresh Private Network Flat Files
Keep your flat file data up to date in Tableau Cloud. Upload files to a UNC drive and schedule automatic refreshes to integrate ad-hoc tables with governed data sources seamlessly. This feature increases analyst productivity by centralizing and streamlining data analysis.

Expanded Extract Refresh Permissions
Avoid changing ownership and losing embedded credentials when an admin or a workbook owner is unavailable for immediate response. Admins and owners can edit the permission rules for a selected asset and grant others extract refresh privileges, and users can opt-in for extract failure notifications within a workbook. Allowing users to refresh a data source when it gets used will allow you to eliminate unnecessary refreshes for infrequently used data sources.
Table Viz Extension Enhancement
You can add Table Viz Extension to a workbook through the Tableau Exchange. The new enhancements allow creators to reorganize columns directly and edit aliases on text columns. Further formatting controls allow for customizing the grid's fill, lines, and banding more directly amongst some of the added flexibility of this viz. Table Viz Extension also supports a broader range of keyboard navigation, enabling the selection of headers and columns and an added array of hotkeys for navigation in Tableau Cloud, Tableau Server, and Tableau Public.

Tableau Pulse: Multilingual Support
Drive scalability and reduce misinterpretation of your business trends by getting insights in your local language on both web and mobile. Pulse is available in all Tableau-supported languages and also respects the locale setting on your Tableau account, so specific regional settings such as currency are reflected in your insights.
This feature is generally available.

Tableau Mobile Site Switcher
Eliminate repetitive manual steps and save time by easily switching between multiple cloud sites from a drop-down list on Tableau Mobile. The 'Switch Site' feature allows you to bypass the need to manually find and input the site URL or re-enter credentials each time you switch.
This feature is generally available.

Tableau Pulse: Period Change in Breakdown Chart
Identify what is driving your business with period-over-period changes of dimensions in the breakdown chart on the metric detail page. Pulse now shows you the percent change of dimension values next to the overall value within your breakdown chart.
This feature is generally available.

Tableau Pulse: Drill Down from Breakdown or Insights Chart
Quickly pinpoint and understand insights more precisely by drilling down into a specific dimension value. When you click on a specific item within an insight or breakdown, you'll see data and insights focused solely on that item. This helps you quickly delve one level deeper to better understand changes in your metrics.
This feature is generally available.

Tableau Pulse: Turn Off Expected Range
Enhance the clarity of your insights by toggling off unexpected values directly in the metric definitions within the Insights tab. By doing so, you'll disable the expected range, and remove the insight text and blue visual indicator from the chart on the insights page.
This feature is generally available.

Tableau Pulse: Corner Style for Pulse Metrics
Enhance the look of Pulse metrics in your dashboards with the ability to toggle between square and rounded corner styles. You can now switch between corner styles for Pulse metrics in the Pulse Dashboard Object settings.
This feature is generally available.

Tableau Pulse: Link Related Content
Access content relevant to your analysis easily by linking related content to metrics. You can now add up to five links in the core definition step, which will be presented on the insight exploration page and related metrics page.
This feature is generally available.

Tableau Pulse: Time Range Grouping
Drive more relevance and actionability from your insights by grouping metrics by time range. This allows you to review your metrics' performance in the context of a specific time frame, in addition to the existing grouping options. Setting a default view will be reflected across email and Slack digests, the Tableau mobile app, and the web.
This feature is generally available.

Tableau Pulse: Datasource Goals
Drive efficiency and accuracy by tracking your metrics performance in relation to goals from your data source. Rather than create a goal for each metric, you can now reference goals from the datasource in the metric definition. Datasource goals are optional, apply to all related metrics, and support partial and full periods.
This feature is generally available.

Tableau Pulse: Enhanced Q&A
Discover insights conversationally across related metrics and see how they impact business trends with speed and ease, all powered by AI. Pulse's enhanced Q&A experience provides intuitive key insights, relevant visualizations, source references, and suggested follow-up questions to help you dig deeper. Available as a premium feature on both web and mobile.

Logical Table Data Source Filter
Optimize your data model with logical table filters in Tableau. Reduce the number of rows before tables participate in relationships, improving query performance and analytic flexibility without Custom SQL. Data stewards can filter datasets to relevant information, such as limiting historical data to recent years, while giving analysts control through parameterized filters.

Multi-fact Relationship Relatability Infoscenting
Easily navigate complex data models with Tableau’s Multi-Fact Relationship Infoscenting, which proactively highlights how fields in your visualization relate across shared dimensions. This feature eliminates ambiguity by surfacing contextual guidance, empowering analysts to explore data confidently without needing deep model expertise. Unlock deeper insights with fewer, more comprehensive data sources.
User Attributes in Native LWC
User Attributes in Native LWC allows developers to apply data security in Tableau’s embedded Experience Cloud portals without writing custom code. By configuring user attributes directly in the admin area and selecting them in the native LWC, developers can streamline secure data access and focus on building better user experiences.
Customizable Pulse Web Component
The Customizable Pulse Web Component empowers developers to fully tailor the look and behavior of Pulse by applying custom colors, fonts, and filters through code. With two-way communication support, developers can integrate Pulse into their applications while maintaining brand consistency and enhancing user interaction.
Tableau Agent Multilingual Support
Tableau Agent Multilingual Support enables users to interact with Tableau Agent in their native language, making insights more accessible across the global Tableau community. By automatically detecting the site’s language settings, Tableau Agent delivers conversational analytics in languages like French, Italian, German, Spanish, Japanese, and Portuguese.
Tableau Cloud Indonesia & Singapore Region
Meet legal and data-residency requirements and increase performance for local users in the Indonesia and Singapore regions. When creating a site in Tableau Cloud Manager, Tableau customers can select Indonesia or Singapore regions.
Note: Singapore is generally available since December '24
Feature from Community Ideas

Default Date & Number formats in Web Authoring
Similar to Tableau Desktop, content creators can set the default number and date formatting via a new menu item when authoring on web. Select single or multiple related fields to set default display formatting in Tableau Cloud and Tableau Server.
Feature from Community Ideas

Activity Log for Security Events
Keep an eye on important site activities at all times and meet security and auditing compliance requirements with Tableau Cloud. Monitor all successful and failed login attempts, changes made by administrators to your key platform configuration settings, and where Tableau Prep flows are reading from and writing to in all your Tableau Cloud sites.

Keyboard Accessible Interactivity
In Tableau, everyone can interact with and take action on their data, including users who do not use a mouse to explore and understand their data. Users can keep, exclude, and sort data in a tooltip and select and highlight marks without a mouse in Tableau Cloud, Tableau Server, and Tableau Public.

Tableau Prep Query Logging in Resource Monitoring
Easily identify when Tableau prep flow run times increase and determine whether different queries are being run or whether the same queries are taking longer. This information is now available to Tableau Server admins through the Resource Monitoring Tool to effectively troubleshoot problems quickly.
* Requires Tableau Enterprise License

Server to Cloud Migration SDK Enhancements
The Cloud Migration SDK is a toolbox for developers to build and customize their migration applications to their specific needs. You can now automatically migrate embedded credentials and subscriptions with the existing supported content types, decreasing room for error and time required.
External Token for SCIM with Connected Apps
Using Connected Apps, admins can bypass the SCIM token that Tableau generates and instead use the token generated by their IdP. The SCIM bearer token that is produced by Tableau (aka as an API token) is no longer needed for SCIM requests in Tableau Cloud.
Note: This feature will come soon after the Tableau 2025.1 release

Activity Log on Tableau Cloud Manager
Meet security and auditing compliance requirements by monitoring actions that can enact privilege changes within the Tableau Cloud platform. Tableau Cloud Manager admins can automate the regular export of activity log files through the new REST API via scripts or automation tools, making it easier than ever to integrate with monitoring and SIEM platforms.

Tableau Cloud Release Preview
Get advanced access to functionality changes in Tableau Cloud and understand how changes will impact your unique content, usage, and users before changes get applied to critical business content. Admins can select the Release Preview - US West region when creating a site to get access to changes in functionality ~2+ weeks in advance of other Tableau Cloud sites*.
*Available soon and as part of Tableau+ edition of Tableau Cloud.
Tableau Cloud Manager Authentication Enhancements
Two authentication enhancements are available in Tableau Cloud Manager. First, admins can configure their IdP with SAML or OIDC protocol so they sign in with the same IdP to both their tenant and their sites. Second, admins get even more control by being able to reset MFA verifiers for other single tenant users -regardless of whether they belong to more than one site in the tenant- and manage their MFA verifiers directly in Tableau Cloud Manager instead of handling them on the site level.
Note: SAML & OIDC support is generally available. MFA Verifier reset and management feature will arrive in April 2025.

Viz Load Progress Dialog
The new and improved Viz Load Progress Dialog provides clear updates when a visualization takes time to load. Instead of a spinner, you will see a progress indicator that keeps you informed. With an improved experience and a cancel option, you stay in control and eliminate unnecessary wait times. Faster insights, fewer frustrations, and a more efficient workflow.

Profile Organization: Manual Categorization
Organizing your Tableau Public profile has never been easier. Seamlessly organize the vizzes on your Tableau Public profile page into unique categories using Tableau AI. Alternatively, opt for manual categorization to have complete control over how your vizzes are displayed.

Tableau Pulse: Digest Scheduling
Discover insights conversationally across related metrics and see how they impact business trends with speed and ease, all powered by AI. Pulse's enhanced Q&A experience provides intuitive key insights, relevant visualizations, source references, and suggested follow-up questions to help you dig deeper. Available as a premium feature on both web and mobile.

Tableau Pulse: Unfavorable Trend Alerts
Stay informed of unfavorable metric changes and eliminate the need for manual checks with proactive alerts on mobile, email, Slack, and desktop. Pulse checks metric trends daily and sends alerts when changes are detected. Alerts are sent during digest updates to manage query volume, and mobile notifications are only delivered when the app is active.

Content Exploration Hub
Navigate to the Content Exploration Hub on Tableau Public to easily discover trending and recommended visualizations from a centralized location. Add new vizzes to your favorites collection with a click of a button or follow new and inspiring authors to receive updates on their latest visualizations and personal favorites. (Available in April)


