Tableau Agent 다국어 지원
다양한 언어로 데이터를 분석할 수 있습니다. 이제 사용자는 Tableau Agent(그리고 Tableau Pulse)와 대화형 환경에서 프랑스어, 이탈리아어, 독일어, 스페인어, 일본어, 포르투갈어로 소통할 수 있습니다. 이제 더 많은 사용자가 모국어로 대화형 분석을 이용할 수 있습니다.

Tableau Cloud용 비공개 연결
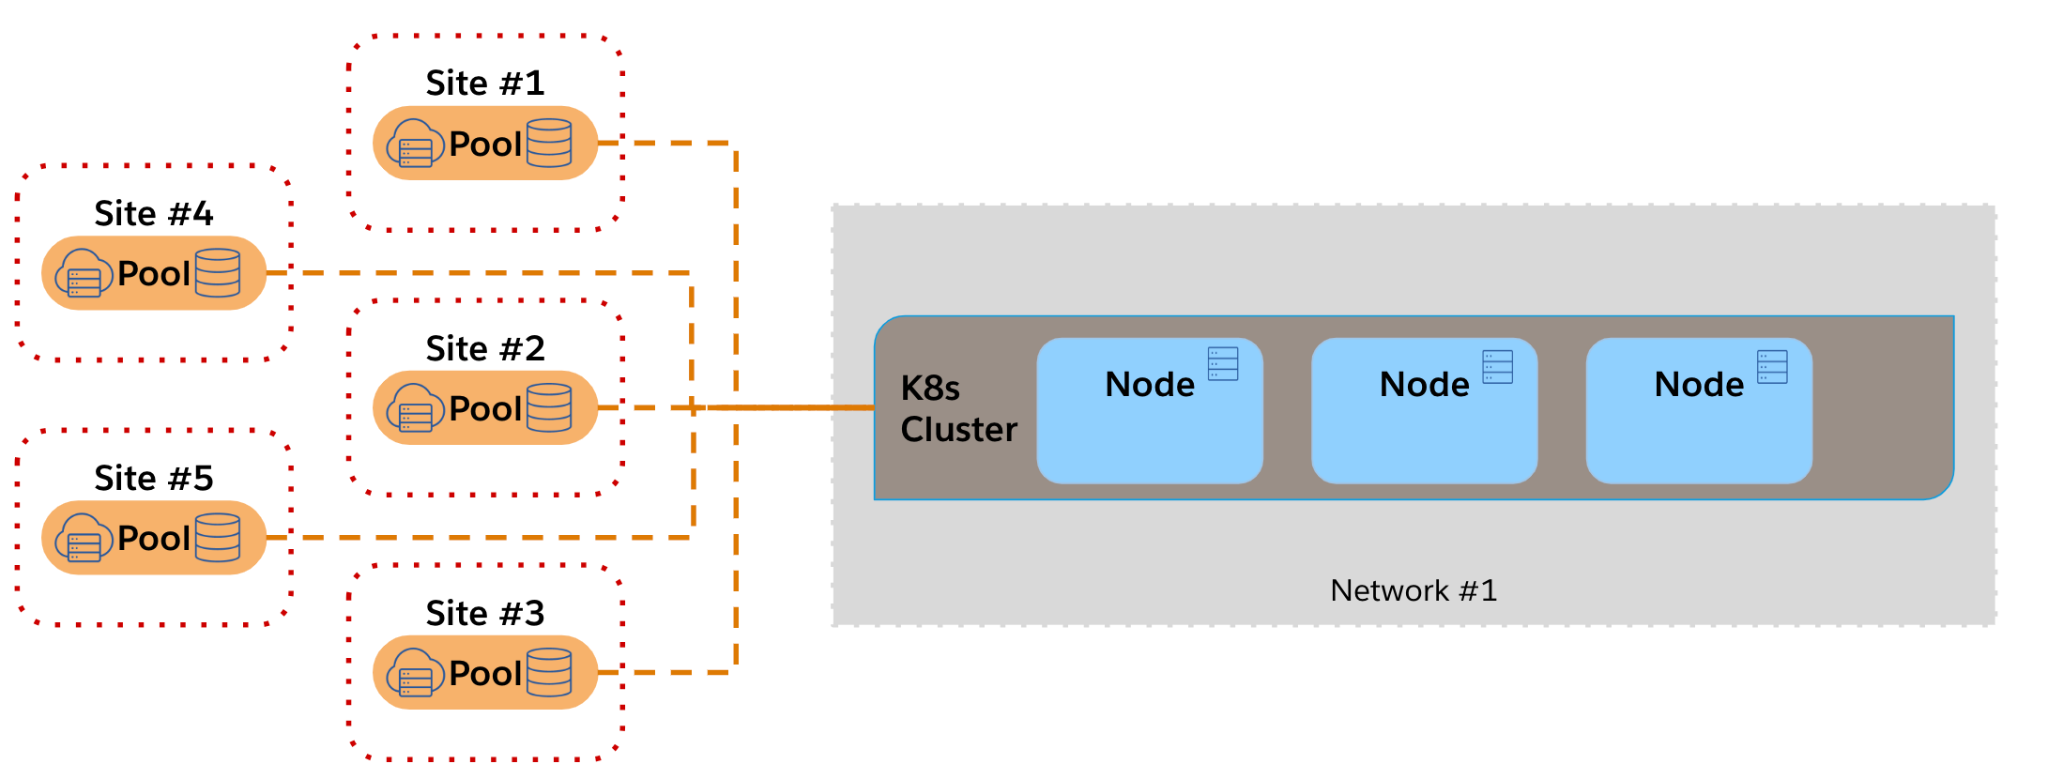
데이터에 대한 연결을 비공개로 유지하고 공용 인터넷과 분리하여 보안을 강화합니다. 전용 비공개 연결을 통해 AWS 데이터를 Tableau Cloud에 안전하게 연결합니다. 비공개 연결은 데이터를 공용 인터넷에 노출하지 않으면서 AWS 데이터와 Tableau Cloud 간에 신뢰할 수 있는 연결을 설정합니다.

개편된 Tableau Pulse 모바일 홈페이지
이동 중에도 쉽게 핵심 메트릭에 액세스하고 비교할 수 있습니다. 세 가지 이상의 메트릭을 한눈에 확인하여 즉시 추세를 파악하고 더 빠르고 쉽게 의사 결정을 내릴 수 있습니다.
Tableau Pulse 기능 릴리스에 대해 더 자세히 알아보십시오.

VizQL Data Service API
Tableau에 게시된 데이터 원본의 잠재력을 활용하여 사용자 지정 솔루션을 구동할 수 있습니다. 이러한 강력한 자산을 새 시스템이나 기존 시스템에 통합하여 사용자의 고유한 요구 사항을 충족하도록 맞춤된 혁신적인 애플리케이션과 경험을 만드십시오.

Tableau Cloud 릴리스 미리 보기 사이트
Tableau 관리자는 새 릴리스에 먼저 액세스하여 앞서 나갈 수 있습니다. 새 릴리스를 미리 테스트하여 기능적 변경 사항을 직접 사용해 보며 알아보십시오. 업데이트 사항이 비즈니스 고유의 콘텐츠에 어떤 영향을 미치는지 확인하여 새로운 기능을 효과적으로 활용하도록 준비할 수 있습니다.

Tableau 릴리스에 대해 다른 사람보다 먼저 알아보기
DataFam Discovery 사용자 그룹에서 Tableau 제품 관리자와 함께 곧 출시되는 새로운 기능에 대해 알아보십시오.
지금 가입
모든 기능

사용자 지정 테마
모든 통합 문서에 걸쳐 일관되고 반복 가능한 서식을 지정할 수 있습니다. 테마를 한 번 만들어 두면 새 통합 문서를 작성할 때 테마를 재사용하거나 기존 통합 문서에 적용하여 빠르게 업데이트할 수 있습니다. 새로 만든 사용자 지정 테마는 Tableau Cloud 및 Tableau Server에 일단 게시된 후에는 그대로 적용됩니다. 기존 통합 문서를 템플릿으로 사용하고 스타일을 테마로 '내보낼' 수 있습니다. 그런 다음 해당 사용자 지정 테마를 다른 통합 문서에 적용할 수 있습니다. 이 새로운 기능은 Tableau Desktop의 서식 메뉴에서 제공됩니다.

휴지통
실수로 뭔가를 삭제했는데 다시 복구하고 싶었던 적이 있으세요? 우리 모두 그런 적이 있습니다. Tableau Server 및 Cloud 고객은 통합 문서, 데이터 원본 또는 프로젝트를 삭제했더라도 삭제 후 30일 동안 휴지통 영역을 통해 액세스할 수 있으며, 이 기능은 기본적으로 활성화되어 있습니다. 모든 사용자가 삭제된 콘텐츠를 볼 수 있으며, 사이트 관리자는 사이트의 모든 사용자가 삭제한 모든 콘텐츠를 볼 수 있습니다. 휴지통의 콘텐츠를 Tableau Cloud 및 Server의 지정된 위치로 복원할 수 있습니다.
커뮤니티의 제안을 반영한 기능
참고: 이 기능은 2025.1에 최초 배포 후, 주간 릴리스 업데이트로 Tableau Cloud에 배포됩니다.
테이블 비주얼리제이션 확장 프로그램 개선 사항
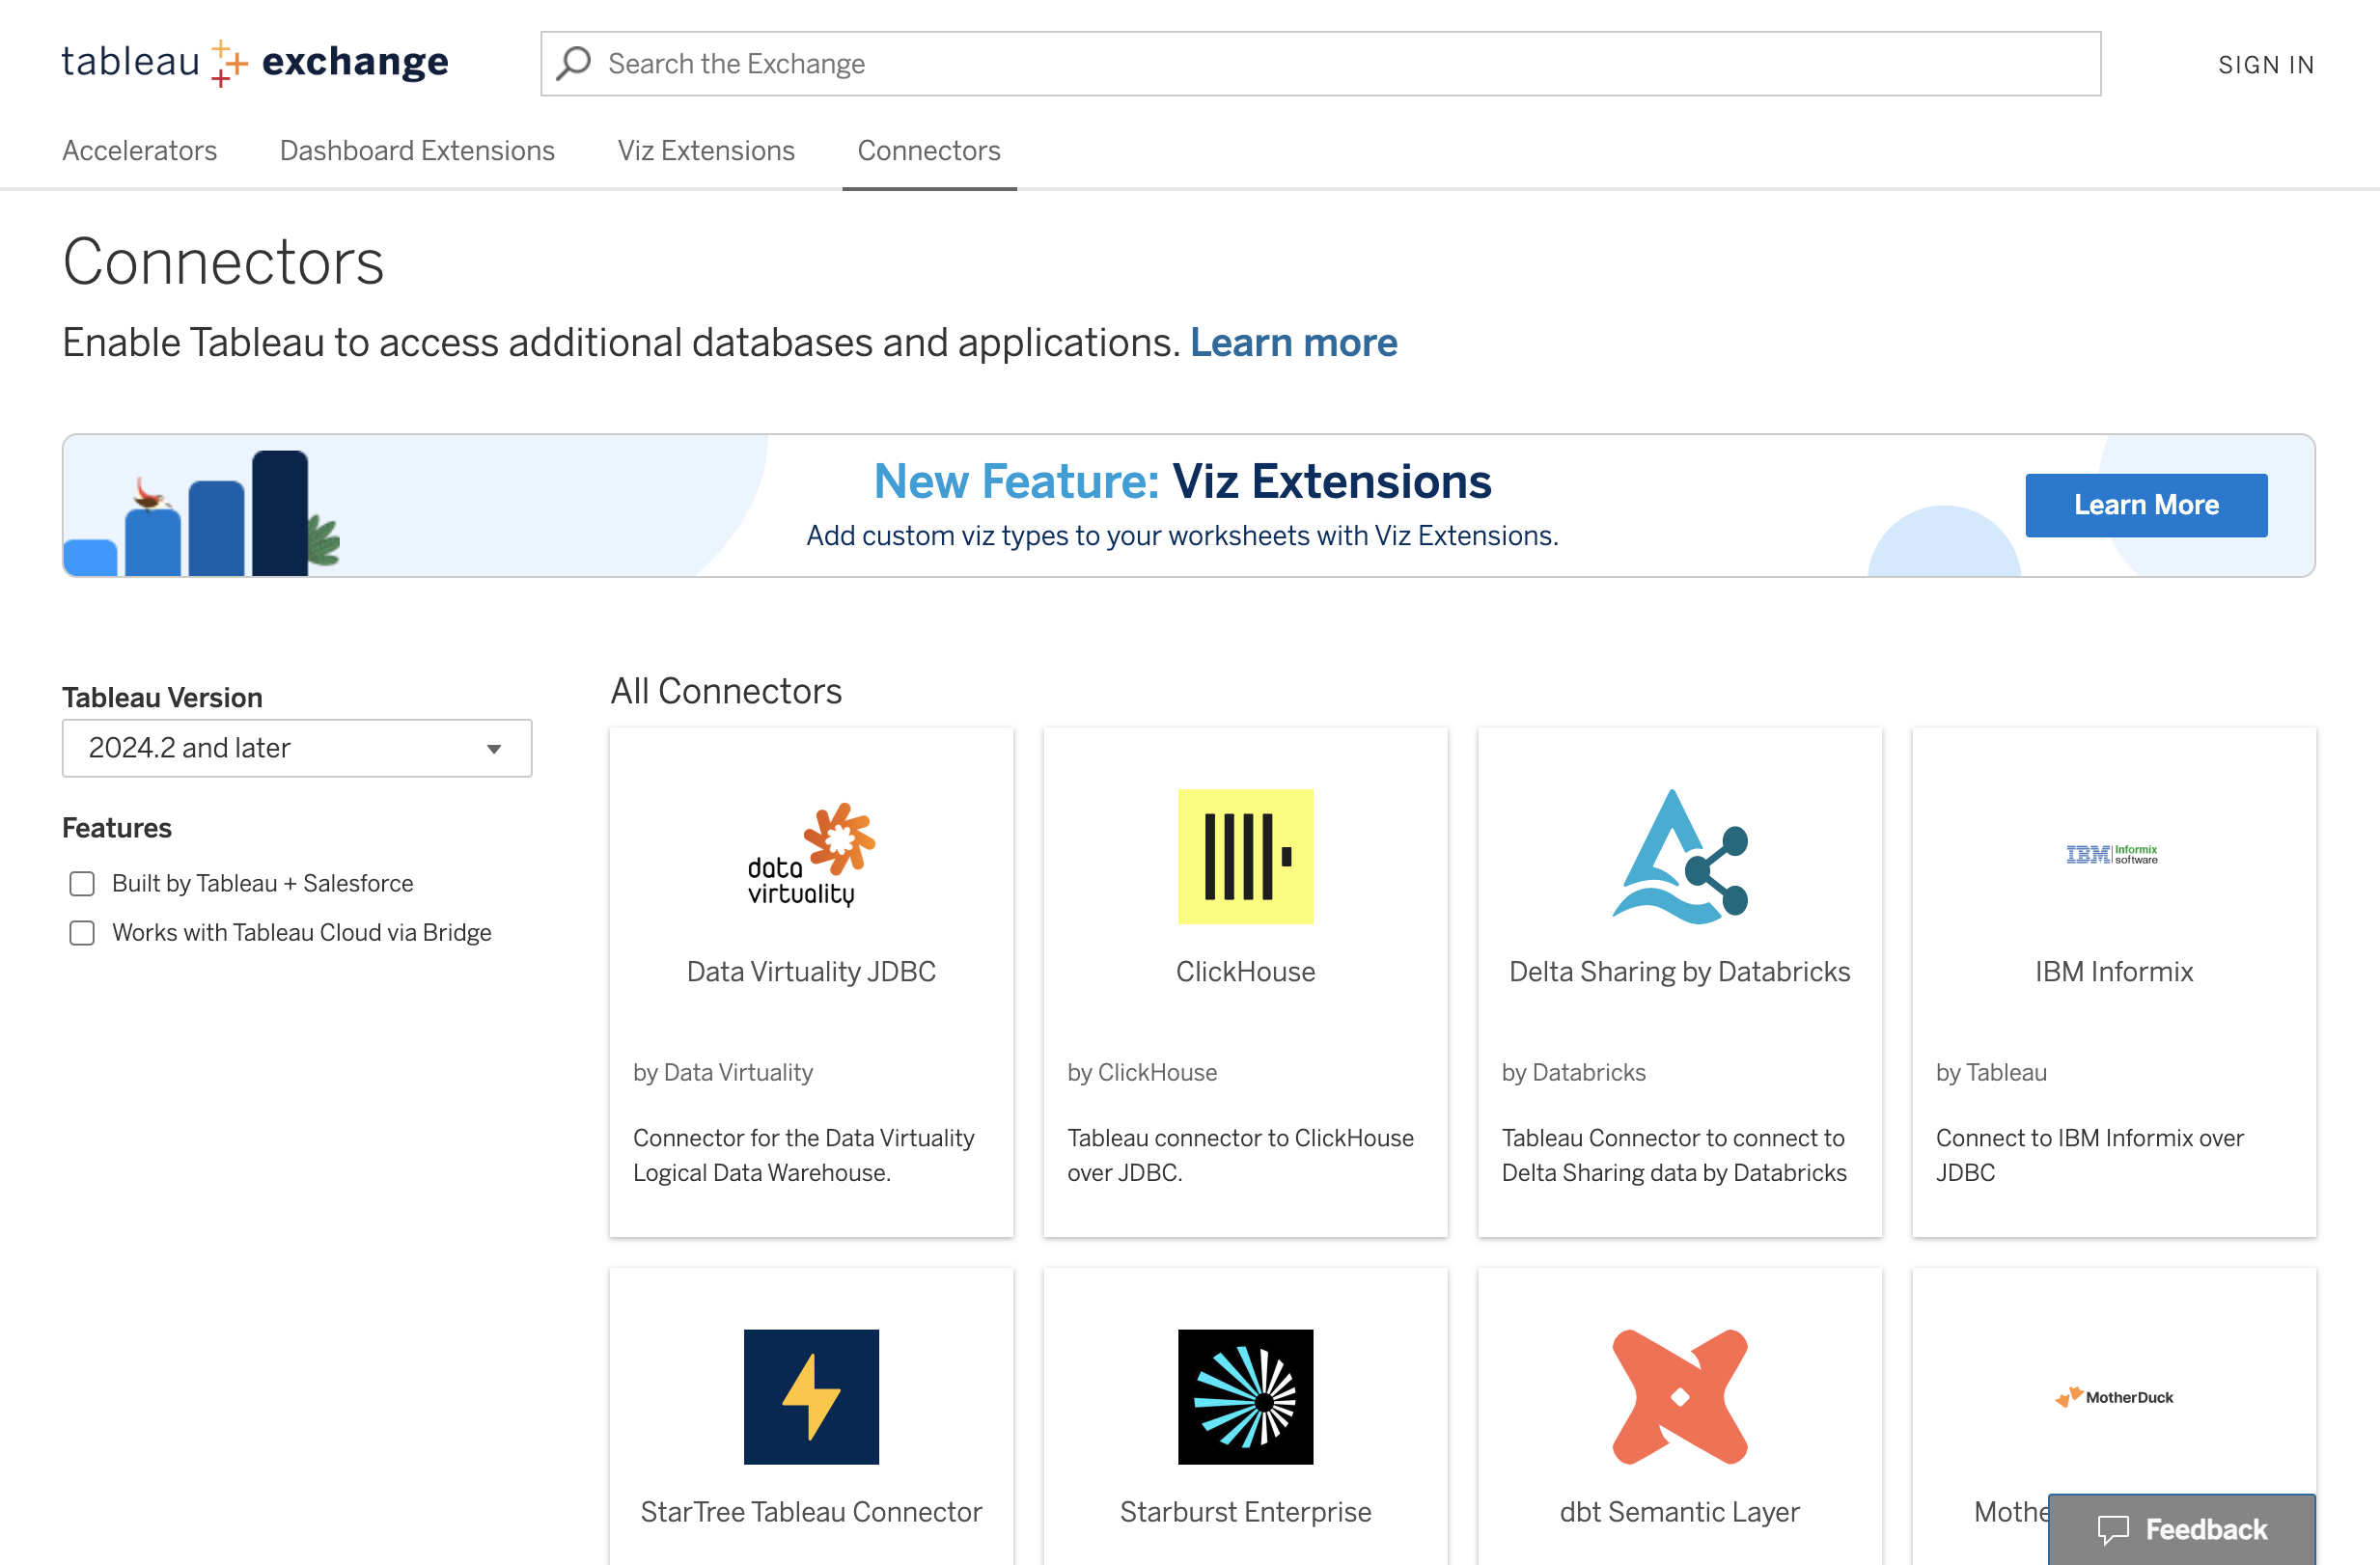
Tableau Exchange를 통해 테이블 비주얼리제이션 확장 프로그램을 통합 문서에 추가할 수 있습니다. 이 새롭게 향상된 기능으로 크리에이터는 열을 직접 재구성하고 텍스트 열의 별칭을 편집할 수 있습니다. 추가적인 서식 지정 컨트롤을 사용하면 이 비주얼리제이션의 추가된 유연성 중에서도 특히 그리드의 채우기, 라인, 색상 교차를 좀 더 직접적으로 사용자 지정할 수 있습니다. 또한 테이블 비주얼리제이션 확장 프로그램은 더욱 폭넓은 키보드 탐색을 지원하여 Tableau Cloud, Tableau Server, Tableau Public에서 탐색을 위해 머리글 및 열을 선택할 수 있고 다양한 단축키 집합을 추가할 수 있습니다.
Tableau Cloud Manager 인증 기능 강화
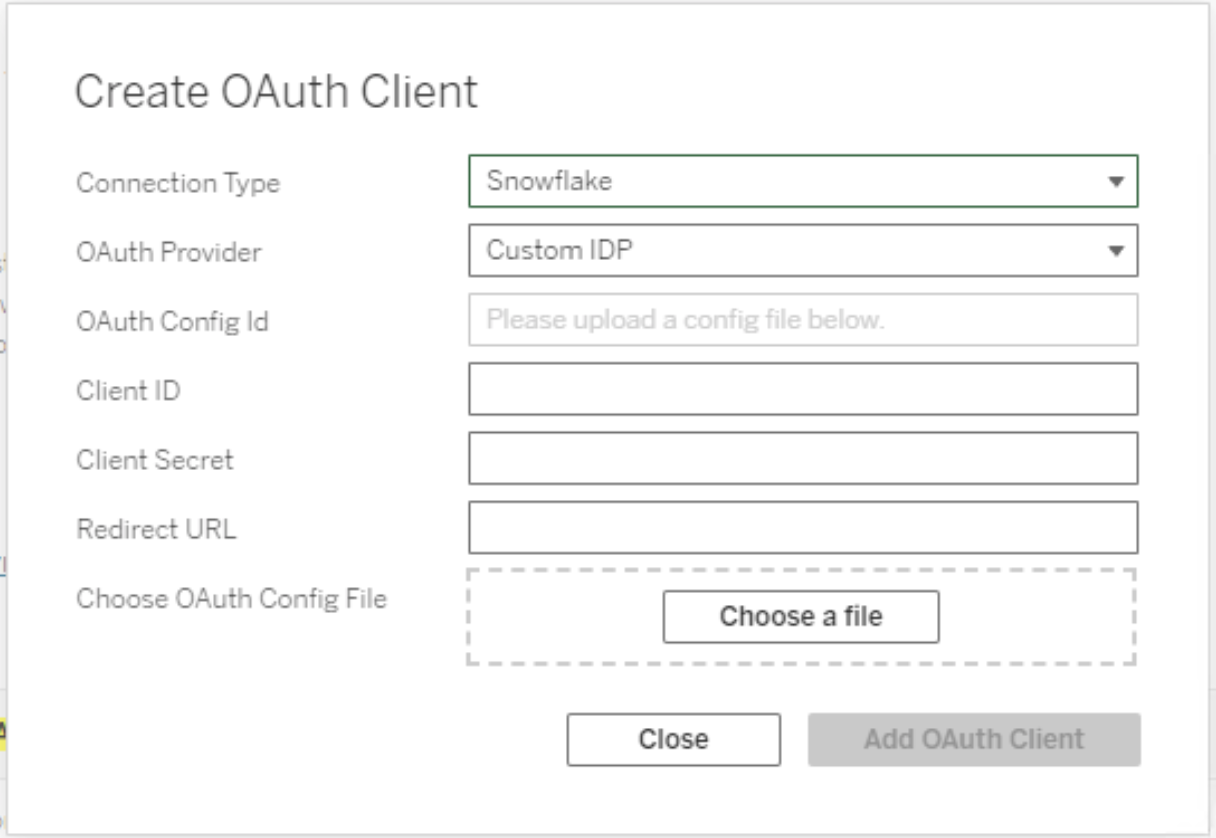
Tableau Cloud Manager에서 두 가지 인증 기능이 강화되었습니다. 첫째, 관리자는 SAML 또는 OIDC 프로토콜로 IdP를 구성하여 동일한 IdP로 테넌트와 사이트에 모두 로그인할 수 있습니다. 둘째, 관리자는 다른 단일 테넌트 사용자에 대한 MFA 확인 프로그램을 재설정하여 더욱 강력한 제어권을 확보하고(해당 테넌트에서 두 개 이상의 사이트에 속해 있는지 여부와 무관함) 사이트 수준에서 MFA 확인 프로그램을 처리하는 대신 Tableau Cloud Manager에서 직접 관리할 수 있습니다.

Tableau Pulse: Digest Scheduling
Discover insights conversationally across related metrics and see how they impact business trends with speed and ease, all powered by AI. Pulse's enhanced Q&A experience provides intuitive key insights, relevant visualizations, source references, and suggested follow-up questions to help you dig deeper. Available as a premium feature on both web and mobile.


