DataFam Roundup: January 31 - February 4, 2022


Welcome! Dig into the first DataFam Roundup (of 2022!!)—a weekly blog that brings together community content all in one post. As always, we invite you to send us your content—and the DataFam content from your peers that have inspired you! Find the content submission form here.
DataFam content
Gwyneth Cheng and Griselda Gabriele, kontinentalist: Introducing Data Deep Dive
Dive into content created by the Tableau Community:
- Eric Balash, The Tableau Student Guide: 2022/Week 1 - Build a Scatter Plot
- Elliott Stam, Devyx: Automated trading system decisions: we decided on smoothed trends instead of noisy actual prices
- Eric Parker, OneNumber LLC: How to Tableau: Custom Date Filter for Dashboard
- DataKoStreaming: All About the Isekai, Twitch Streaming and Tableau
- Jim Dehner: 6 Unique Types of Filters and How they Affect the Data Table
- Jared Flores, WhatTheViz: 100 Days of #PreppinData Recap: Put Some Prep In Your Step
- Mark Bradbourne, Just 5 Minutes: A Tableau Community Epiphany...
- Grant Quick: 5 Learnings from Tableau Partner Dataviz Masters
- Jocelyn Rivera: Data Book Recommendations
- Jason Khu: How to come up with blog post ideas
- Anthony Starks, Nightingale: The #DuBois Challenge
- Alexander Mou, VizDiff: Sizing a Trellis Chart in Tableau
- Andy Kriebel, VizWiz: How to Calculate the Distance Between Two Points
- Kim Eckart and Rebecca Gourley: For the uninsured, crowdfunding provides little help in paying for health care and deepens inequities featuring interactive data viz
- Gwyneth Cheng and Griselda Gabriele, kontinentalist: Introducing Data Deep Dive
- Alex Christensen: What’s the Best Undergraduate Major for a Career in Data Analytics?
- LiftedViz: What is Tableau?
- Dawn Harrington, TechTipsGirl: How to Download Multiple Sheets to a PDF or PowerPoint
Upcoming events and community participation

- Iron Viz 2022 Qualifiers: Let your data skills shine on the global stage. The Iron Viz qualifier contest runs from January 10 through February 7 and the top three entries will go on to compete in the championship at Tableau Conference 2022. Find a data set that aligns with this year's theme, Visualizing the Arts, and submit your entry on Tableau Public. At stake are bragging rights - and thousands of dollars in prizes.
- Iron Viz Feedback with Tableau Ambassador and Iron Quest Founder Sarah Bartlett
- Stay up to date with the latest and greatest from the Tableau Community. We'll help you along in your Tableau journey, bring your data skills to the next level, and nurture powerful connections.
- Sign up to be a panelist for the 3charts@3 Live: A Mystery Chart Show featuring topics like personal finance, energy, healthcare and more!
Vizzes
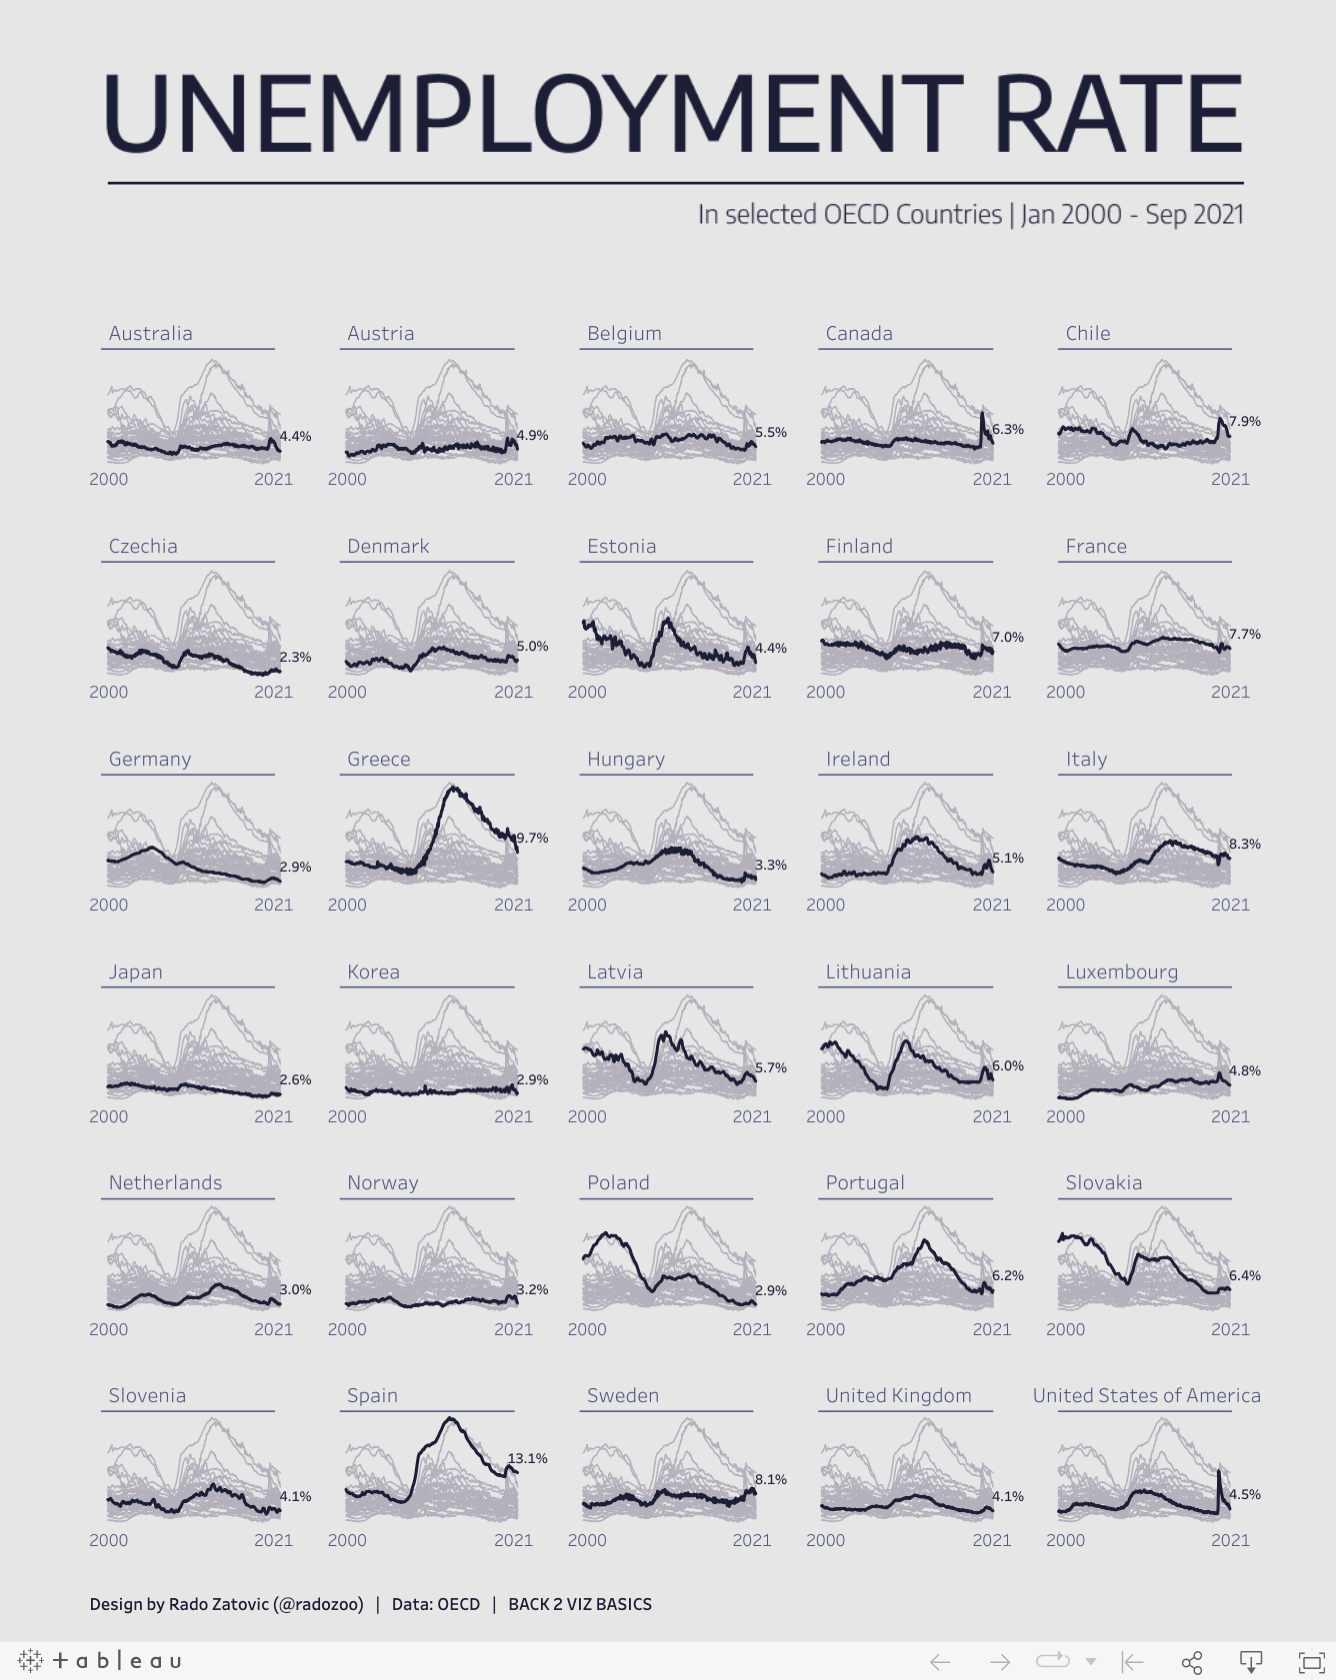
Rado Zatovic: #B2VB WEEK 2 | UNEMPLOYMENT RATE IN OECD COUNTRIES
Catch this week’s Viz of the Days here and subscribe to get them emailed directly to your inbox.
Check out some inspirational vizzes created by the community:
- Sam Epley: Tableau Public Featured Authors - January 2022 Cohort
- Rado Zatovic: #B2VB WEEK 2 | UNEMPLOYMENT RATE IN OECD COUNTRIES
- Jasmine Lim: Global CO2 Emissions in 2020
- Tanya Shapiro: Watt The Hell, Peloton?
- Arshad Ejaz: Civilian Awards in India
Community Projects
Back 2 Viz Basics
A bi-weekly project helping those who are newer in the community and just starting out with Tableau. Not limited just to newbies!
Web: Back 2 Viz Basics
Twitter: #B2VB
Week 3: Build Your Best Text Table
Data Plus Music
A monthly project visualizeing the data behind the music we love!
Web: Data Plus Music
Twitter: #DataPlusMusic
January 2022: The Grammys
Games Night Viz
A monthly project focusing on using data from your favorite games.
Web: Games Nights Viz
Twitter: #GamesNightViz
January 2022: Level 1: Hello World
Workout Wednesday
Build your skills with a weekly challenge to re-create an interactive data visualization.
Web: Workout Wednesday
Twitter: #WOW2021
Week 04: Can you build a reference box?
Preppin' Data
A weekly challenge to help you learn to prepare data and use Tableau Prep.
Web: Preppin’ Data
Twitter: #PreppinData
Week 52: Departmental Decemeber - Operations
Iron Quest
Practice data sourcing, preparation, and visualization skills in a themed monthly challenge.
Web: Iron Quest
Twitter: #IronQuest
Storytelling with Data
Practice data visualization and storytelling skills by participating in monthly challenges and exercises.
Web: Storytelling with Data
Twitter: #SWDChallenge
February 2022: declutter & focus
Project Health Viz
Uncover new stories by visualizing healthcare data sets provided each month.
Web: Project Health Viz
Twitter: #ProjectHealthViz
January 2022: One Year of Sleep
Diversity in Data
An initiative centered around diversity, equity & awareness by visualizing provided datasets each month.
Web: Diversity in Data
Twitter: #DiversityinData
November - December 2021: The countdown to Christmas and New Year!
SDG Viz Project
Visualize data about Sustainable Development Goals provided by the World Health Organization.
Web: SDG Viz Project
Twitter: #TheSDGVizProject
Sports Viz Sunday
Create and share data visualizations using rich, sports-themed data sets in a monthly challenge.
Web: Sports Viz Sunday
Twitter: #SportsVizSunday
January 2022: Winter Olympics
Viz for Social Good
Volunteer to design data visualizations that help nonprofits harness the power of data for social change.
Web: Viz for Social Good
Twitter: #VizforSocialGood
Jan 9, 2022 - Feb 6, 2022: Build up Nepal
Real World Fake Data
Create business dashboards using provided data sets for various industries and departments.
Web: Real World Fake Data
Twitter: #RWFD
Viz 2 Educate
Each month, create vizzes on global education syllabus topics as resources for teachers worldwide.
Web: Viz 2 Educate
Twitter: #Viz2educate
Makeover Monday
Join the community every Monday to work with a given data set and create better, more effective visualizations.
Web: Makeover Monday
Twitter: #MakeoverMonday
Historias relacionadas
DataFam Roundup: November 11-15, 2024
 15 Noviembre, 2024
DataFam Roundup: November 4-8, 2024
8 Noviembre, 2024
DataFam Roundup: October 28 - November 1, 2024
1 Noviembre, 2024
Suscribirse a nuestro blog
Obtenga las últimas actualizaciones de Tableau en su bandeja de entrada.