DataFam Roundup: November 4-8, 2024
Welcome! Dig into this week's DataFam Roundup—a weekly blog that brings together community content all in one post. As always, we invite you to send us your content—and the DataFam content from your peers that have inspired you! Find the content submission form here.
Community Highlight
To recognize new and consistent Tableau contributors—we’re excited to have a section within the weekly DataFam Roundup called the Tableau Community Highlight. Find out how to get involved.

Flavio Matos, Data Analytics Consultant
London, United Kingdom
Flavio Matos is a Data Analytics Consultant originally from Brazil, who now lives and works in the London area. Flavio appreciates the Tableau community’s collaborative spirit and that there is always guidance available when it is needed. He got more involved in the community when he started writing LinkedIn articles to share what he was learning and help others who were on the same learning journey with Tableau.
At the London and New York City Tableau User Groups, Flavio has had the opportunity to present on the power of dashboard translation to make insights more global, and on how bilingual dashboards can improve accessibility. A highlight for him was winning "Viz of the Day" with his Periodic Table of Wine viz and being invited to create a Workout Wednesday challenge, which meant a lot to him because Workout Wednesday challenges were instrumental to his learning early in his Tableau journey. In his free time, Flavio works on pro bono Tableau projects with NGOs worldwide, and some of his work was even showcased at the UN Summit in New York City last year.
Connect with Flavio on Linkedin, Tableau Public, and on his blog.
DataFam content

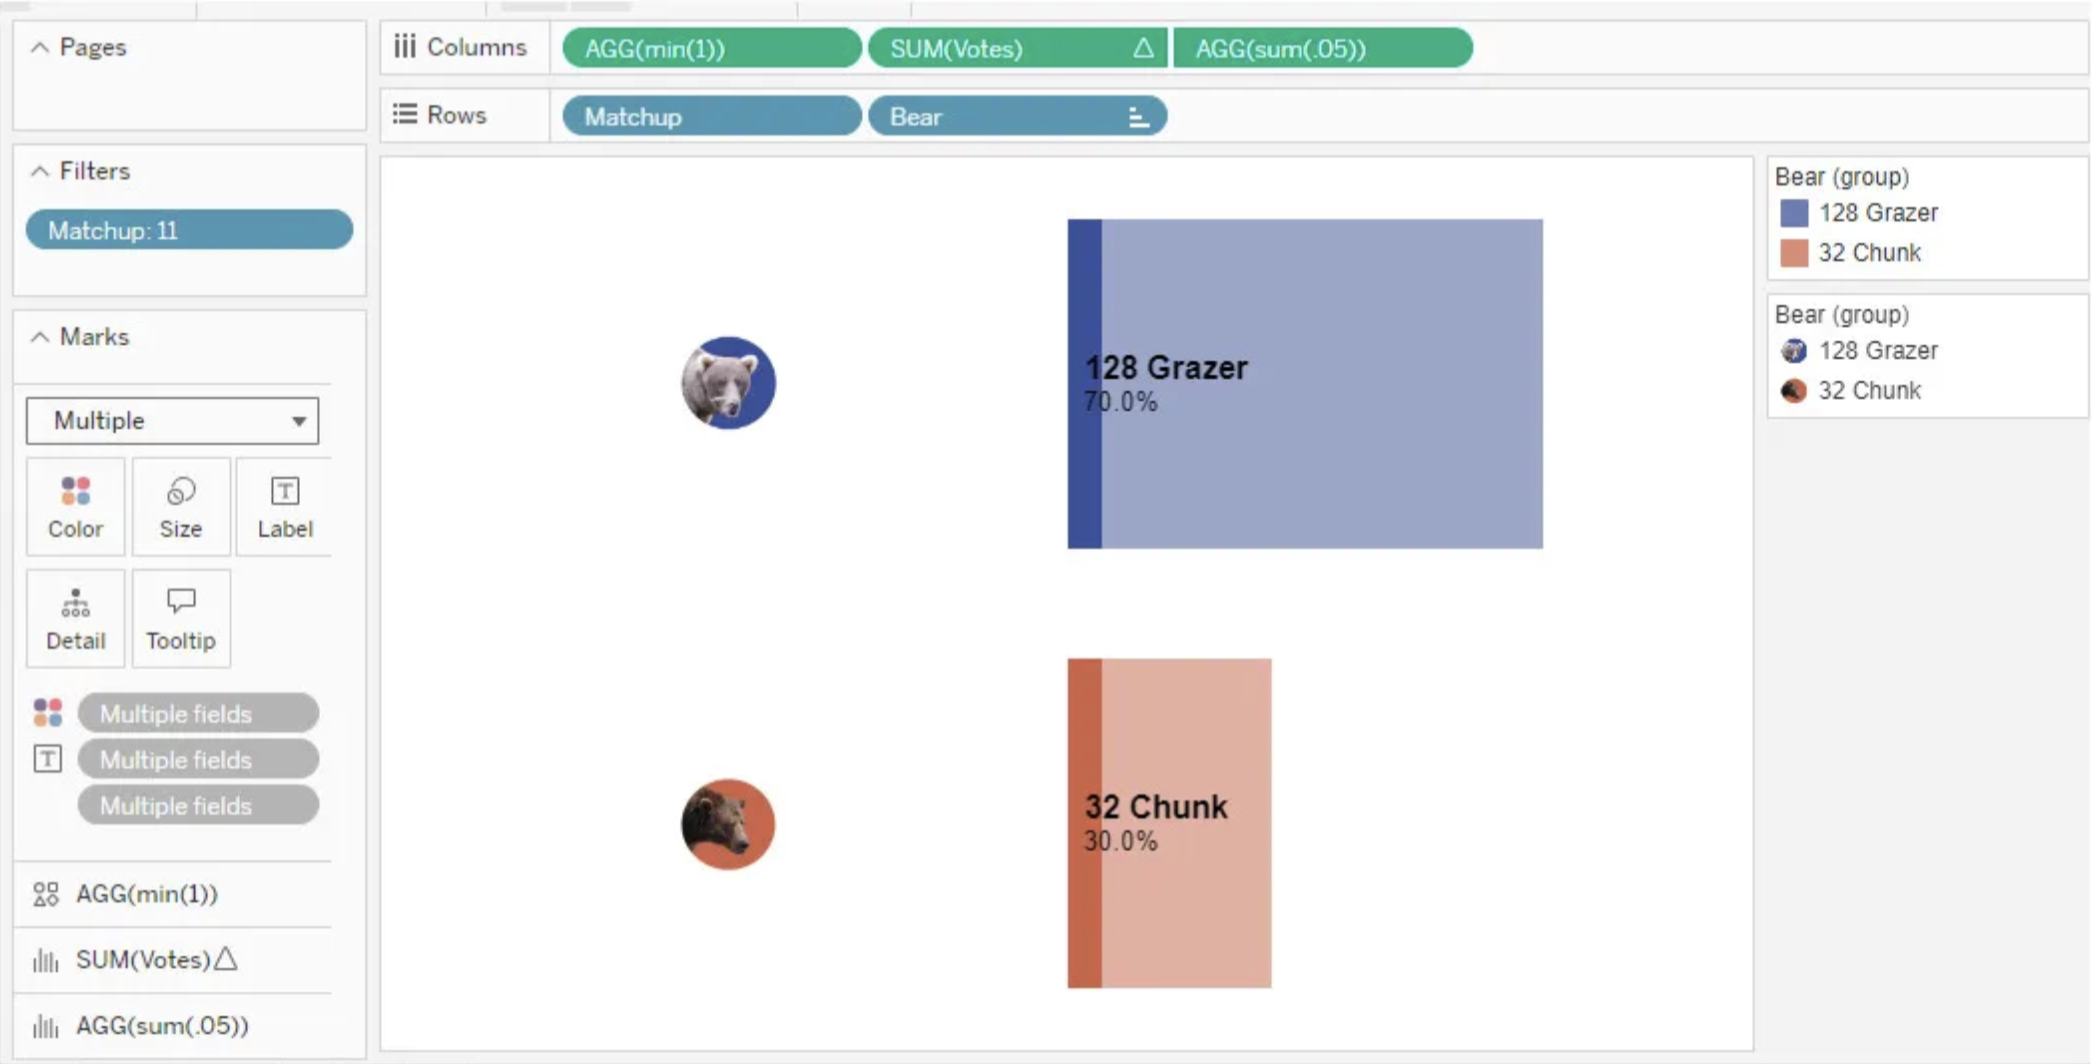
Britney Rosenau: Stylized Bar Charts in Tableau
Dive into content created by the Tableau Community:
- Uday Gundu: Data Meets Design: Crafting Stunning, Insightful Dashboards with Tableau
- BlueSky starter pack for Tableau
- Adam Mico: Nominations for #TableauNext2025 are open!
- Steve Adams: Explaining Tableau's Order of Operation
- Eric Balash: Data After Hours with Sekou Tyler
- Brittany Rosenau: Stylized Bar Charts in Tableau
- Matthias Giger: Resolved Issues Tableau Desktop, Prep and Server
- Daniel Bradley: Know before you go - Tableau DataFam Europe 24
- Louis Yu: Secrets of the Viz: Monumental Women
- Data2Vizuals: Dynamic Y Axis: Halloween MoM
- Dawn Harrington, Tech Tips Girl: Be Kind to Your Future Self
Team Tableau content
Upcoming events and community participation
- Tableau DataDevQuest: Unlock the Power of Tableau APIs: Innovate, Automate, and Elevate Your Data Solutions
-
Women in Dataviz Virtual Coffee Breaks: Held every sixth Thursday morning in the EST time zone, Virtual Coffee Breaks are a casual networking event.
-
Charting Your Data Path: Career Journeys and Tips with the DataFam Virtual Event - Join DataFam members as they share their data career journeys and discuss how they leveraged the Tableau Community and free resources to sharpen their data skills, stay current, and grow their careers.
- CRM Analytics Community Office Hours! Have CRM Analytics questions? Want to know how to work with data? Want to learn something new? Have visualization ideas you want to share or need feedback on? Want to just hang out with a bunch of us? Come join us (virtual)!
Visualizations

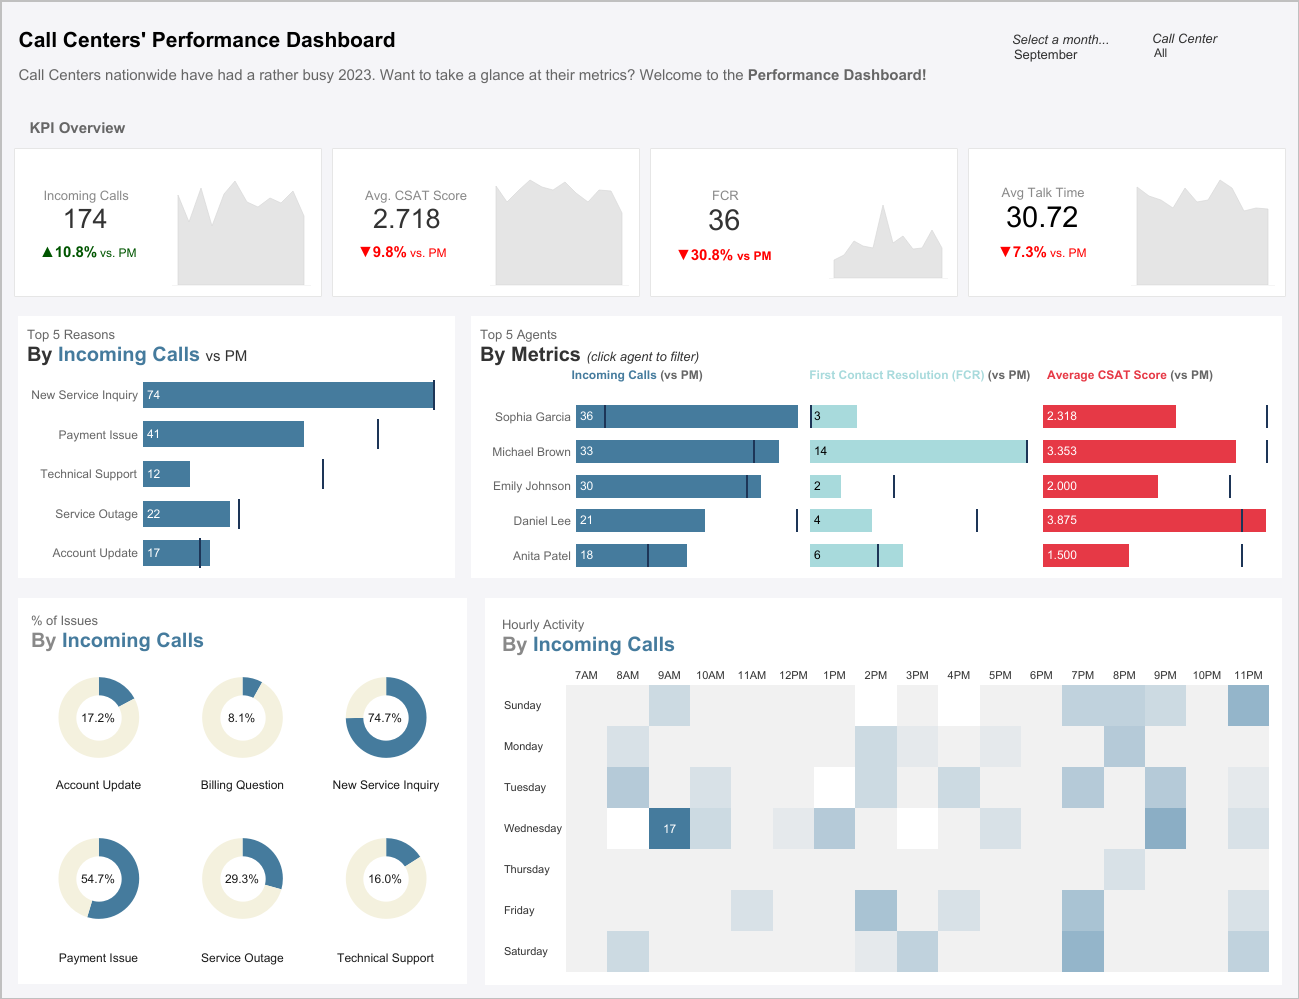
Neto Anyama: Call Center Dashboard
See the latest Viz of the Day, trending vizzes, featured authors, and more on Tableau Public.
Check out some inspirational vizzes created by the community:
- Tobiloba Babajide: Income Groups and Internet Access
- Neto Anyama: Call Center Dashboard
- Aakarsh R: Chess in the Spotlight
Community Projects
Back 2 Viz Basics
A bi-weekly project helping those who are newer in the community and just starting out with Tableau. Not limited just to newbies!
Web: Back 2 Viz Basics
X: #B2VB
Week 21: Visualize a Distribution
Workout Wednesday
Build your skills with a weekly challenge to re-create an interactive data visualization.
Web: Workout Wednesday
X: #WOW2022
Week 45: Can You Switch A Dashboard Theme?
Preppin' Data
A weekly challenge to help you learn to prepare data and use Tableau Prep.
Web: Preppin’ Data
X: #PreppinData
Week 45: SuperBytes Stock
Makeover Monday
Create business dashboards using provided data sets for various industries and departments.
Web: Makeover Monday
X: #MakeoverMonday
Week 45: Individuals using the Internet (% of population)
Visual Climate
Collaborate and share climate data.
Web: Visual Climate
X: #VisualClimate
IMF's GHG emissions data
DataFam Con
A monthly challenge covering pop culture and fandoms.
Web: DataFam Con
X: #DataFamCon
September 2024: Live Long and Prosper with Star Trek
EduVizzers
A monthly project connecting real education data with real people.
Web: Eduvizzers
November 2024: FY25 Adopted Capital Budget Plan
Viz for Social Good
Volunteer to design data visualizations that help nonprofits harness the power of data for social change.
Web: Viz for Social Good
X: #VizforSocialGood
UN World Data Forum Bootcamp
Games Night Viz
A monthly project focusing on using data from your favorite games.
Web: Games Nights Viz
X: #GamesNightViz
September 2024: Press Start
Iron Quest
Practice data sourcing, preparation, and visualization skills in a themed monthly challenge.
Web: Iron Quest
X: #IronQuest
Iron Quest – Maps II
Storytelling with Data
Practice data visualization and storytelling skills by participating in monthly challenges and exercises.
Web: Storytelling with Data
X: #SWDChallenge
October 2024: trick (or treat) your tool
Project Health Viz
Uncover new stories by visualizing healthcare data sets provided each month.
Web: Project Health Viz
X: #ProjectHealthViz
Diversity in Data
An initiative centered around diversity, equity & awareness by visualizing provided datasets each month.
Web: Diversity in Data
X: #DiversityinData
Sports Viz Sunday
Create and share data visualizations using rich, sports-themed data sets in a monthly challenge.
Web: Sports Viz Sunday
X: #SportsVizSunday
Real World Fake Data
Create business dashboards using provided data sets for various industries and departments.
Web: Real World Fake Data
X: #RWFD
2024 - Admin Insights
Data Plus Music
A monthly project visualizing the data behind the music we love!
Web: Data Plus Music
X: #DataPlusMusic
Historias relacionadas
Suscribirse a nuestro blog
Obtenga las últimas actualizaciones de Tableau en su bandeja de entrada.


