How Visual Data Can Improve Performance Management in Government
Visual analytics is transforming the way government leaders make critical decisions, meet their mission goals, and interact with the public. New trends in measuring performance management promise opportunity for growth, sustainability, and efficiency. Here are four ways in which government agencies can use visual analytics to improve performance management.
 Tableau Public
U.S. Public Sector Veterans Day Viz Challenge Results
Brian Koslosky 22 Noviembre, 2021
 Social Impact
Enabling schools to manage COVID-19 using data-driven analysis
This blog takes a look at two stakeholder groups: students and their families, and teachers and administrators. In each case, we'll see examples of how people are using data to overcome barriers imposed by the pandemic.
 COVID-19
What we can learn from the public sector’s response to COVID-19
 Steven J. Spano
21 Mayo, 2020
A broad consensus is that COVID-19 will drive digital transformation in the public sector. During the 2020 Government Summit, speakers from Veteran Health Administration, Southwest Texas Regional Advisory Council, and FEMA discuss new processes, new technologies and innovations, and most importantly, a new mindset on decision making in the midst of crisis.
 Tableau Blueprint
Better Government with Data Analytics: Plotting the way forward with Tableau Blueprint
 Anthony Young
29 Enero, 2020
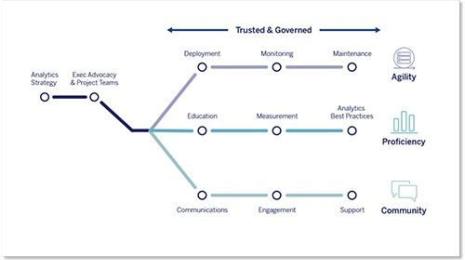
Welcome to Part Four of our four-part blog series, Better Government with Data Analytics. So far, we have shared thoughts and strategies with you, as you begin or resume an analytical journey at your organization. Conveniently, Tableau created a framework to enable that journey. The framework is Tableau Blueprint, and you can use it to build a roadmap to success.

Better Government with Data Analytics: Analytics is a team sport
 Anthony Young
22 Enero, 2020
Welcome to Part Three of our four-part blog series, Better Government with Data Analytics. In this blog, we’re going to take a closer look at how adopting a thoughtful approach to data analytics leads to success.

Better Government with Data Analytics: Three ways to build data literacy in your organization
 Anthony Young
15 Enero, 2020
We're sharing part two of our four-part blog series, Better Government with Data Analytics. Dive deeper in part two as we share three focus areas to help you drive a higher level of data literacy.

How data is enabling a new era of government innovation
 Steven J. Spano
29 Marzo, 2019
Learn how a more collaborative approach to data can drive greater innovations in government programs and services.
