Data Literacy Basics Everyone Should Know


We’ve all been there: You’re talking with a friend, watching the news, or sitting in a meeting and the conversation turns to data. You’re not quite sure how to read it, or what to make of it, no one wants to admit that. At Tableau, we believe that everyone needs some level of data literacy, and the best place to start is with the basics.
First, let’s talk about what data literacy means. Data Literacy is the range of capabilities that describe someone’s ability to explore, understand, and communicate with data. Basically, there is a wide range of ability levels that are all “data literate” but a marketer will need less than a data scientist, but may need more than a graphic designer. All three would still be “data literate” even though their needs vary.
With that in mind, the four concepts below are a great way to kick off your journey to data literacy.
1. Be Curious, and Ask Questions about the Data
We are constantly bombarded with information all meant to help us navigate life, but without digging in we’re not always getting the full picture. Curiosity and questions are how we dig in, and good questions help us validate, and understand what we read, and see.
I think of this every time something new sparks my interest, or someone recommends a new trail to hike, or social media tells me about some new supplement that will change my life for the better. Curiosity and questions help me discover new things, prevent me from ending up in over my head, or from taking something that isn’t right for me.

View of trail details in a hiking app showing length, elevation gain, and estimated hiking time as well as where in the hike the elevation gain happens.
A good place to start when interpreting data and information is with open-ended questions: think of what, when, where, why, and how. In the hiking example above, if I wanted to see if the hike was right for me, I could ask: How long is the trail? What type of terrain does the trail have? If I was trying to figure out what was causing a problem, I’d use the 5 whys technique developed by Toyota Motors founder Sakichi Toyoda. Questions like these give me the information I need to make the best decision in the situation.
The questions will change depending on what you’re trying to learn, but the benefits you’ll get from being curious and asking questions will always be worth your time.
Last, while you’re exploring data, it’s not out-of-the-ordinary to find something different than your original belief. If you’re seeking truth, it’s important to be ready to accept what you find and use the new information to guide your path forward.
If you’d like to learn more about asking good questions, check out our free Explore Data by Asking Good Questions unit on Trailhead.
2. Speak the Lingo of Data
Whether it’s a sport, a different generation, or an area of interest, each group has its own specific words that make it easier for the people to relate to each other with. Without knowing the lingo, miscommunications happen and can have serious results. I remember the first time my brother-in-law helped me back a trailer into a tight spot. His hand motions were different from the ones I knew which got us into trouble. Before we did anything else, we had to agree on what each hand motion meant to prevent a potentially dangerous situation. It’s no different with data, and can have a huge effect on the decisions we make.
We won’t cover all data terms here, but we chose these first two because of how important they are in helping you make the most of your data.
The first word is Population. It sounds like we’re talking about the number of people in an area, but it really just means the collection of things you are trying to learn about. We bring it up because understanding the information you’re exploring, or validating can have significant effects on your results, and because of that, your beliefs, and path forward.
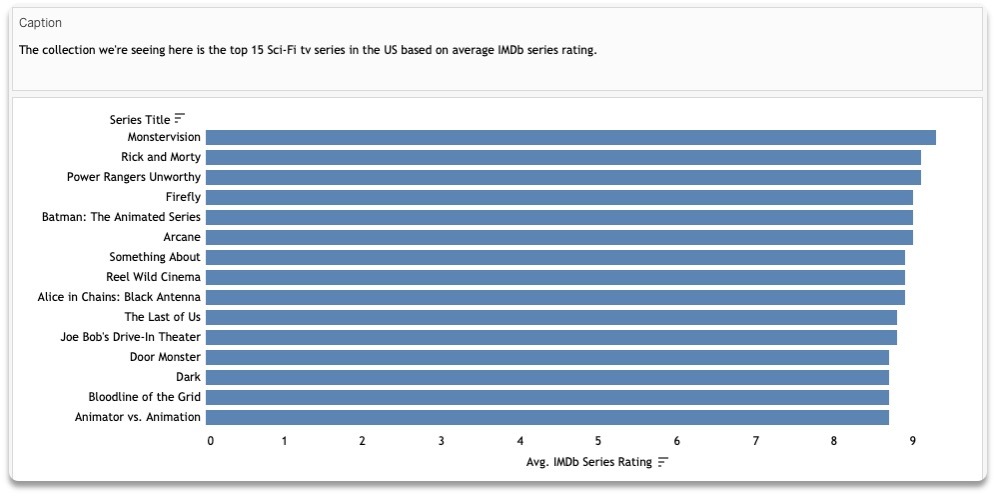
Chart showcasing a list of the top 15 Sci-Fi tv series in the US based on average IMDb series rating.
Imagine you are trying to buy a new watch band. You’re looking at reviews and see that one has 5 stars, while the other only has 4.8 stars. Your first instinct is to go with the 5 star watch band but you notice that the one with 5 stars only has 3 reviews, whereas the one with 4.8 stars has 2,500 reviews. It’s a lot harder to keep high ratings with 2,500 reviews than it is with 3 reviews which gives us more confidence in the 4.8 star rating than the 5. Knowing the size of our population in this case, changes our understanding of the data and our decision because of it.

Two very similar watchbands, both with 4.8 stars but one with only 20 reviews and the other with over 600 reviews.
The second word is Variable. This is just a way of saying a measurement, property, or characteristic of something that can vary or change. It’s important to learn now because variables are the building blocks that make up the information we’re trying to explore to guide our path.
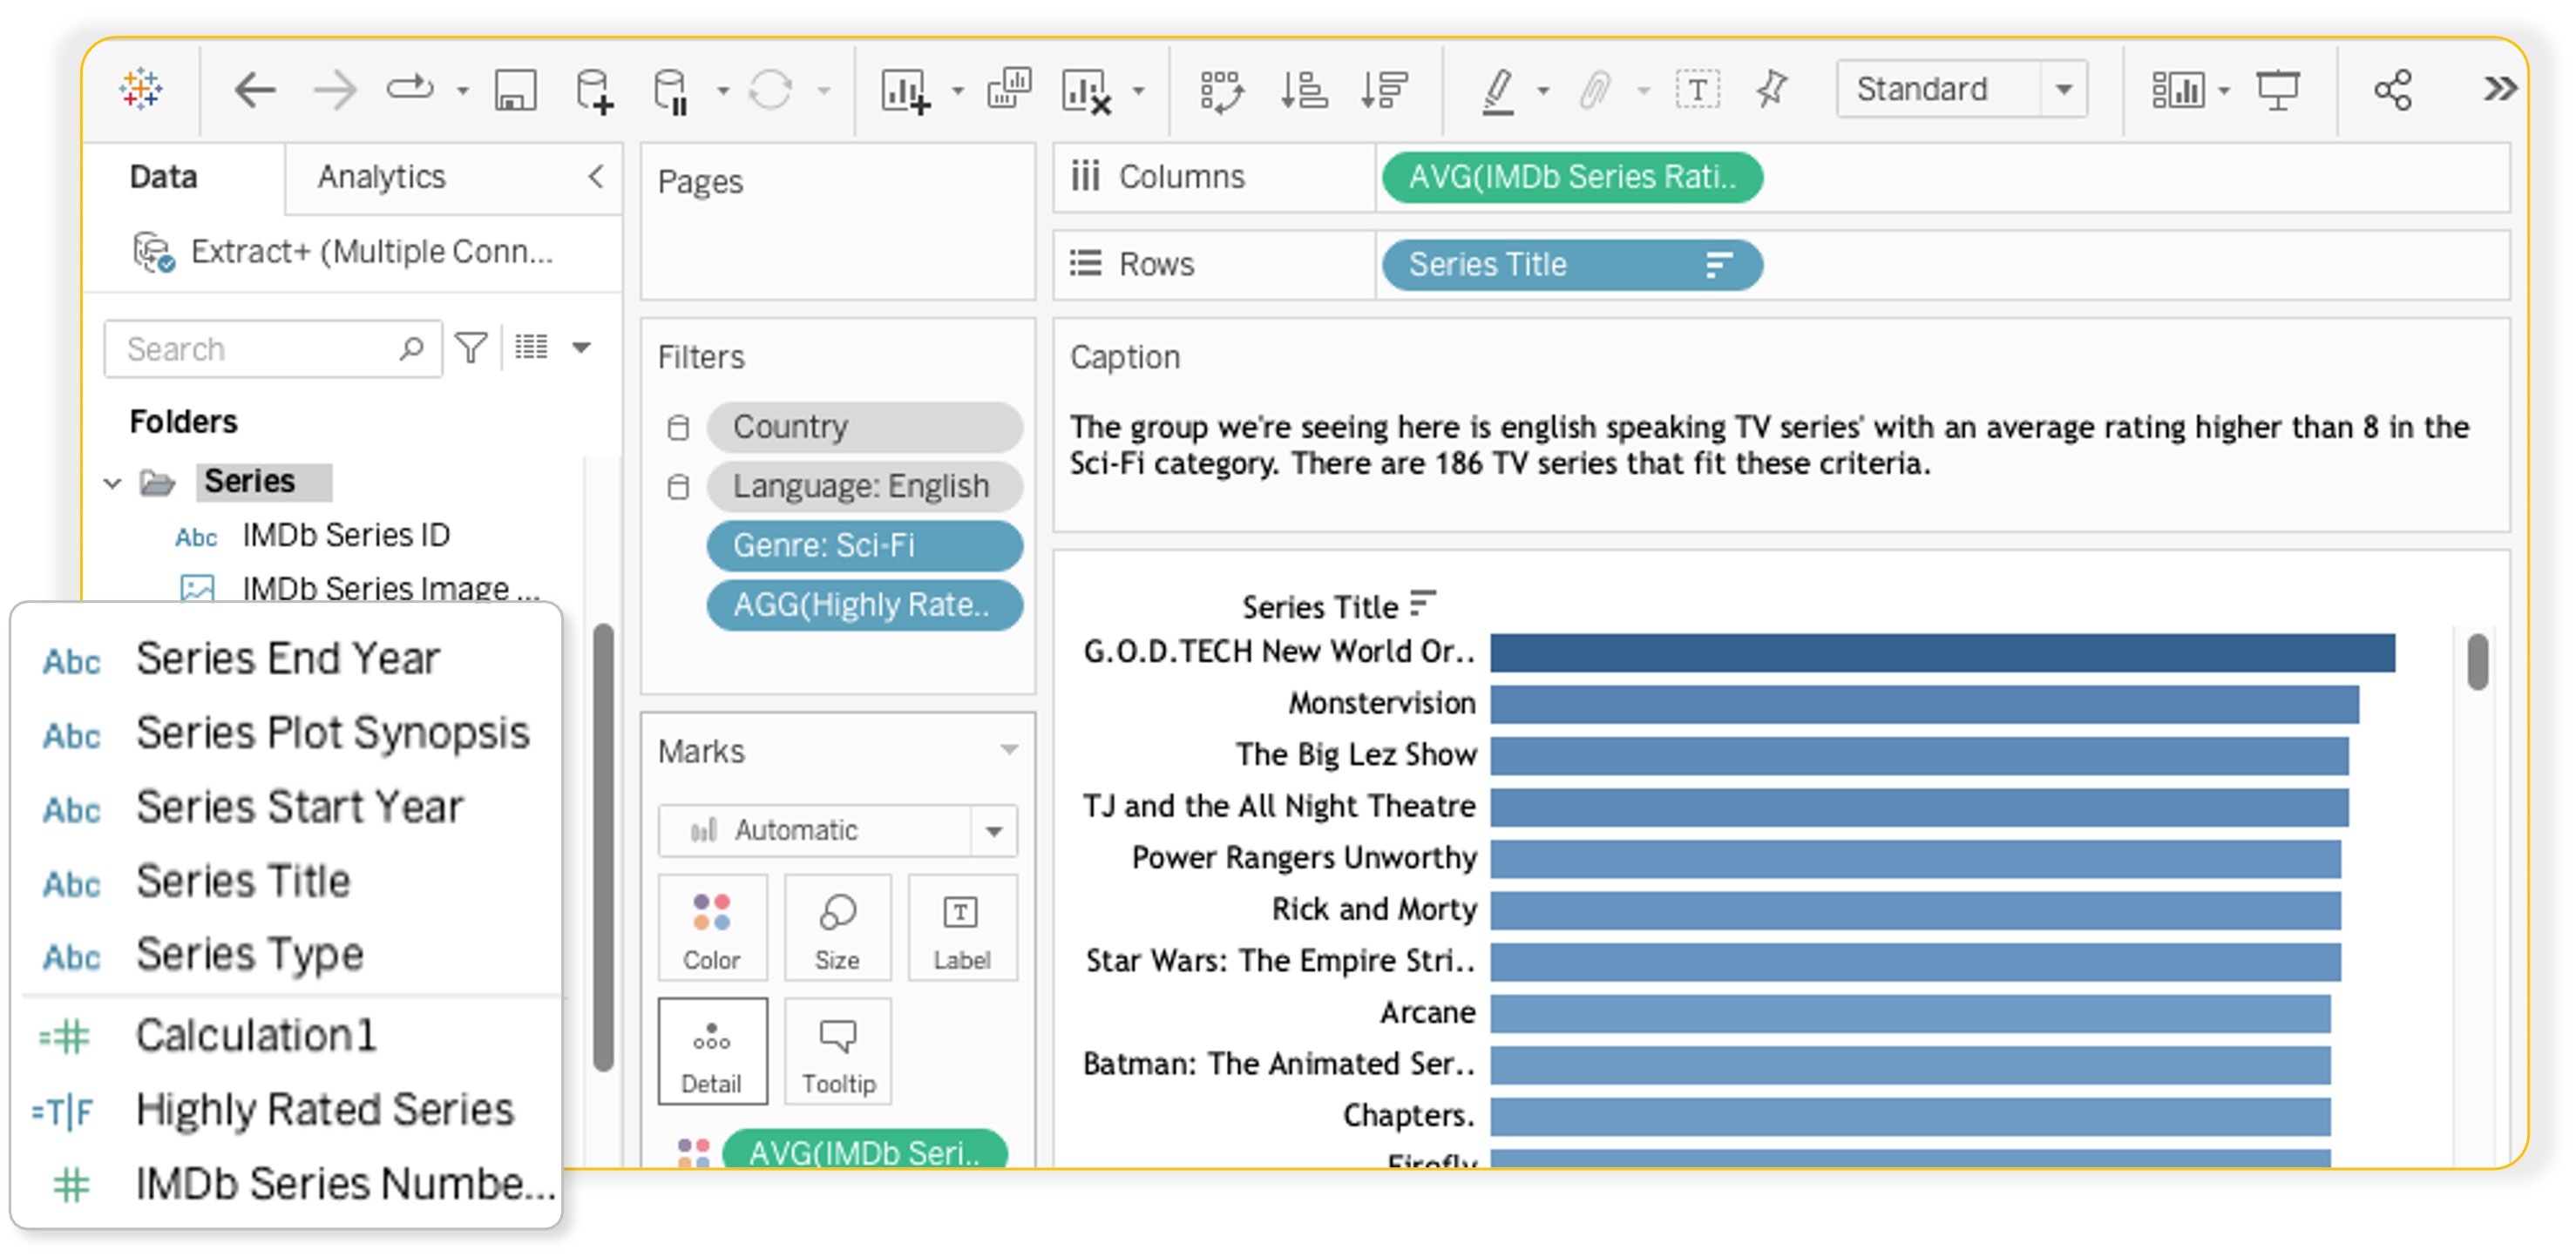 Variables in Tableau Desktop’s Data Pane. Both categories, and measurements are variables shown in this example.
Imagine you are trying to decide on a vacation location. There are lots of factors that could affect your decision but to keep it easy you pick a few that matter most. You want somewhere hot, with lots of food options, and minimal traffic. Keeping that in mind, you compare temperature, number of restaurants, and traffic ratings in your search. Each of those is a variable that changes by city giving you the specifics you need to make your decision.
If you’d like to learn more about variables, check out our free Learn Data Fundamentals unit on Trailhead.
3. What is Data and How is it Collected?
When I hear the word data, I imagine images of spreadsheets, complex code and challenging math. The truth of the matter though is that data is nothing more than information that’s been collected to better understand something. Whether you are collecting data in the near future or not, it’s helpful to understand how data comes to be, and some of the ways it’s collected which largely depends on the situation, and what you are trying to learn.
Not too long ago, I had my vehicle serviced at the dealer, and within a day of service, I received a text message asking me to fill out a survey giving them feedback on my experience. What this tells me is that the dealer is looking for data that’ll help them improve the experience, and they’re using a text survey because they want to make it easy for me which increases the odds of the survey getting filled out.
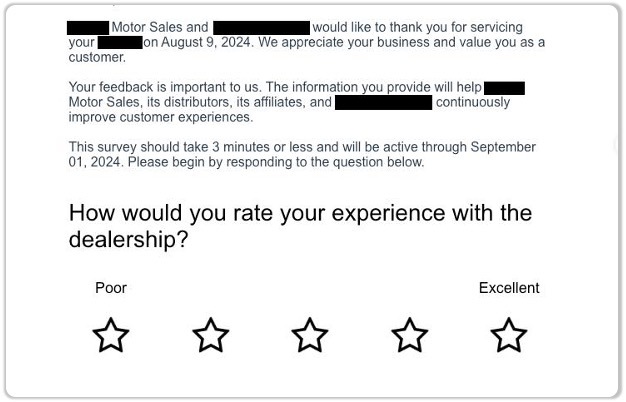
Overall experience survey prompt from a car dealer after servicing a vehicle.
There are a variety of ways to collect data including questionnaires, interviews, observations (think troubleshooting), web scraping (i.e. activity tracking online or in apps), machine measurements and more. Each method is used because it’s the best fit for the situation giving the most helpful feedback. As complicated as that may sound, it’s no different than choosing to use verbal data collection: i.e. asking your friends’ opinions on something, rather than sending them a survey. If they’re all with you it just makes more sense in the moment.
If you’d like to learn more about data collection, check out our free Learn Data Fundamentals unit on Trailhead.
4. Know Where Data is Stored
We now know that data is just information, but that information still has to have a home. Think of the last time you were on a video conference at work and you were given next steps in a project. How did you make sure you didn’t forget them? I’d wager that the majority of the population would need to write this down to make sure no steps were forgotten and that information probably went into a to-do list, or a notes app.
Similarly when data is collected like we just discussed in the last section, it has to get stored somewhere. Because of the amount of data being collected these days there are lots of options, and it’s important to understand them because it changes how you can get to, and use the information to answer questions.
Some of the more common places you’ll hear of are 1. Spreadsheets: think Google Sheets, or Excel, 2. Apps on our mobile devices: Notes, fitness apps etc…, 3. Databases: Think, organized digital storage that houses many spreadsheets or “tables”. These can be systems at your location, called “On Premise”, or they can be located offsite “In the Cloud”.
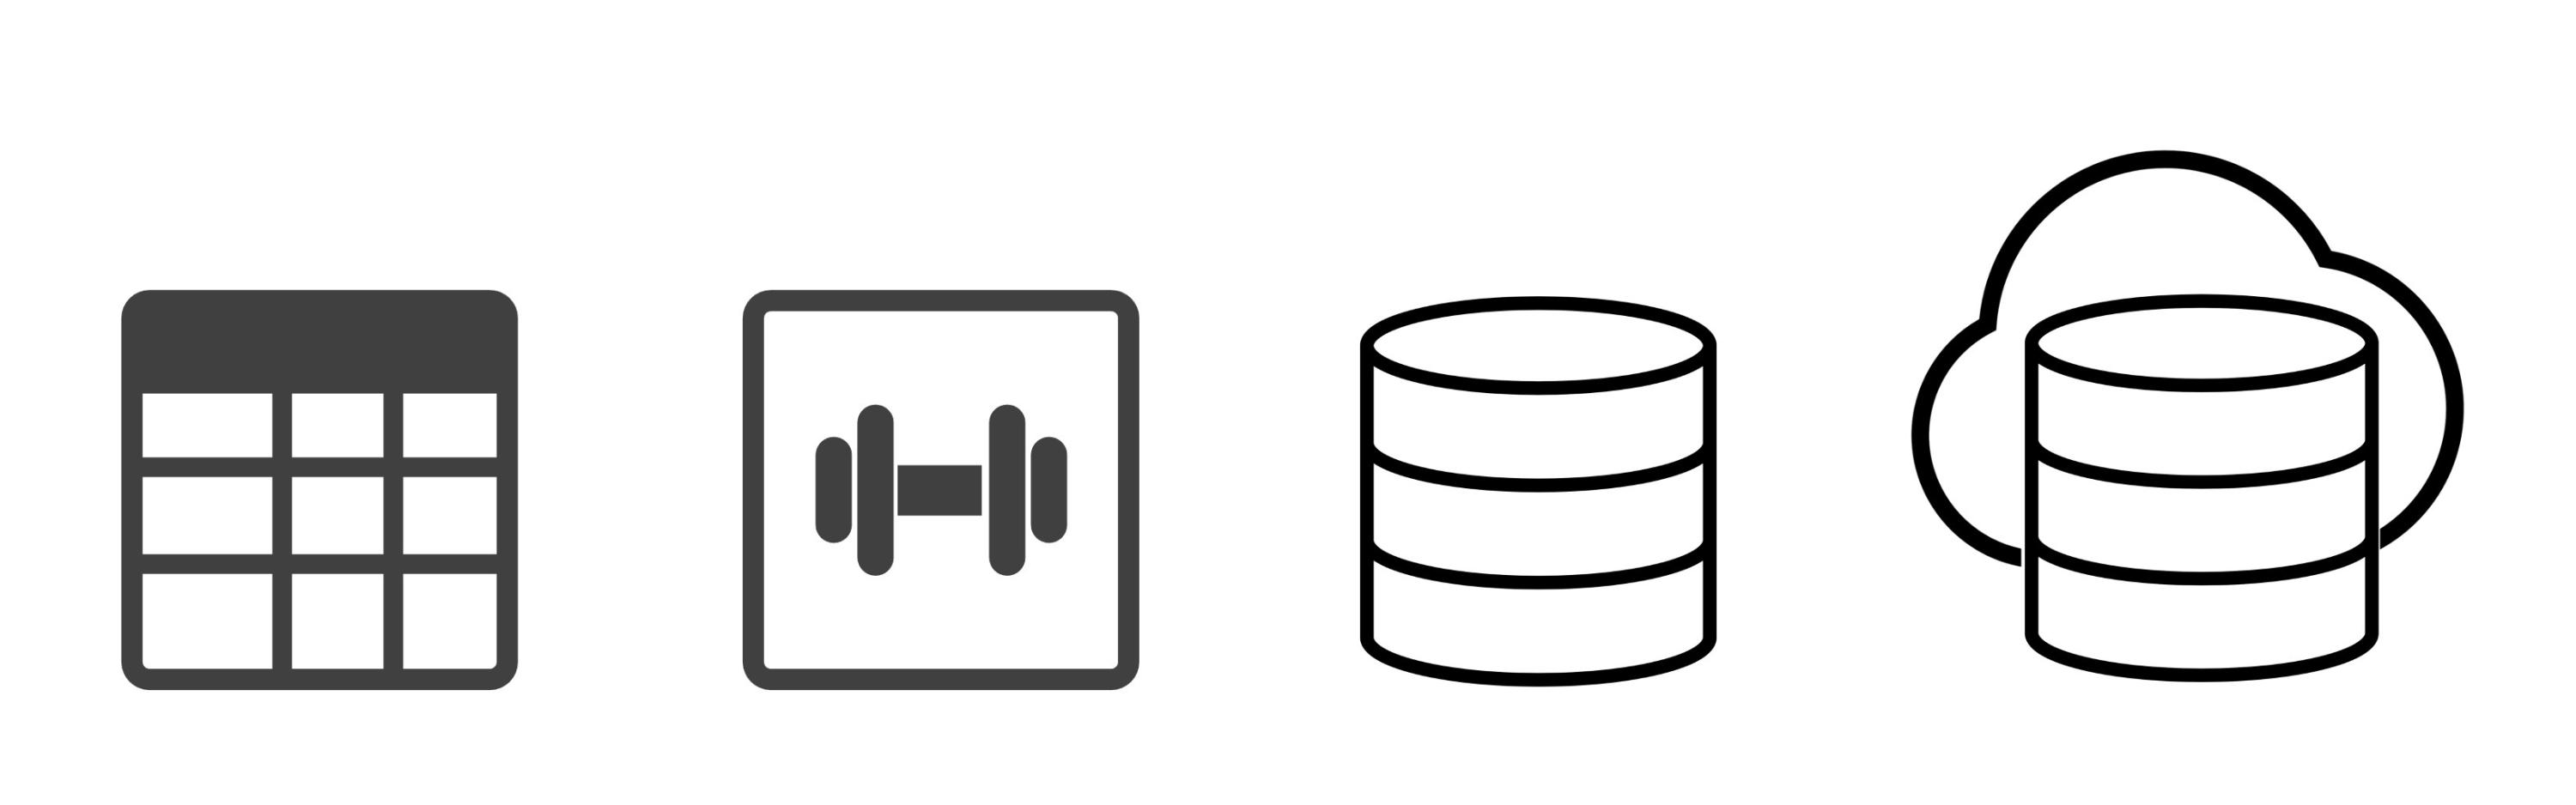 Data is stored in many places including (from right to left) spreadsheets, mobile apps, databases, and in the cloud.
Each type is also accessed in different ways. This is by no means an exhaustive explanation, but spreadsheet data is typically opened and we work directly with the data meaning our changes alter the actual data. When we are working with data in a database, we are typically “querying” the data which is a fancy way of saying that we are asking questions of the data and viewing the results in some sort of analytics program. This prevents us from altering the actual data, and allows us to ask our questions in a variety of ways without worrying about messing up the data that we’ve collected.
If you’d like to learn more about where data is stored, check out our free Learn Data Fundamentals unit on Trailhead.
Now you know your data literacy basics—dive deeper with Trailhead
These four concepts are a great starting point in your journey toward data literacy, however if you’d like to continue on and learn more, we’d encourage you to spend some time working through our Build Your Data Literacy trail in Trailhead.
Historias relacionadas

Learn the Basics of Well-Structured Data
 6 Diciembre, 2024

How To Spot Misleading Charts: Review the Message
 24 Octubre, 2024

How To Spot Misleading Charts: Check the Axes
17 Octubre, 2024
Suscribirse a nuestro blog
Obtenga las últimas actualizaciones de Tableau en su bandeja de entrada.