Todas las historias de
Paginación
Suscribirse a nuestro blog
Obtenga las últimas actualizaciones de Tableau en su bandeja de entrada.

 Geraldine Zanolli
1 Octubre, 2019
Tableau Developer Sprint Demos are monthly meetings for you to hear what we have been working on, see what is coming next, and give feedback directly to our engineering team. Read on to discover the exciting developments heading your way.

 Angie Sullivan
19 Junio, 2019

 Madeleine Corneli
3 Junio, 2019
In partnership with Snowflake, we built the Accelerated Analytics Quick Start with Tableau and Snowflake on the AWS Cloud to solve for this by streamlining the process of deploying and configuring Tableau Server and Snowflake.

 Scott Smith
24 Mayo, 2019
Tableau and Snowflake have developed dashboards to help IT monitor account usage and maximize your cloud investment, including: compute and storage costs, utilization, user adoption, performance monitoring, and more.

 Audrey Strohm
13 Mayo, 2019
Data can help your organization tell stories that no one else can. Using your company’s own data, you can generate truly unique, audience-ready insights. Content teams from organizations around the world are using Tableau Public to publish and share their data stories. To inspire your next great data story, we’ve rounded up some of our favorite examples of Tableau Public vizzes used for content marketing.

 Jeff Solomon
3 Mayo, 2019
In this second post, we'll discuss all the other issues that came up when it was time to bundle up and release the software—Tableau Server on Linux.

 Jeff Solomon
8 Abril, 2019
In this first post, we'll cover the timeline and the nitty gritty details of getting the code to run on Linux; the second discusses some of the design choices we made along the way.

 Steven J. Spano
29 Marzo, 2019
Learn how a more collaborative approach to data can drive greater innovations in government programs and services.

 James Baker
11 Marzo, 2019
Tableau developers are sharing their code branching journey—from one to many to one.

 Madeleine Corneli
1 Marzo, 2019
Want to optimize your AWS cloud spend? We created a simple workflow to track cost and usage in Tableau.

 Jacob Olsufka
26 Febrero, 2019

 Vidya Setlur
25 Febrero, 2019
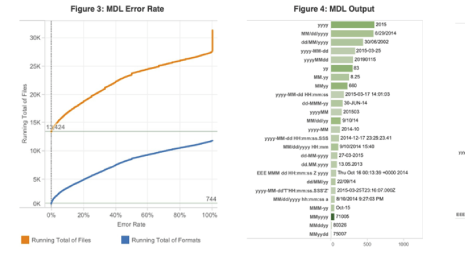
Tableau Research is the industrial research team at Tableau and they've begun a technical note system to provide context around their research exploration. Learn about how the Research team applied two techniques to approach the complex problem of parsing dates and their various formats. One technique focused on pattern recognition while the other focused on natural language grammar rules.
Obtenga las últimas actualizaciones de Tableau en su bandeja de entrada.