
Gantt charts template
Try Tableau for free See it in action
Full-version trial. No credit card required.
Tableau’s Gantt charts are perfect for managing project timelines and understanding data about events or activities.
Immediate updates
Understand your project’s full schedule at a glance, and use tooltips to get specific details like owner, status, links and priority.
Better visibility
Spot the gaps in your timeline that allow you to optimise resources, and see how your Gantt chart complements related business data – all in a single, interactive dashboard.
Infinitely customisable
Import and combine project data from any source, and quickly build the view best suited to your project management needs.
Team sharing
Publish your Gantt chart with a few clicks to share it live with the rest of your team. In the browser, on any device or in Tableau Desktop, everyone will stay up to date.
Full-version trial. No credit card required.
Build a Tableau Gantt chart
Step 1: Connect to data.
Connecting to data in Tableau is as easy as a drag and drop.
Step 2: Build your view.
Create your Gantt chart with the information that’s best for your team. Customise colours, date ranges, project names and more.
Step 3: Publish to the web.
Publish your Gantt chart to the web for others to explore. You can set permissions and organise your work online easily.
Step 4: Share with colleagues.
Your interactive Gantt chart gives the whole team access to the project details they need, available in any browser on any device.
Explore this embedded Gantt chart
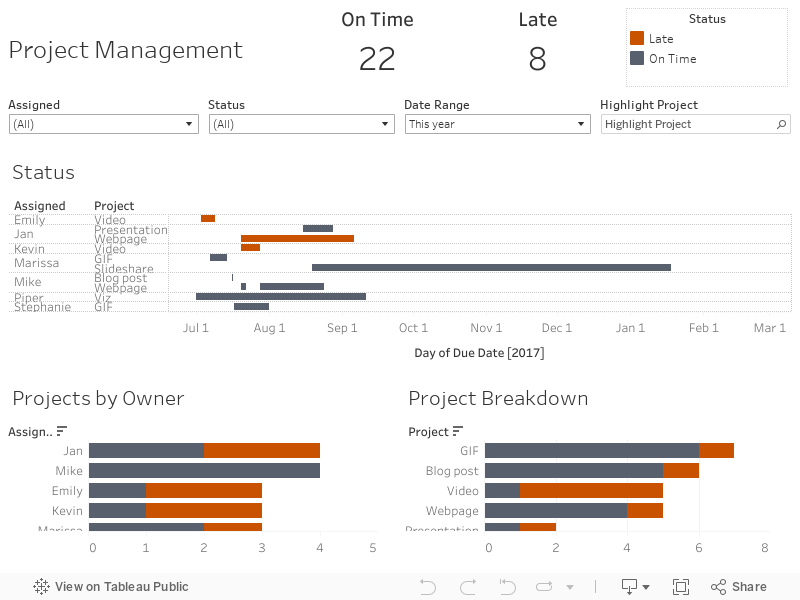

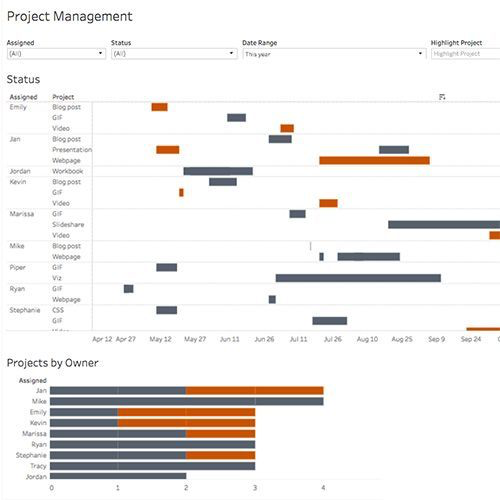
Tableau is one of the best tools out there for creating really powerful and insightful visuals. We’re using it for analytics that require great data visuals to help us tell the stories we’re trying to tell to our executive management team.