Tableau 2023.1
Accelerator Data Mapping, Tableau for Slack enhancements and more
Accelerator Data Mapping
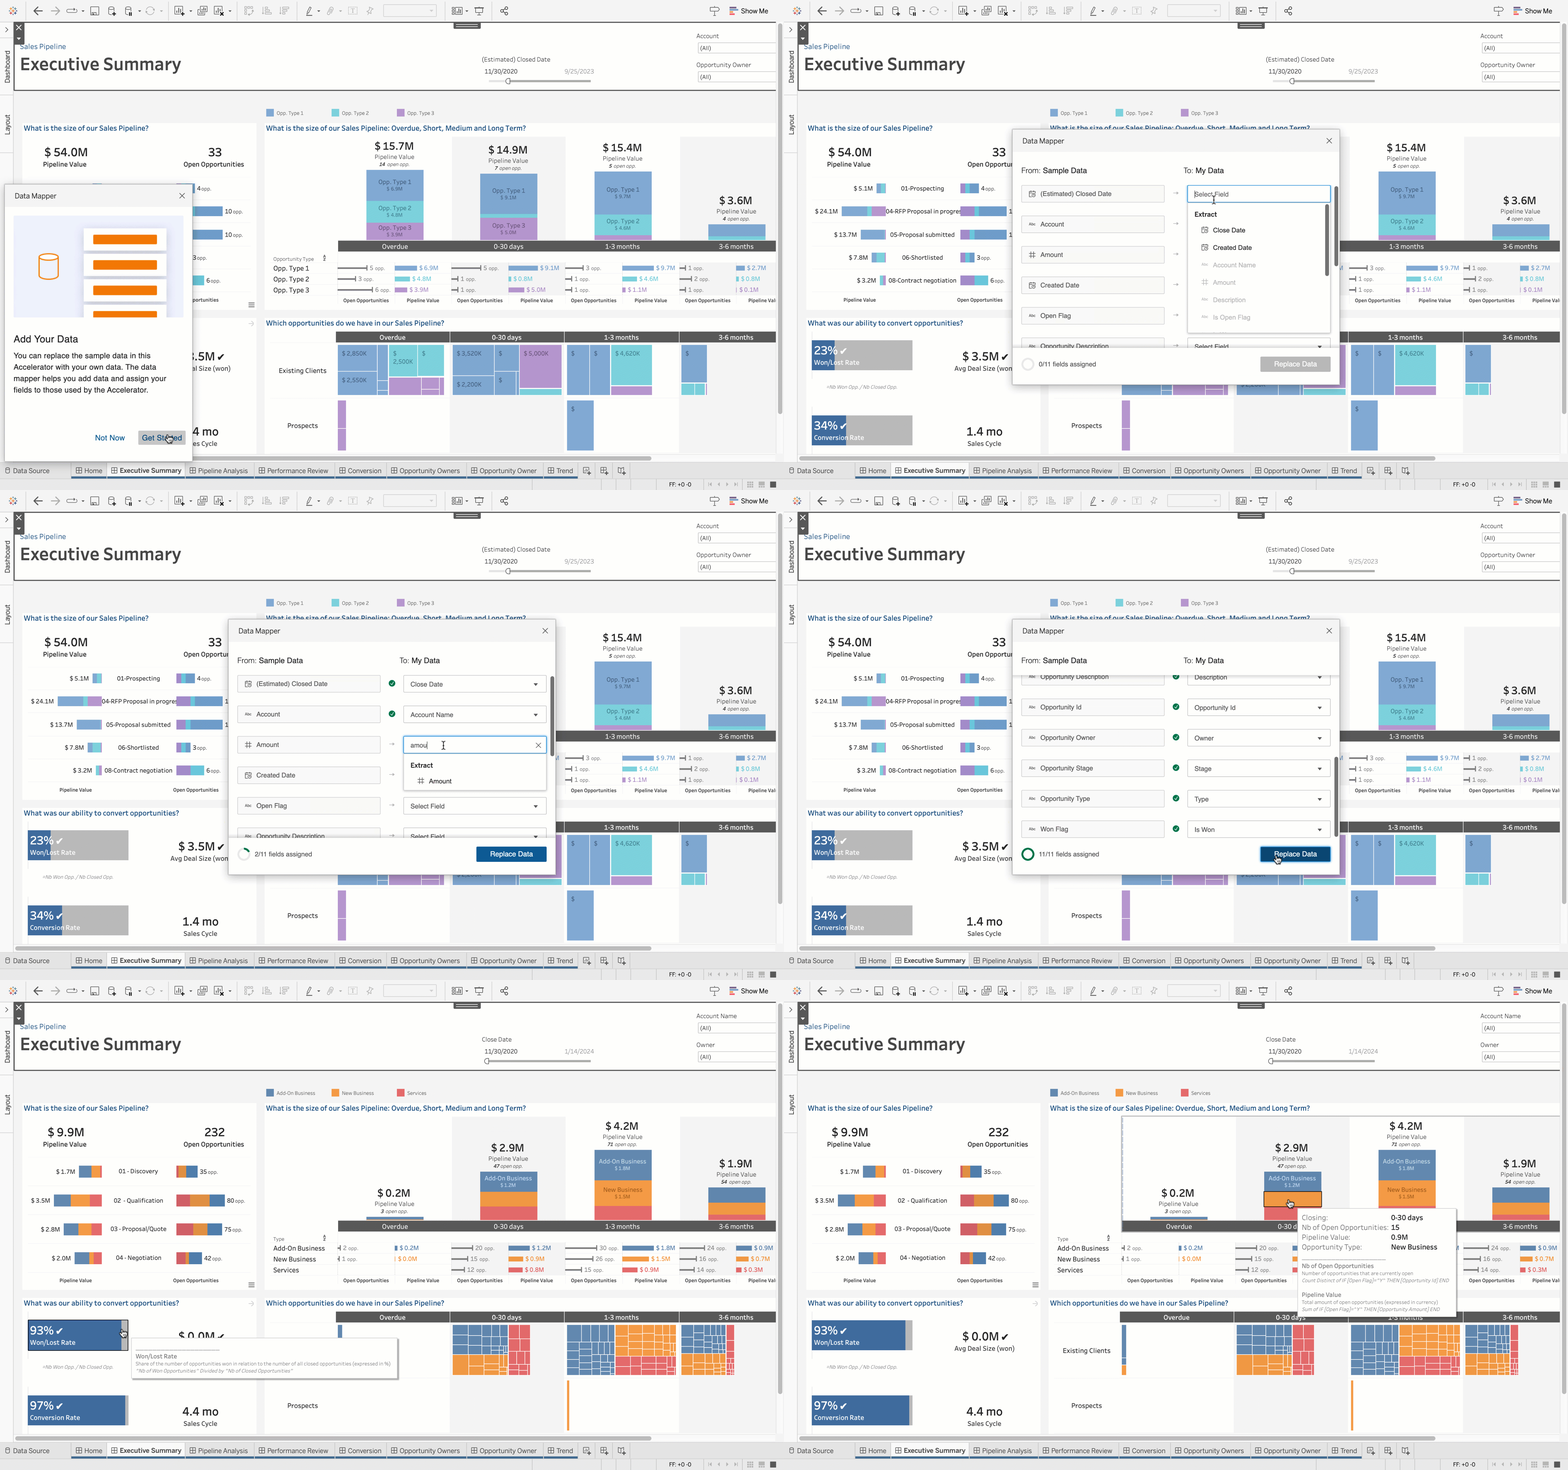
With Data Mapping, you can jump-start your analytics even faster by reducing the time and effort required to set up an Accelerator’s ready-to-use dashboards. Now, when configuring an Accelerator, the Data Mapper allows users to pull outside data into the Accelerator and map fields from their data source into the fields the Accelerator expects. This will be made possible via the Data Mapping UI – a hybrid dialogue box that opens by default with any Data Mapping-enabled Accelerator.

Tableau for Slack enhancements
Collaborate on insights more effectively with the Tableau app for Slack. The latest enhancements make it even easier to put data at the centre of every conversation and decision. Now, you can:
- Share Tableau content with context. Links now produce previews so your team can quickly recognise – and act on – relevant information.
- Easily search for and share Tableau content in direct messages and channels.
- Get to insights faster by conveniently accessing your recents and favourites from the app homepage.
*The Tableau for Slack enhancements will be available in the coming weeks.

Identity Pools for Tableau Server
Identity Pool will enable you to branch out of the strict single identity store limitation we have in Tableau Server. An Identity Pool is the combination of a “Source of Users”, traditionally called the Identity Store and an authentication mechanism. With this feature, you will be able to add additional pools where you can have your source of users belong to a local identity store and have them authenticate with OpenID Connect for modern authentication. This added flexibility will be particularly helpful for organisations that have a set of external users that need access to Tableau that they are not able to invite to their corporate Active Directory.
Tableau 2023.1 feature overview
Tune in to hear about the latest features from 2023 Tableau Visionary, Samuel Parsons. He will walk you through the top highlights included in this release.
Watch nowAll features

Accelerator Data Mapping
With Data Mapping you can jump start your analytics even faster by reducing the time and effort required to set up an Accelerator’s ready-to-use dashboards. Now, when configuring an Accelerator, the Data Mapper allows users to pull outside data into the Accelerator and map fields from their data source into the fields the Accelerator expects. This will be made possible via the Data Mapping UI - a hybrid dialogue box that opens by default with any Data Mapping enabled Accelerator.

Tableau for Slack enhancements
Collaborate on insights more effectively with the Tableau for Slack app. The latest enhancements make it even easier to put data at the centre of every conversation and decision. Now, you can:
- Share Tableau content with context. Links now come with previews so your team can quickly recognise – and act on – relevant information.
- Easily search for and share Tableau content in direct messages and channels.
- Get to insights faster by conveniently accessing recents and favourites from the app homepage.

Identity pools for Tableau Server
Identity pools will enable you to branch out of the strict single identity store limitation we have in Tableau Server. An identity pool is the combination of a “source of users”, traditionally called the identity store, and an authentication mechanism. With this feature, you will be able to add additional pools where you can have your source of users belong to a local identity store and have them authenticate with OpenID Connect for modern authentication. This added flexibility will be particularly helpful for organisations that have a set of external users that need access to Tableau who they are not able to invite to their corporate Active Directory.
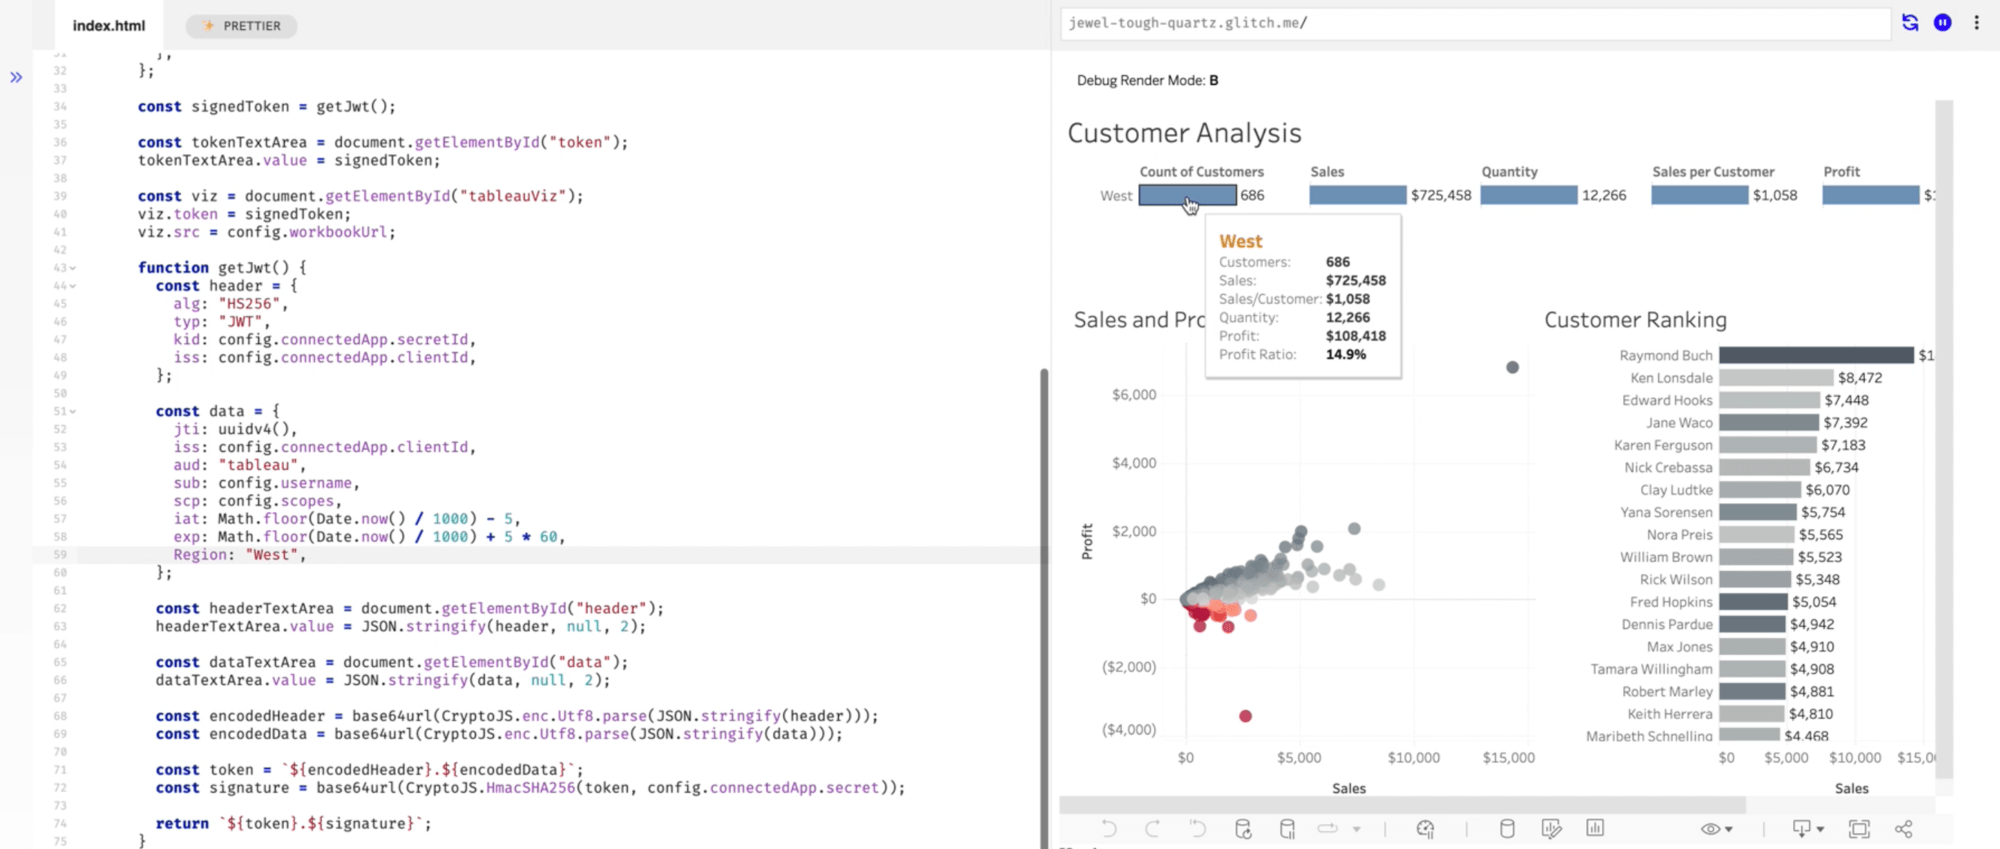
User Attribute Functions (UAFs)
User attribute functions (UAFs) are brand-new user functions – UserAttribute() and UserAttributeMatches() – that let you use users’ attributes defined during the Connected Apps login flow in calculations. These functions can be used to create data source filters for row-level security beyond username and group (for example, department, region, etc.), enabling you to tailor any user's data access in embedded scenarios.
Non-Safari browser support for mobile authentication
Admins can now specify a browser – such as Microsoft Edge – for authentication to handle conditional access checks. With the proper configurations for Tableau Mobile and your Microsoft Intune environment, admins can override the default browser used for authentication.

Tableau Prep: External Connector Gallery Integration
Partner-built data connectors through the Tableau Exchange are now available in the connect to pane in Tableau Prep Builder under “Additional Connectors.” With this addition, you can easily discover and connect to these external connectors from where you combine, shape and clean your data.

Tableau Prep input step improvements
Within Tableau Prep's input step, you can now bulk select multiple columns. This removes the need to select columns individually to hide or remove them. You can now also use a relative date filter for DateTime data types to remove stale data. These improvements combine to improve interactive performance when authoring flows and help unify the experience across Tableau Prep steps.

Hybrid mode for Virtual Connections
You no longer need to pick between a live or extract connection at the Virtual Connection level. With this feature you can now pick and choose to leverage a live or extract connection for each table within a Virtual Connection. This feature provides additional flexibility to refresh data as you see fit.
Content Migration Tool: Embedded Credential Support
When using the Content Migration Tool to migrate content from Tableau Server to Tableau Cloud, an admin can now securely migrate embed credentials for data sources. With this feature, admins will no longer have to re-enter credentials after a migration.
Resource Monitoring Tool improvements
Resource Monitoring Tool improvements include:
- Admins can now require users to log into the Resource Monitoring Tool using their network credentials rather than a separate username and password specific to the Resource Monitoring Tool. This setting can be configured on a user-by-user basis.
- You can now customise the run-as users for the RMT Server and Agent when installing on Linux operating systems. This change makes it easier to implement best practices and comply with your IT security policies.
- The Resource Monitoring Tool now supports Ubuntu 20.04 TLS.
- The Resource Monitoring Tool now supports encrypted connections to its PostreSQL database server, ensuring that all data it processes is encrypted in transit.

Source row number in Tableau Prep
You can now maintain the original sort order of Microsoft Excel or text (.csv) files by including “Source Row Number” on the input step in Tableau Prep. This is useful for identifying the original sort order of the data when there are no field(s) available that would define the sort.
Cross-database join improvements
Tableau will use our new optimisation techniques to speed up cross-database joins. Previously, both sides of a cross-database join were ingested into Hyper, which performs the join. If the tables being joined were large, network i/o can significantly impact the performance of the query. Our new optimiser avoids moving large datasets unnecessarily by executing cross-database joins locally in the database containing the larger of the two datasets being joined when we estimate that it will be faster to do so.
Admin Insights improvements
Get a complete picture of your site's job health with new data in Admin Insights. We updated the Job Performance data source to include unscheduled jobs, error messages and subscription jobs. We also updated the Site Contents data source to include a Total Size field, so your site storage usage will reflect drafts and revisions.

Permissions Admin Insights data source
With the new Permissions data source in Admin Insights you can ensure your content permissions are following best practices. Use Permissions on its own to see which users or groups were granted access to a specific piece of content or combine Permissions with other Admin Insights data sources to get a complete picture of all of the content that a specific user can access.

Column-level data quality warning improvements
You can now view column-level data quality warnings (DQWs) where you make decisions about data. For users using visualisations to make decisions, we've brought column DQWs to the data details pane. We've also simplified how DQWs are displayed when viewing lineage in Tableau Catalog. Creators and data stewards that use lineage for impact analysis or to discover data are presented with a summary of what warnings are applied to the asset, including upstream column warnings.

Ask Data Web Component
Using the Embedding API v3 and web components, developers can now incorporate all of Ask Data's functionality into their applications. You can now easily integrate Tableau's Natural Language Processing (NLP) capabilities into your analytical applications with just two lines of code.

Accelerator enhancements
Accelerators now provide users with an overview of their KPIs, accessible from the home page and as a tooltip in all data visualisations. Each KPI offers details of its business definition, as well as its underlying calculation. The following details are now also documented directly for each Accelerator: Business Objectives, Business Questions, Required Attributes and Related Accelerators.

Request Access dialog box
Accessing relevant content is now simpler for Tableau users thanks to the improved Request Access dialog. An easy-to-use dialog box that keeps users in their workflow is now presented to users when requesting access to a viz. In the new dialog box, users who are requesting access can also leave comments for the content owner. Additionally, content owners now have a simpler way to update permissions directly from an email request notification.

Table Extensions code editor
Develop your Table Extensions code utilising all the helpful features of an Integrated Development Environment (IDE). The Table Extensions code editor allows you to set your preferred coding language (R, Python, Javascript or plain text), offers syntax highlighting, code formatting and a command palette to your Table Extensions in Desktop, Server and Cloud. Tableau has also added visual treatment for unique Tableau keywords, such as "input tables", to give a clear understanding of how your code references your data.
Web formatting enhancements
Users can now format their rows and columns with banding to enhance table visibility. Based on the content in the viz, the shading options will display dynamically in the right-hand side formatting pane. Totals and grand totals can also be shaded. The dashboard's right-hand side pane is now active, allowing you to format text objects, worksheet titles and dashboard fonts.
Incremental Refresh enhancements
Incremental refreshes provide an economical way to keep extracts current. Now, you have more flexibility with support for incremental refreshes using non-unique key columns, such as a column for date/time. This update improves usability by expanding the number of tables eligible to use incremental refreshes.

View Acceleration recommendation service
View Acceleration helps load views faster by pre-computing underlying queries in advance on a set number of views. Tableau now provides recommendations to admins and workbook owners to ease the burden of deciding which views to accelerate and to optimise resources towards the views that will benefit most from acceleration. Slower-loading views (>2.5 sec.) and those with the most visits are ranked highest.
Offline activation improvements
Once your Tableau Server is activated, admins in offline environments can now use login-based licence management (LBLM) to activate users. The enhanced offline activation solution makes your key activations and management more efficient and scalable, as well as making your Tableau Server more portable with the ability to deploy in containers.
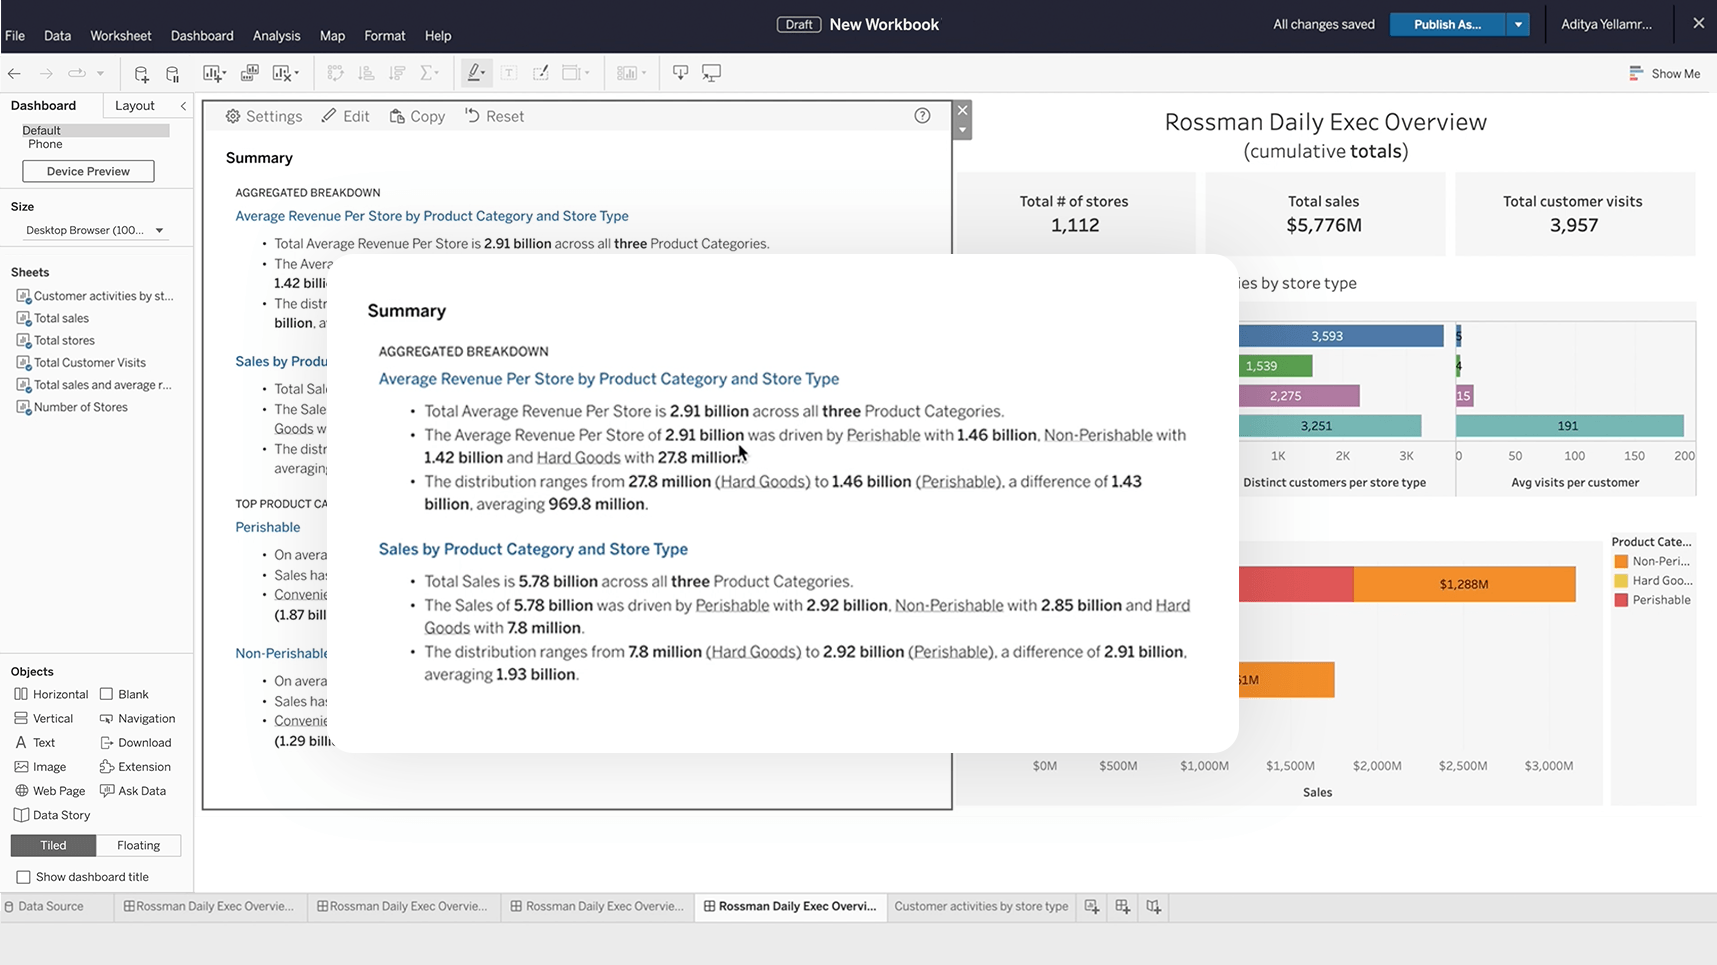
Data Stories
Help any user to confidently access, understand and communicate with data. Data Stories automate the analysis, building and communication of insights, but are fully customisable, so you can tailor the stories based on your audience. Choose which analyses are included, change the confidence interval, rename fields, apply colours to denote positive or negative changes and more.
Previously released in other Tableau products in Tableau 2022.2, this capability is now available in Tableau Server 2023.1.

Image Role
Improve insight comprehension and help end users better connect to and understand visualisations using Image Role. Image Role is a new field semantic that offers a scalable and automated way to bring image assets into Tableau. Tableau can now dynamically map images to links in your data and encode them as exportable row or column headers. This new capability makes it possible to manage image assets externally to prevent workbook sizes from becoming too large to maintain and share. More information here.
Previously released in other Tableau products in Tableau 2022.4, this capability is now available in Tableau Server 2023.1.
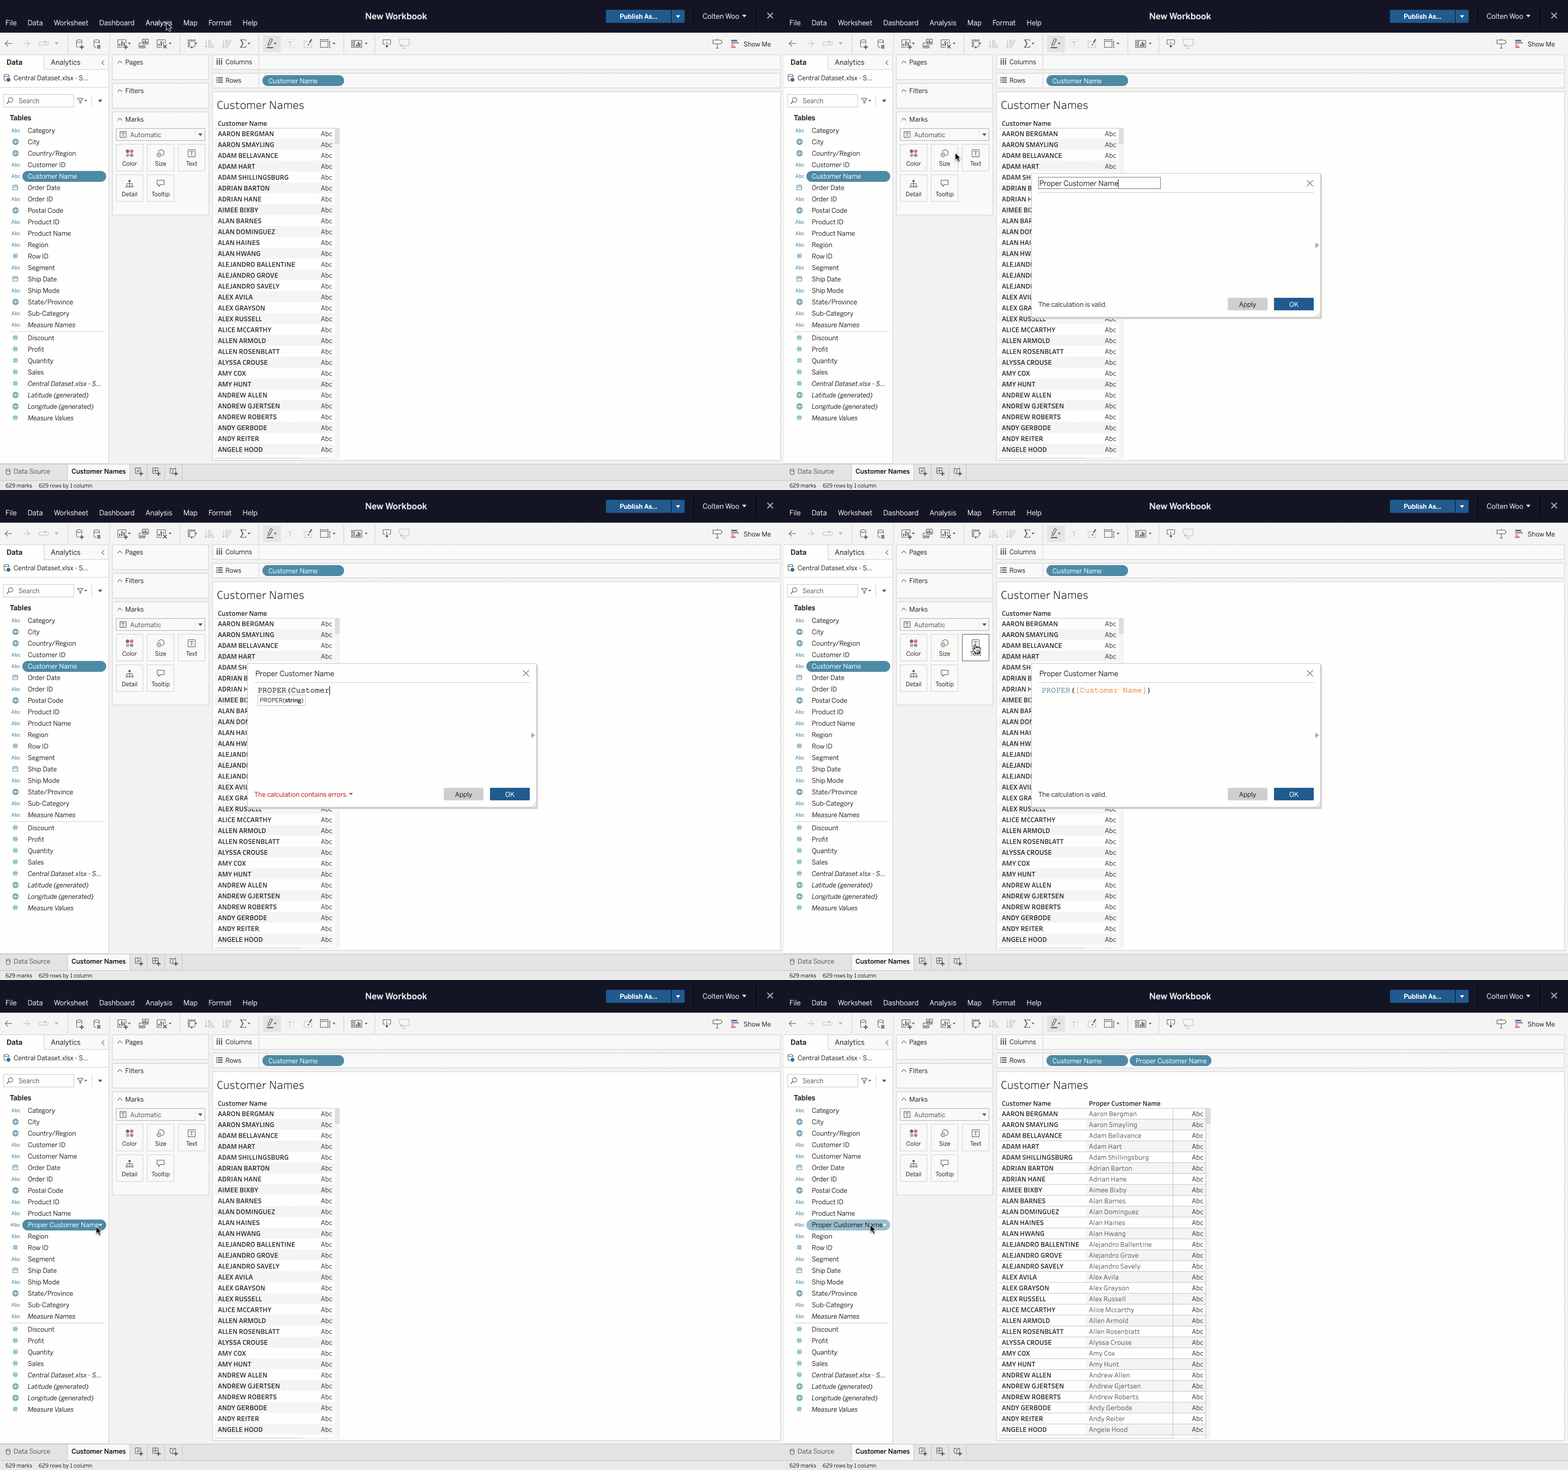
‘PROPER()’ string function
Format string fields using the ‘PROPER( )’ function instead of complex workaround calculations. This new function converts strings to proper case. The first letter of a text string and any letters following non-letter characters are capitalised, while the rest are converted to lowercase.
Previously released in other Tableau products in Tableau 2022.4, this capability is now available in Tableau Server 2023.1.
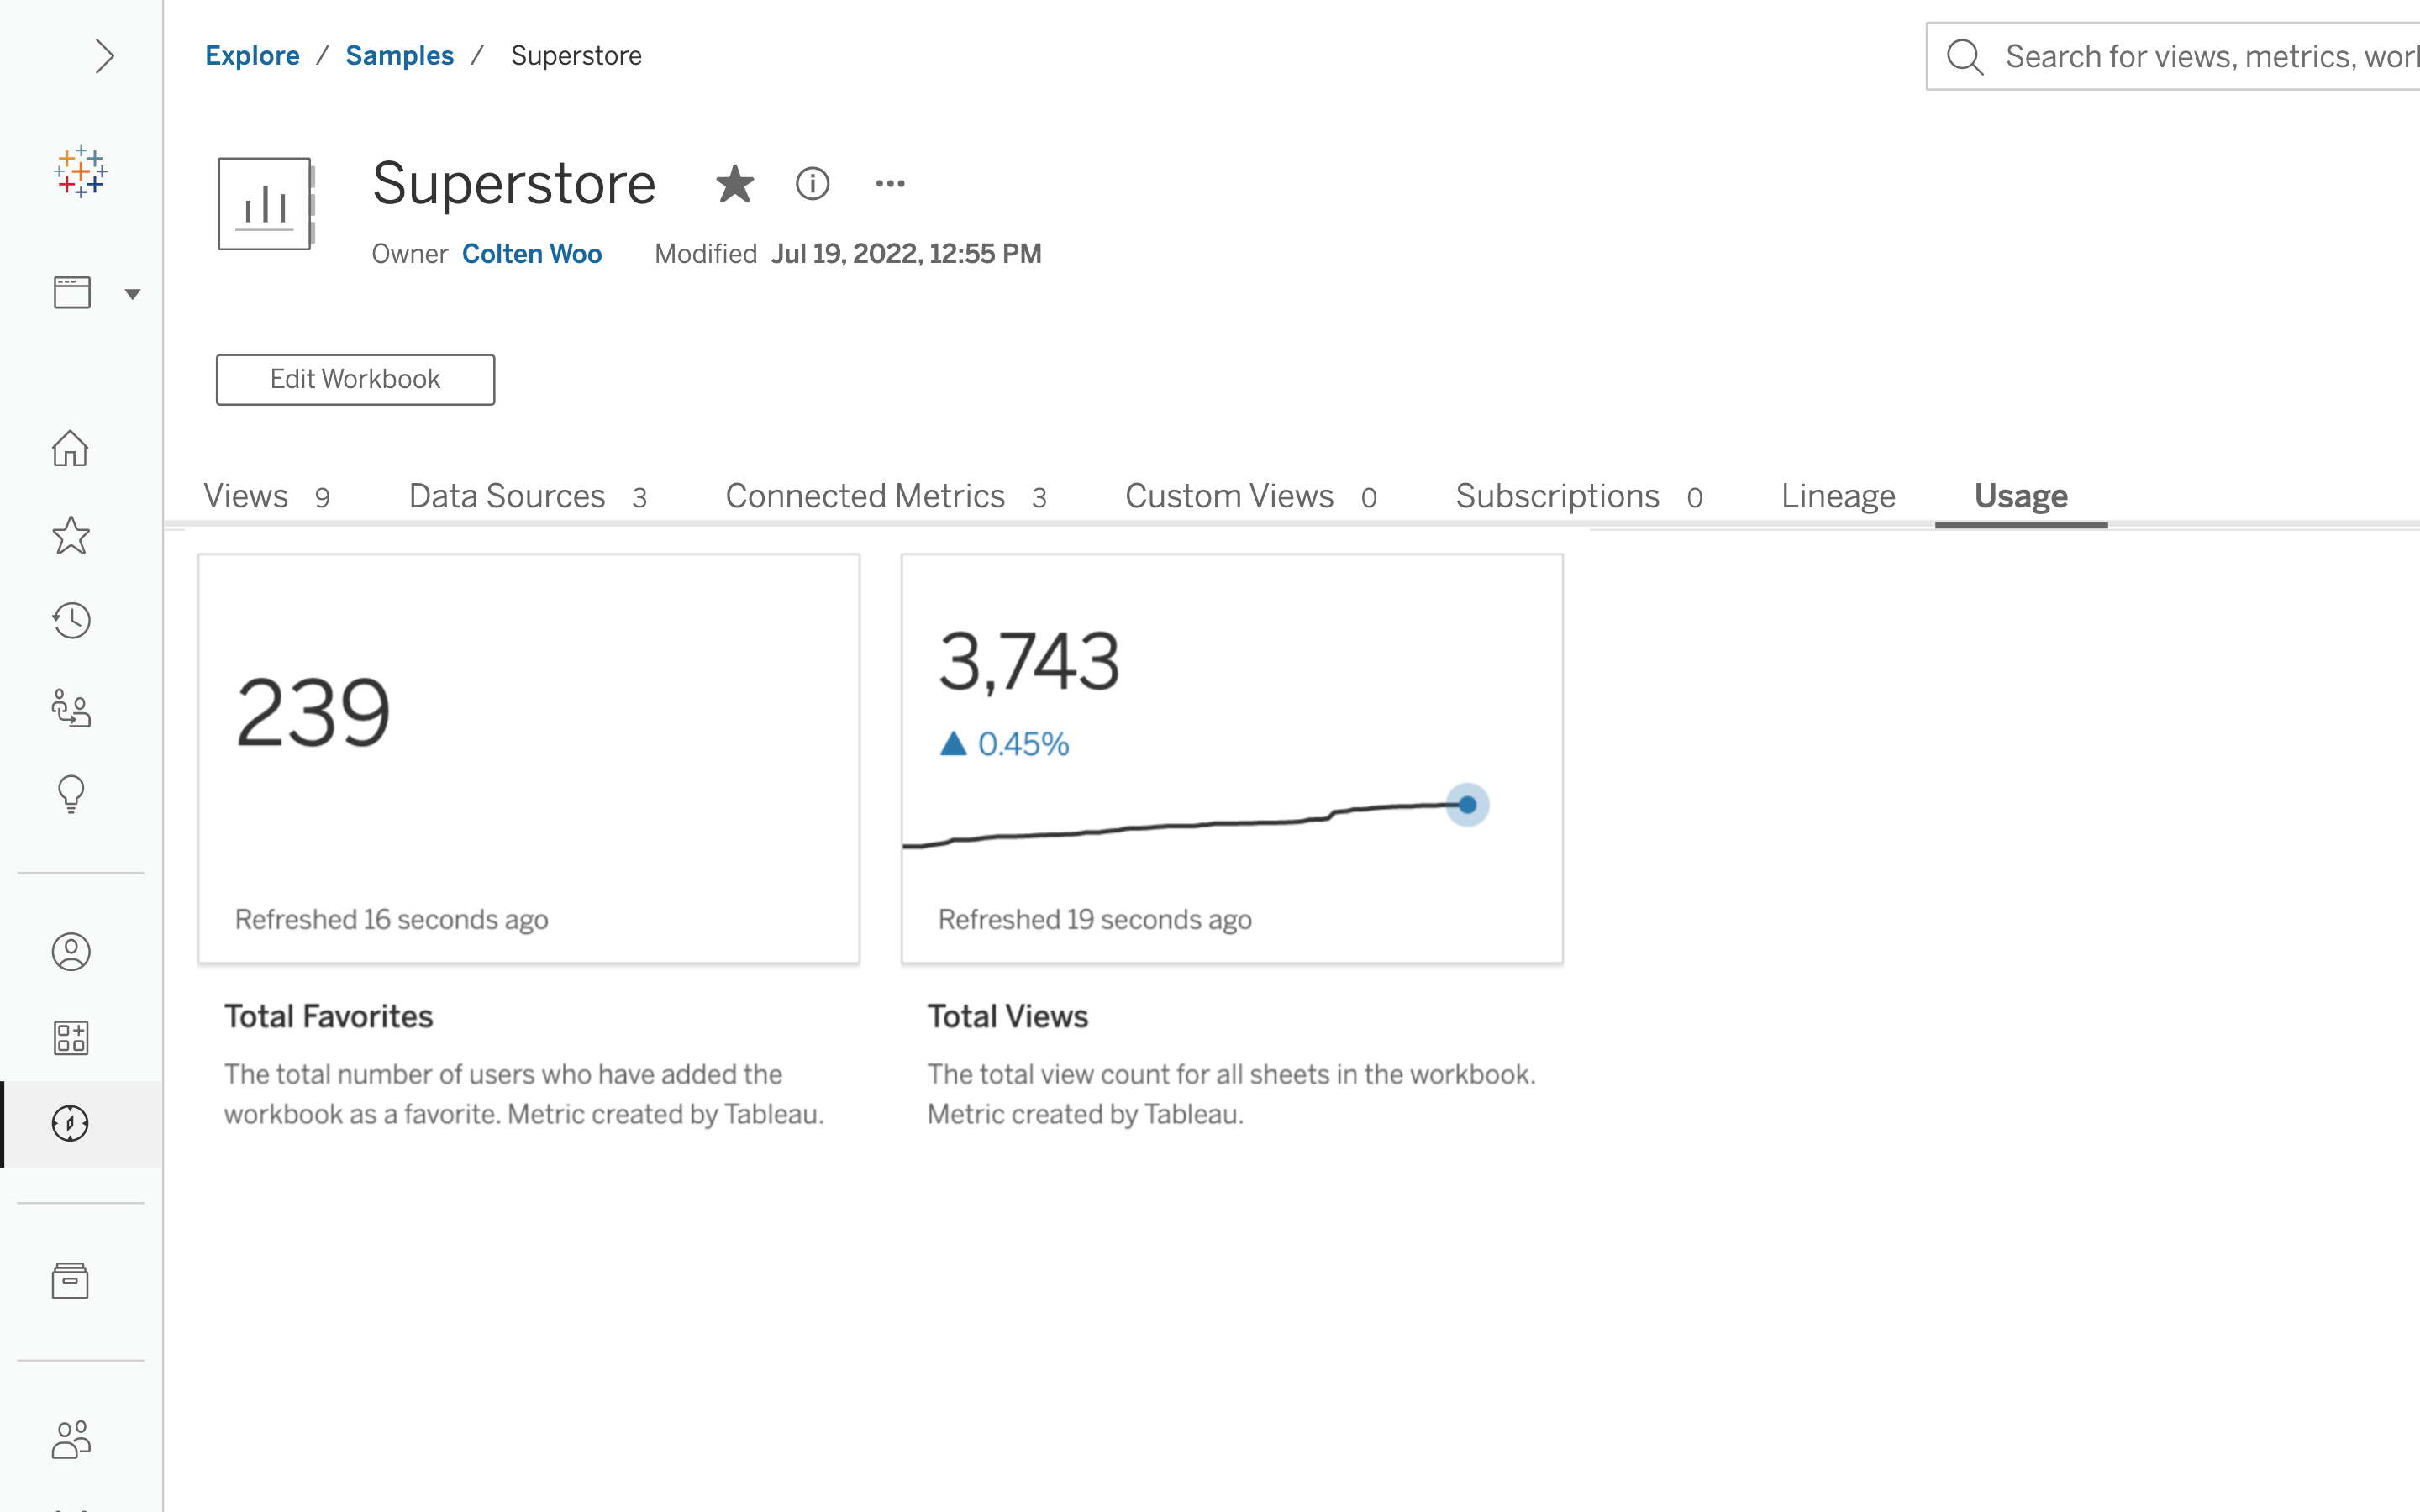
Usage Metrics
Total views and favourites are displayed as Metrics in the new Usage tab. With these insights, analysts can better understand what workbooks are popular so they can build content that resonates with their audience. Viewers can leverage Usage Metrics to validate that the content is widely used and trustworthy.
Previously released in other Tableau products in Tableau 2022.4, this capability is now available in Tableau Server 2023.1.

Workbook Optimiser enhancements
Enhancements to the Workbook Optimiser allow workbook authors to ignore individual best practices that aren’t relevant to them and implement specific best practices with a single click. The Workbook Optimiser now includes even more best practices to help authors improve workbook performance. More information here.
Previously released in other Tableau products in Tableau 2022.4, this capability is now available in Tableau Server 2023.1.

Web authoring enhancements
- Conveniently access number and date formatting, including custom number formats, from a pill.
- Visually break up sections of your table to improve understanding by applying table shading for headers, panes and cells.
- Add context and enable further exploration by hyperlinking text objects using the Rich Text Editor.
- Understand what formatting options are available. Formatting options for dividers and borders now display dynamically based on the type of visualisation and pills on the shelf.
Previously released in other Tableau products in Tableau 2022.4, these capabilities are now available in Tableau Server 2023.1.

Data blending UI upgrade
Data blending is a powerful tool for combining data sets. We've upgraded the iconography to match existing patterns and bring data blending into alignment with the overall UI design. Now linking fields are indicated with a link icon in grey, and potential linking fields appear as a slashed link. Rest assured, the functionality remains unchanged – click a slashed link to use the field for blending.
Previously released in other Tableau products in Tableau 2022.4, this capability is now available in Tableau Server 2023.1.
Learn more about Tableau releases


