Making Tables Smarter: Key Features of the Tableau Table Viz Extension
Sam Parsons is Group Analytics Cloud Lead and Senior Consultant for Tableau Partner, Biztory. Sam not only is a multi-year Visionary, he was also runner up of Tableau’s Iron Viz competition in 2021. His background is in product design and in finance and analytics, but his real passion is centered on visualization design, exploring what ‘good’ data design is and how that can encourage enablement and engagement.
The Tableau Table Viz Extension available in Tableau 2024.3, brings a much-anticipated solution for developers looking for a more flexible way to create tables.
What is the Tableau Table Viz Extension?
In a nutshell, this is a new way of creating a table in Tableau in a quicker and cleaner way than before. I will hold off saying that it is more customizable, because some formatting features that we currently rely on are not available yet. Rather, the two methods to build a table provide different customization options. The Tableau Table Viz Extension, available in Tableau 2024.3, has some rather clever features that are unique to it, which we will explore.
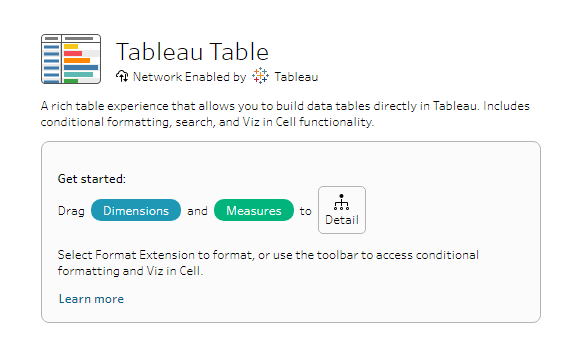
Access the Tableau Table Viz Extension via your Marks Card dropdown, and then select “Add Extension”. You can easily find the Table Viz Extension by checking the box on the left called “Built by Tableau + Salesforce”. When choosing the Viz Extension, an image is loaded into the Worksheet pane detailing how to get started building your table.
Appearances can be deceptive!
At first glance, the Table Viz Extension looks just like any other table you have seen in Tableau. On closer inspection we can see that the Table Viz Extension is built very differently. Here I have built a simple table using Sample – Superstore and you will see there are no pills placed on Rows or Column shelves, instead everything has been placed on the Marks Card on Detail.

The order in which the pills are placed on the Marks Card (vertically) determines the order in which the fields are shown as columns in the table (horizontally). Changing the order of the columns is achieved by changing the order of pills on the Marks Card.
Exciting features of the Tableau Table Viz Extension
You may be asking, “this all looks very standard and normal, but where are the extras you promised us at the start?“
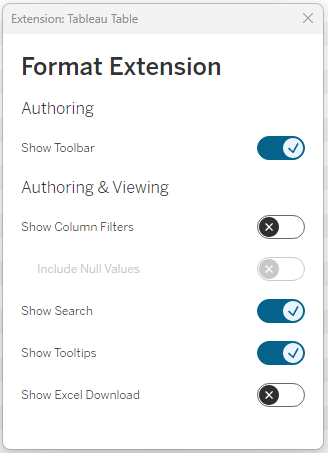
Let’s take a look at the features the Table Viz Extension offers us that cannot currently be achieved in core Tableau. In the toolbar above the table there is an icon with a paint brush, when selected opens the Table Setting menu (shown below). This contains a lot of the new features we will look at now:
- Column Filtering
By checking this option, you can bring into the table headers individual filters for each column! This makes exploring your table easier. Also, anyone sharing these tables will immediately see what has been filtered all within the table. One thing to note, these filters ONLY impact the table and will not apply to anything else on the same dashboard, and be careful if you apply normal filters to the worksheet with the Viz Extension if those filters are the same as one or more of the columns—that could become confusing for users.

- Search
Within the toolbar you have an built in search function that allows you to explore the values within the table. Typing something into the search will highlight matches found. Again, this is great to help you find those values that are key to your analysis.

- Excel Download
The Tableau Table Viz Extension comes with a help download button that can be turned on or off. When it has been made available it will appear next to the search bar in the toolbar. This gives a quick and easy way to download a copy of the table to Excel and when you use it, only the data shown in the table is downloaded – no underlying data from the source is included.
![]()
Conditional formatting
A key feature of this Viz Extension is conditional formatting. Yes, the very same thing that you find in an Excel sheet, and this works similarly. To access the conditional formatting option, you either select a column and then click the formatting icon that appears, or you can right-click on a column header and select ‘format’.
This will give you access to these column formatting options:
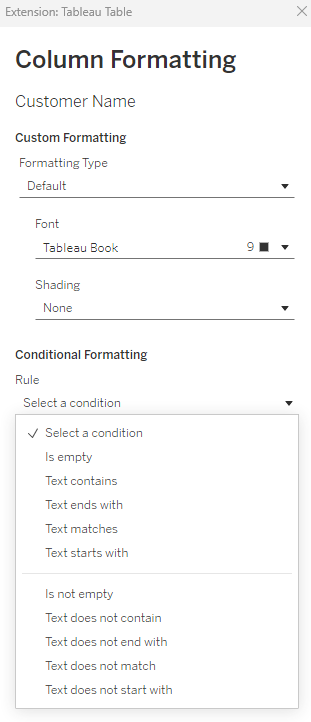
You can add multiple rules to each column, to conditionally format cells you are interested in. Whether they are text, date or numeric fields, conditional formatting is available to fill or alter the font formatting.
Here for example, are three columns that have conditional formatting applied to:
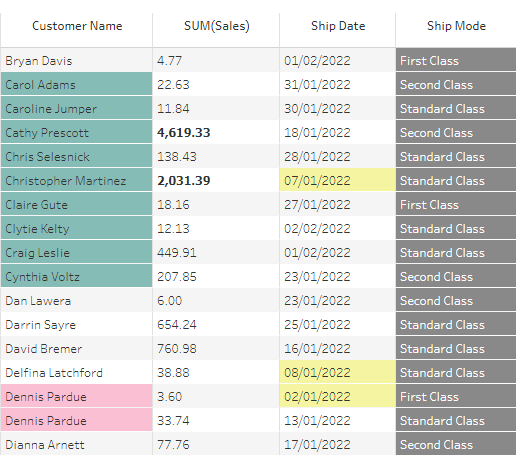
Customer Name – 2 rules: Starts with: “C” and Contains “Pardue”
SUM(Sales) – 1 rule: Greater than: 1000
Ship Date – 1 rule: Less than: 01-12-2022
Ship Mode however does not have Conditional Formatting applied to it, it is instead taking advantage of the Column Formatting and has a fill color applied to it and only that column.
This is pretty standard for Excel tables, but huge step forward for Tableau and its tables.
Formatting types
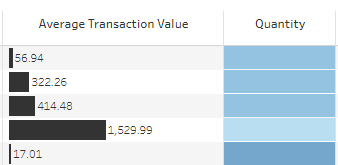
Within the Column Formatting options there is the feature called Formatting Types. Selecting the dropdown reveals two formatting options for the column:
Data Bars
Turn your data in the column into a bar chart at the click of a button, with formatting options to show or hide the labels and alter the colour of the bars.
Color Scale
Turns the column into a highlight table. You can choose your colour palette and again show or hide your labels.
More Table Viz Extension features
That’s right there is more to discuss with this Viz Extension that might not be immediately apparent.
Renaming Columns
You can now rename a column in your table without the need to rename or duplicate the original field in the data pane!
Column widths
Columns can be sized to individual widths by dragging the column edge. This even works when you take advantage of the Data Bars formatting type – something that couldn’t be easily done previously in a single table in Tableau.

Copy & Paste
You can highlight a cell or selection of cells and copy and paste that data into other applications.
Dashboard Interactivity
The Tableau Table Viz Extension also integrates with other charts on a dashboard view. You can use it to drive actions to filter other charts and visa-versa.
Best practice tips for Table Viz Extension
When using the Table Viz Extension, I try to keep these tips in mind to make sure the representation of the data is more manageable for my users:
- Keep to visual best practices—i.e. not too many colours that distract rather than focus attention. Consider what is really important.
- Don’t overdo the number of conditional formatting rules for the same reason as above.
- Avoid applying quick filters from other charts and column filters on the Table that duplicate each other—to avoid operational confusion.
- Try to keep the columns you need down to only those that will be visible. This avoids having information hidden away and the need to scroll horizontally to access the data.
- Rename your column headers if the dimensions are not succinct and clear.
- Turn off tooltips if they add no extra value that is not already shown on the table.
- Only provide the Excel Download button if you want your users to take snapshots of the table information.
Table Viz Extension use cases
As Tableau developers we still want to help our users see and understand their data through data visualization, but that doesn’t mean that with the development of the Table Viz Extension we are going against that core message, but rather we are facilitating understanding of the data for the more traditional user base. Through my career as a Tableau Consultant, I have found so often that building tables are still a common request from clients. The crux of the matter is, there are always those people that want to see the data in a format they are familiar with (tables) and those that prefer a more visual way of showing the data (charts). The Tableau Table Viz Extension is adding to that full data experience and should be seen as a method to compliment our more visual Tableau work.
Here are a few use cases for implementation:
- Supplementary tabular option to support / complement charts
- Heatmaps using conditional formatting
- Data downloads – tables set up to allow users to download specific elements of the data
- Outlier identification—outside of charting outliers, Tableau Tables make this an easy thing to achieve through the conditional formatting rules you can write
A big step in the right direction
I believe this extension is a big step in the right direction for creating tables in Tableau. There are some elements of this extension that are not yet fully formed as we would normally expect in a Tableau based product—such as text alignment in columns; everything is left-aligned and cannot be changed. Tableau is aware of these issues and will be putting through an update to this extension to flesh out the features and better support our needs. So, keep your eyes peeled, this extension is only going to get better from here on in!
Get started with the Table Viz Extension in the Tableau Exchange.
Related Stories
Subscribe to our blog
Get the latest Tableau updates in your inbox.


