DataFam Roundup: December 9-13, 2024
Welcome! Dig into this week's DataFam Roundup—a weekly blog that brings together community content all in one post. As always, we invite you to send us your content—and the DataFam content from your peers that have inspired you! Find the content submission form here.
Community Highlight
To recognize new and consistent Tableau contributors—we’re excited to have a section within the weekly DataFam Roundup called the Tableau Community Highlight. Find out how to get involved.

Sadia Ahmed, Data Visualization Expert
Dubai, United Arab Emirates
Sadia Ahmed is a Data Visualization Expert. She first found Tableau Public in 2021 and was intrigued with the talent she saw in the vizzes published. In parallel, Sadia was also looking to pivot her career into data analytics and data visualization proved to be the perfect addition to her skillset. She began connecting with Tableau Ambassadors, asking them about their Tableau learning journeys as well as using content created by the community on YouTube, as well as community projects to build her knowledge base.
Now, Sadia is involved in the community in a variety of ways including publishing vizzes on Tableau Public, attending and speaking at Tableau User Groups, and she runs a training program at work to help her colleagues improve their data visualization skills. On Tableau Public, Sadia gets inspiration from trending vizzes as well as on X. She considers her vizzes the accumulation of her knowledge and the inspiration she has gotten from all the great work that other members of the DataFam have done.
Connect with Sadia on Linkedin, X, and Tableau Public.
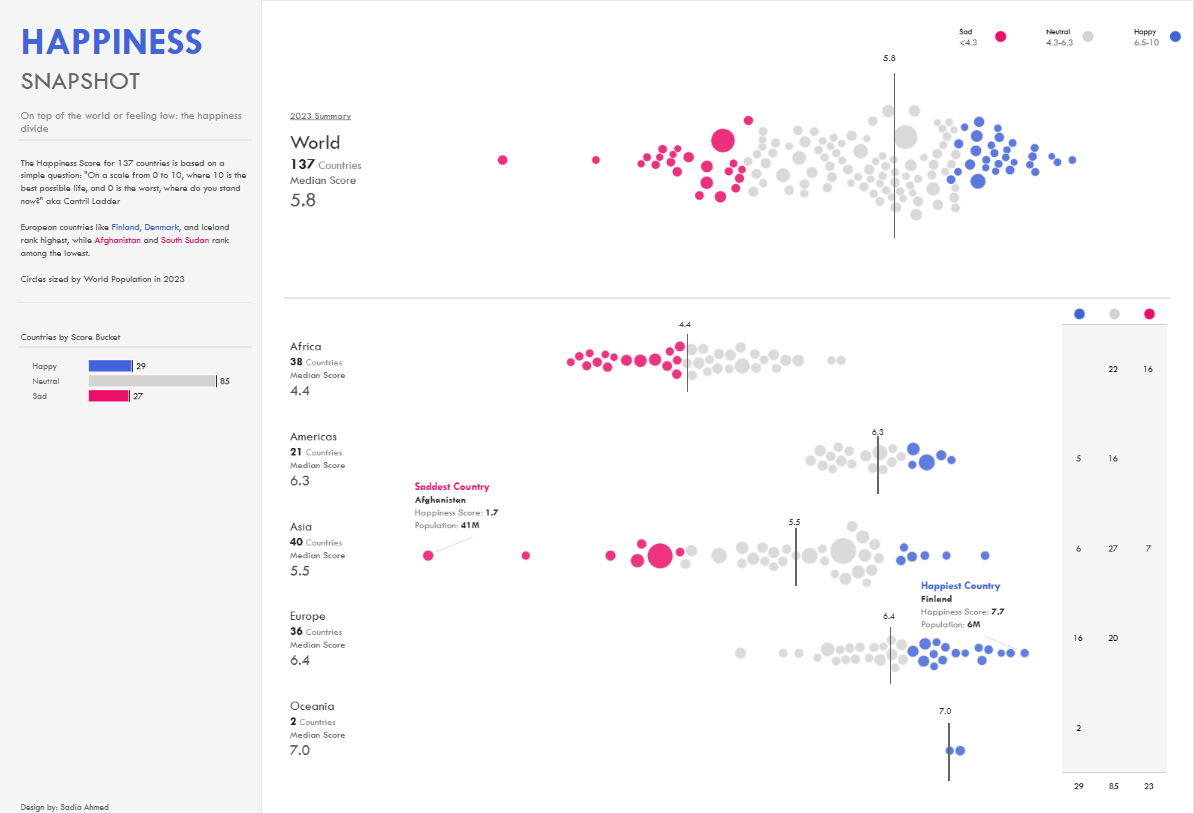
The Happiness Score by Sadia Ahmed on Tableau Public
DataFam content
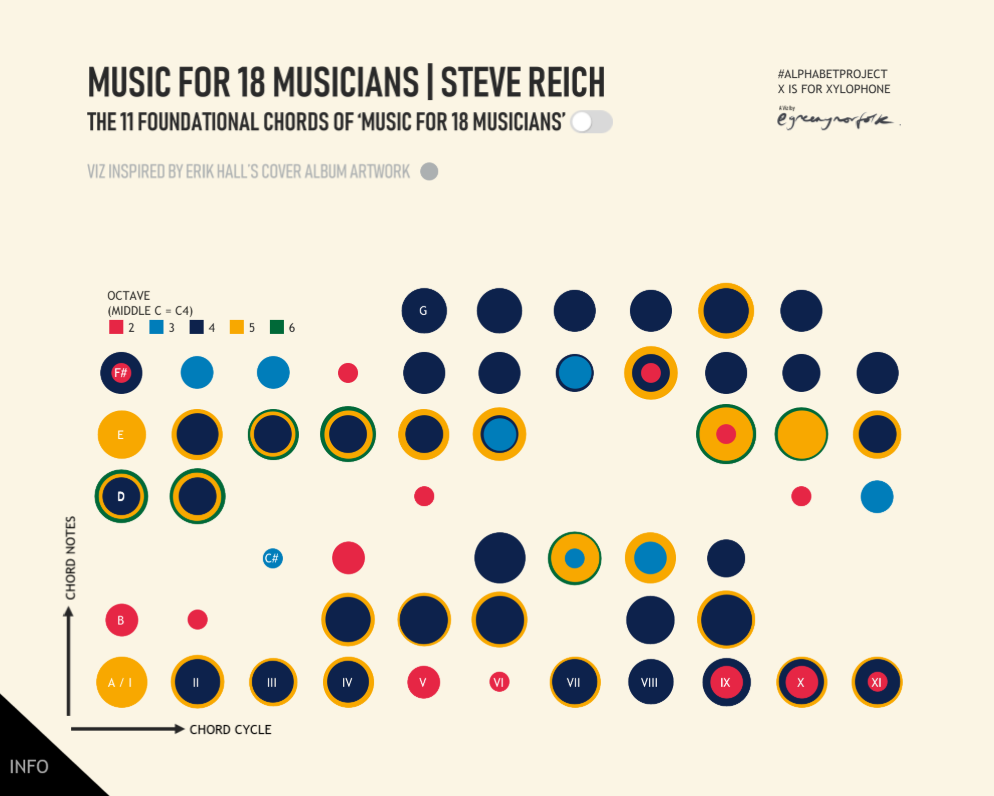
Visualization featured in Creating for Fun in Tableau by Adam Green
Dive into content created by the Tableau Community:
- Omokehinde Ayodeji: Containers in Tableau: The Gateway to Dashboarding
- Frédéric Fery: The Promise of Gen AI at the Viz For Social Good Summit
- Johan de Groot: Count up or down in Tableau with 'CountTo' extension
- Louis Yu: Secrets of the Viz: The Most Elecrifying Man in Entertainment #IronViz featuring Rob Taylor
- Dawn Harrington: What Charts are Best for Human Eyes?
- Adam Green: Creating for Fun in Tableau
- Toan Hoang: Building 10 Tableau Dashboards
- Branden Kornell: #TinyTableauTip - Drop Lines
Upcoming events and community participation
- Apply to speak at Tableau Conference 2025
- Apply or Nominate the 2025 Tableau Visionaries (survey)
- Iron Viz 2025: Qualifier Results: Virtual Event, Jan 14, 2025, 9:00 AM (PT) - The results are in! Iron Viz hosts, Andy Cotgreave and Archana Ganeshalingam will announce the Top 10 scoring entries from this year's Qualifiers, including the 3 Finalists headed to the Iron Viz Championship at Tableau Conference 2025.
- The 2024-2025 Tableau DataDev Hackathon is OPEN until January 31st, 2025
Visualizations
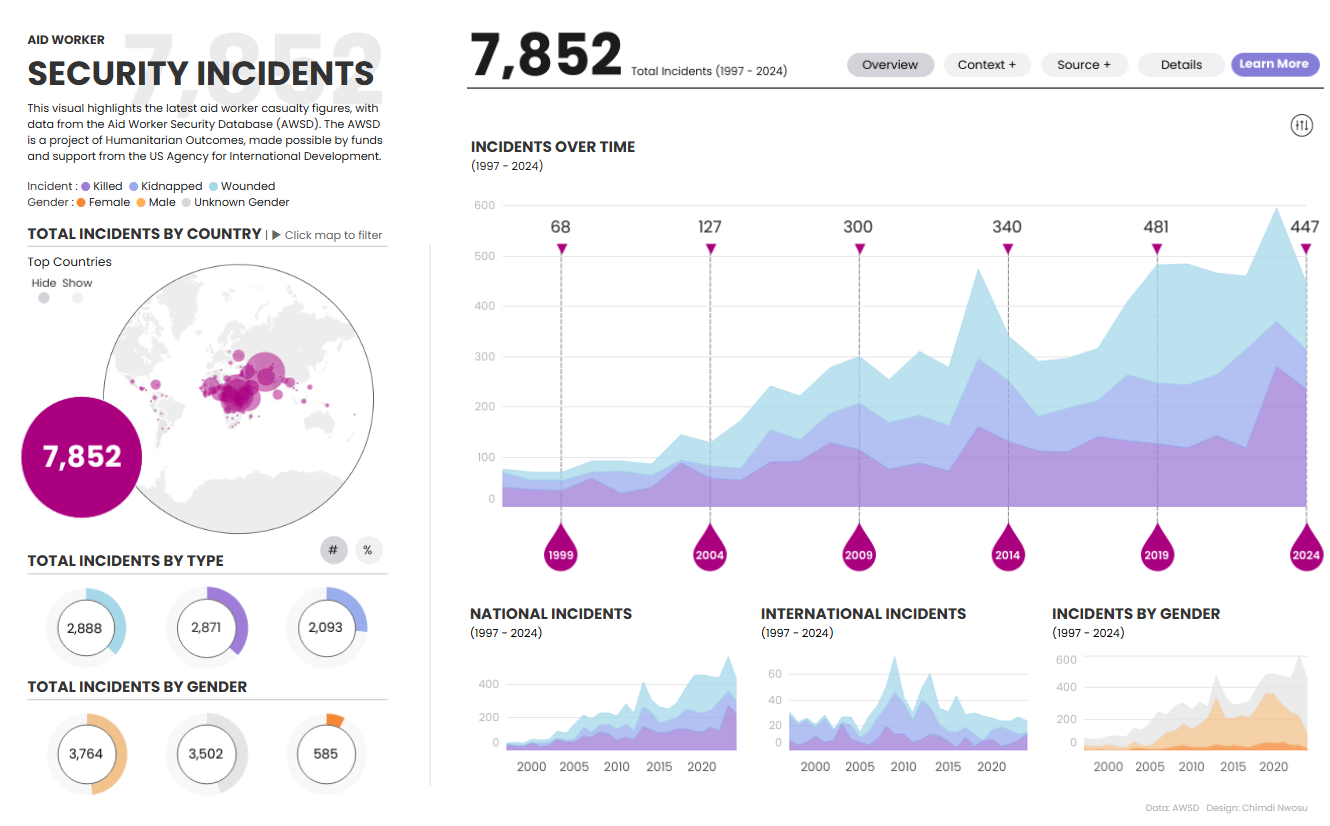
Chimdi Nwosu Aid Worker Security Incidents - #MakeoverMonday
See the latest Viz of the Day, trending vizzes, featured authors, and more on Tableau Public.
Check out some inspirational vizzes created by the community:
- Judit Bekker: My Capsule Wardrobe Chart
- Neoris Spain: Behind Friends: Secrets, Connections, and Iconic Moments
- Ann Pregler: Christmas Cookies
- Devi Arnita: Which Countries Speak the Most Languages?
Community Projects
Back 2 Viz Basics
A bi-weekly project helping those who are newer in the community and just starting out with Tableau. Not limited just to newbies!
Web: Back 2 Viz Basics
X: #B2VB
Workout Wednesday
Build your skills with a weekly challenge to re-create an interactive data visualization.
Web: Workout Wednesday
X: #WOW2022
Preppin' Data
A weekly challenge to help you learn to prepare data and use Tableau Prep.
Web: Preppin’ Data
X: #PreppinData
Makeover Monday
Create business dashboards using provided data sets for various industries and departments.
Web: Makeover Monday
X: #MakeoverMonday
Visual Climate
Collaborate and share climate data.
Web: Visual Climate
X: #VisualClimate
DataFam Con
A monthly challenge covering pop culture and fandoms.
Web: DataFam Con
X: #DataFamCon
EduVizzers
A monthly project connecting real education data with real people.
Web: Eduvizzers
Viz for Social Good
Volunteer to design data visualizations that help nonprofits harness the power of data for social change.
Web: Viz for Social Good
X: #VizforSocialGood
Games Night Viz
A monthly project focusing on using data from your favorite games.
Web: Games Nights Viz
X: #GamesNightViz
Iron Quest
Practice data sourcing, preparation, and visualization skills in a themed monthly challenge.
Web: Iron Quest
X: #IronQuest
Storytelling with Data
Practice data visualization and storytelling skills by participating in monthly challenges and exercises.
Web: Storytelling with Data
X: #SWDChallenge
Project Health Viz
Uncover new stories by visualizing healthcare data sets provided each month.
Web: Project Health Viz
X: #ProjectHealthViz
Diversity in Data
An initiative centered around diversity, equity & awareness by visualizing provided datasets each month.
Web: Diversity in Data
X: #DiversityinData
Sports Viz Sunday
Create and share data visualizations using rich, sports-themed data sets in a monthly challenge.
Web: Sports Viz Sunday
X: #SportsVizSunday
Real World Fake Data
Create business dashboards using provided data sets for various industries and departments.
Web: Real World Fake Data
X: #RWFD
Data Plus Music
A monthly project visualizing the data behind the music we love!
Web: Data Plus Music
X: #DataPlusMusic
Related Stories
Subscribe to our blog
Get the latest Tableau updates in your inbox.


