Best of the Tableau Web: New product, new authors, and new community content
Catch up on the latest and greatest content from the community! Dive into the Best of the Tableau Web from April.
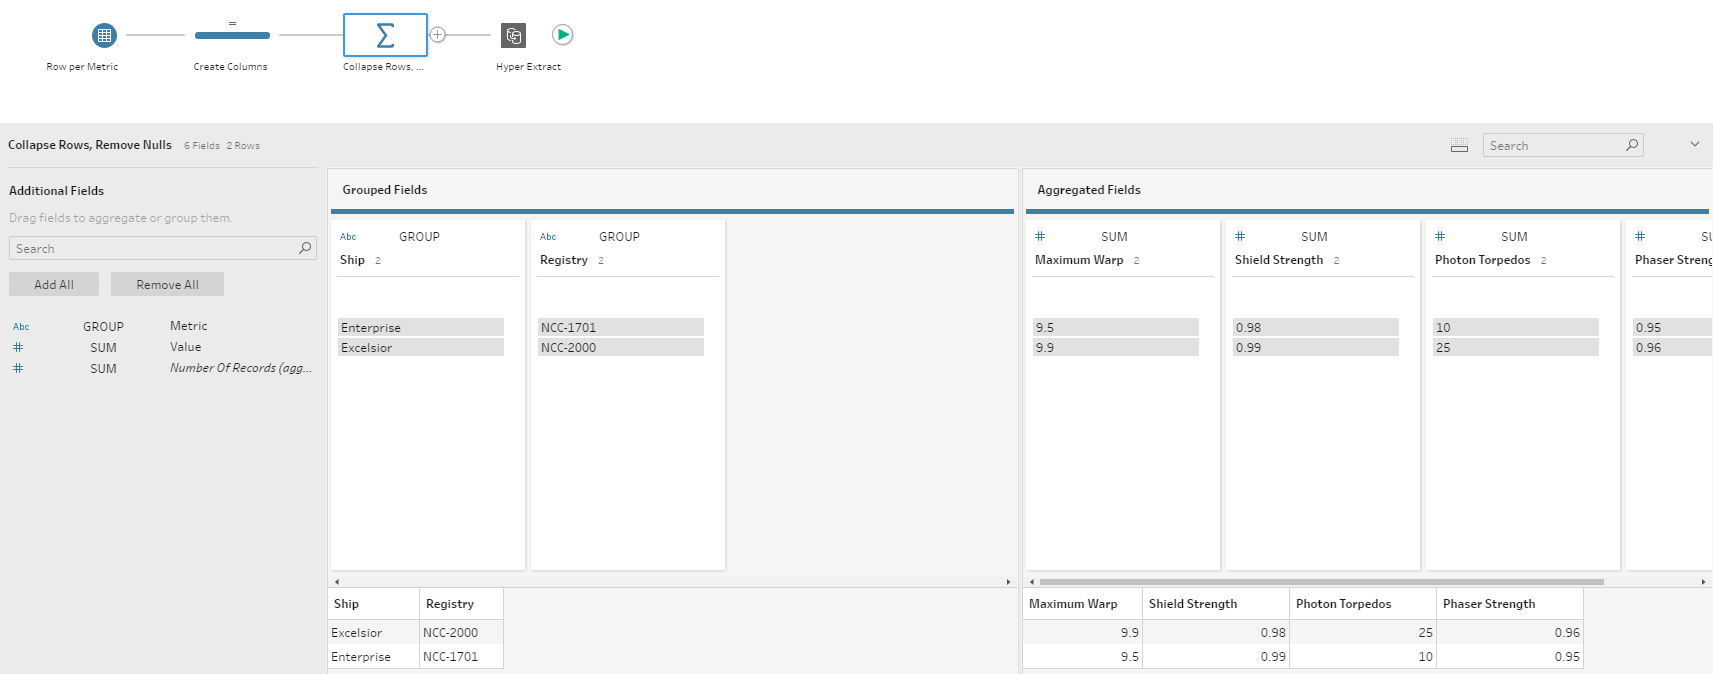
 In March’s BOTW, I welcomed the new Zen Masters. This month, there’s even more to celebrate! Tableau Prep was released in April and I’ve been delighted that people are already sharing their Tableau Prep discoveries and learnings with the community. We’ve seen incredibly useful blog posts from Tableau partners (thank you Interworks, Information Lab and Senturus). And some highlights from the community include Joshua Milligan’s explanation on how to unpivot data in Tableau Prep, Ben Moss’ tips for appending data, and Phillip Lowe’s overview on data scaffolding using Tableau Prep. Tableau Prep is a new extension to the Tableau platform, so keep all your ideas flowing, be they about Tableau Prep, Desktop, or Server—or even about how Tableau influences your thinking. Right now, every person on the planet is a Tableau Prep newbie: we will all benefit from your tips and tricks, however big or small. Write blogs, record videos, share flows—we want to see what you’re learning! Finally, in the spirit of community, I’d like to welcome Lindsay Betzendahl to the blog scene (Viz Zen Data). She went from considering starting a data viz blog (pondering the idea over Twitter) to creating one in just a day. If you’re thinking about starting a blog, check out all the advice from the Tableau community on the Twitter thread. And now...here’s our community roundup for the month of April.
Inspiration
Questions in Dataviz How should we visualise stacked bars?
datasaurus-rex Tableau Public explained & how it can help your career
TableauFit A Primer on a Liberal Arts Education
Pixel Mixer Anatomy of a Viz - Making Fire with Tableau
Everyday Dashboards Everyday Dashboards – Real Tableau Dashboards by Real Users
POINTS OF VIZ Taking Tooltips Off The Map
Ryan Sleeper How to Create a Bilingual Dashboard in Tableau
Viz Zen Data The art and zen of data visualization.
Getting vizzy with it Data+Women Virtual Tableau User Groups
VIZJOCKEY Creating Circular Dot Plot Timelines in Tableau
The Data Duo The Data Duo Completes 2 Years!
Data Ink blog Sports Viz Sunday
Tips and tricks
Jevon Da Costa The proper way to label bin ranges on a histogram
Timothy Manning The Window Correlation Function (WINDOW_CORR)
Tom Pilgrem How to display negative values as positives
Laura Scavino Regular Expressions in Tableau and Alteryx
Robbin Vernooij Tableau Modulo operator and its use in dividing your sheet into multiple grids
ROSARIOVIZ Dynamic Chart of Step Line
VizPainter Unpivot in Tableau Prep (Rows to Columns)
Ravi Mistry Consultant’s Diary – Filter Customisation
Jedi
Vizible Difference #TableauBrainTeaser: Creating Calendar with Minimum Data
TableauFit Tableau Mapping for 2018.1 and Beyond
Server
Laura Scavino User Filters in Tableau Server – Part 1
Related Stories
Subscribe to our blog
Get the latest Tableau updates in your inbox.


