Best of the Tableau Web: New Zen Masters, visualizing music, and dynamic range parameters
It's the latest and greatest from the Tableau community. Read the Best of the Tableau Web from February!

Ah, February, the best month of the year at Tableau—no, not because it's my birthday on the 12th, but because it's the month we announce our new Zen Masters. Part (not all) of what makes a Zen Master so incredible is what they blog about. This month, as always, the Zens have set great examples.
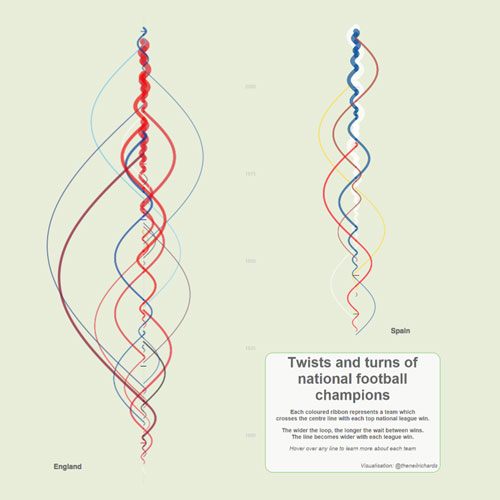
We welcome Neil Richards to the program, and enjoyed his exploration of ways to visualize timelines. Ann Jackson wrote a super post about her experiences with the Tableau Foundation. Ken Flerlage continues to amaze with his creativity—I mean, music? In Tableau? Even our new Hall of Famers prove they've still full of new ideas, with Jonathan Drummey's excellent post on dynamic range parameters, and Andy Kriebel's mosaic chart from his running activity data.
As always, I love to read these Tableau blogs, and continue to enjoy sharing them here on our blog. Keep it up!
Tips and tricks
learningtableaublog #TakeapartTuesday – Stepped Lines
Gauthier Bonnot How to create a bump chart in Tableau
The Data Duo Viz in Tooltip | Requesting a Highlighter
VizWiz Creating Runkeeper Tile Maps with Alteryx & Tableau
Timothy Manning Blue And Green Pills – What Do They Mean Tableau?
Oliver Clarke The Top 5 Things I Learned Today
Inspiration
Questions in Dataviz Why do we visualise data?
Ken Flerlage Can I Do That? Music in Tableau
Jackson Two Go Give Back: Tableau Foundation Service Corp
Points of Viz Visualising Simpson’s Paradox
TableauFit 5 Books You Might Not Have in your Tableau Analyst Library (Yet)
Vizible Difference How to Make LOVE in Tableau
Jedi
Drawing with Numbers Creating a Dynamic Range “Parameter” in Tableau
Vizible Difference Designing 3-Way Venn Diagram
Server
Silicon Valley Enterprise TUG Feature Adoption – Lock Project Permission
Related Stories
Subscribe to our blog
Get the latest Tableau updates in your inbox.


