
Tableau Pulse
Tableau Pulse, a reimagined data experience, built on the Tableau platform, that empowers every employee with intelligent, personalized, and contextual insights delivered in the flow of work. Tableau Pulse helps everyone in your organization integrate data into their daily jobs to make better, faster decisions. Without having to learn a new tool or build comprehensive visualizations, Tableau Pulse helps you go beyond the how and what and shows you the why behind your data.
*Tableau Pulse currently supports US English.
Tableau Pulse on Mobile
Check your metrics on the go. Access Tableau Pulse on Tableau Mobile and explore personalized data insights to help you understand the trends, outliers, and other noteworthy changes to the metrics that matter most to you. Tableau Pulse on Mobile makes it easy for you to access your insights by linking metrics in Tableau Pulse email and Slack directly to the app's insights exploration page so you can dig deeper with just one click.
**Basic ratings on Pulse homepage summaries will be available on Tableau Mobile in March 2024.

Tableau Cloud on AWS Marketplace
Tableau Cloud is now available in AWS Marketplace to help IT leaders simplify billing, streamline procurement, and get a comprehensive view of IT spending. Additionally, all Tableau Cloud sites get 1TB of data storage. Customers with the Enterprise SKU and Advanced Management get 5TB of data storage.

Tableau 2024.1 Feature Overview
Tune in to hear about the latest features from 2023 Tableau Visionary Annabelle Rincon. She will walk you through the top highlights included in this release.
Watch nowAll Features

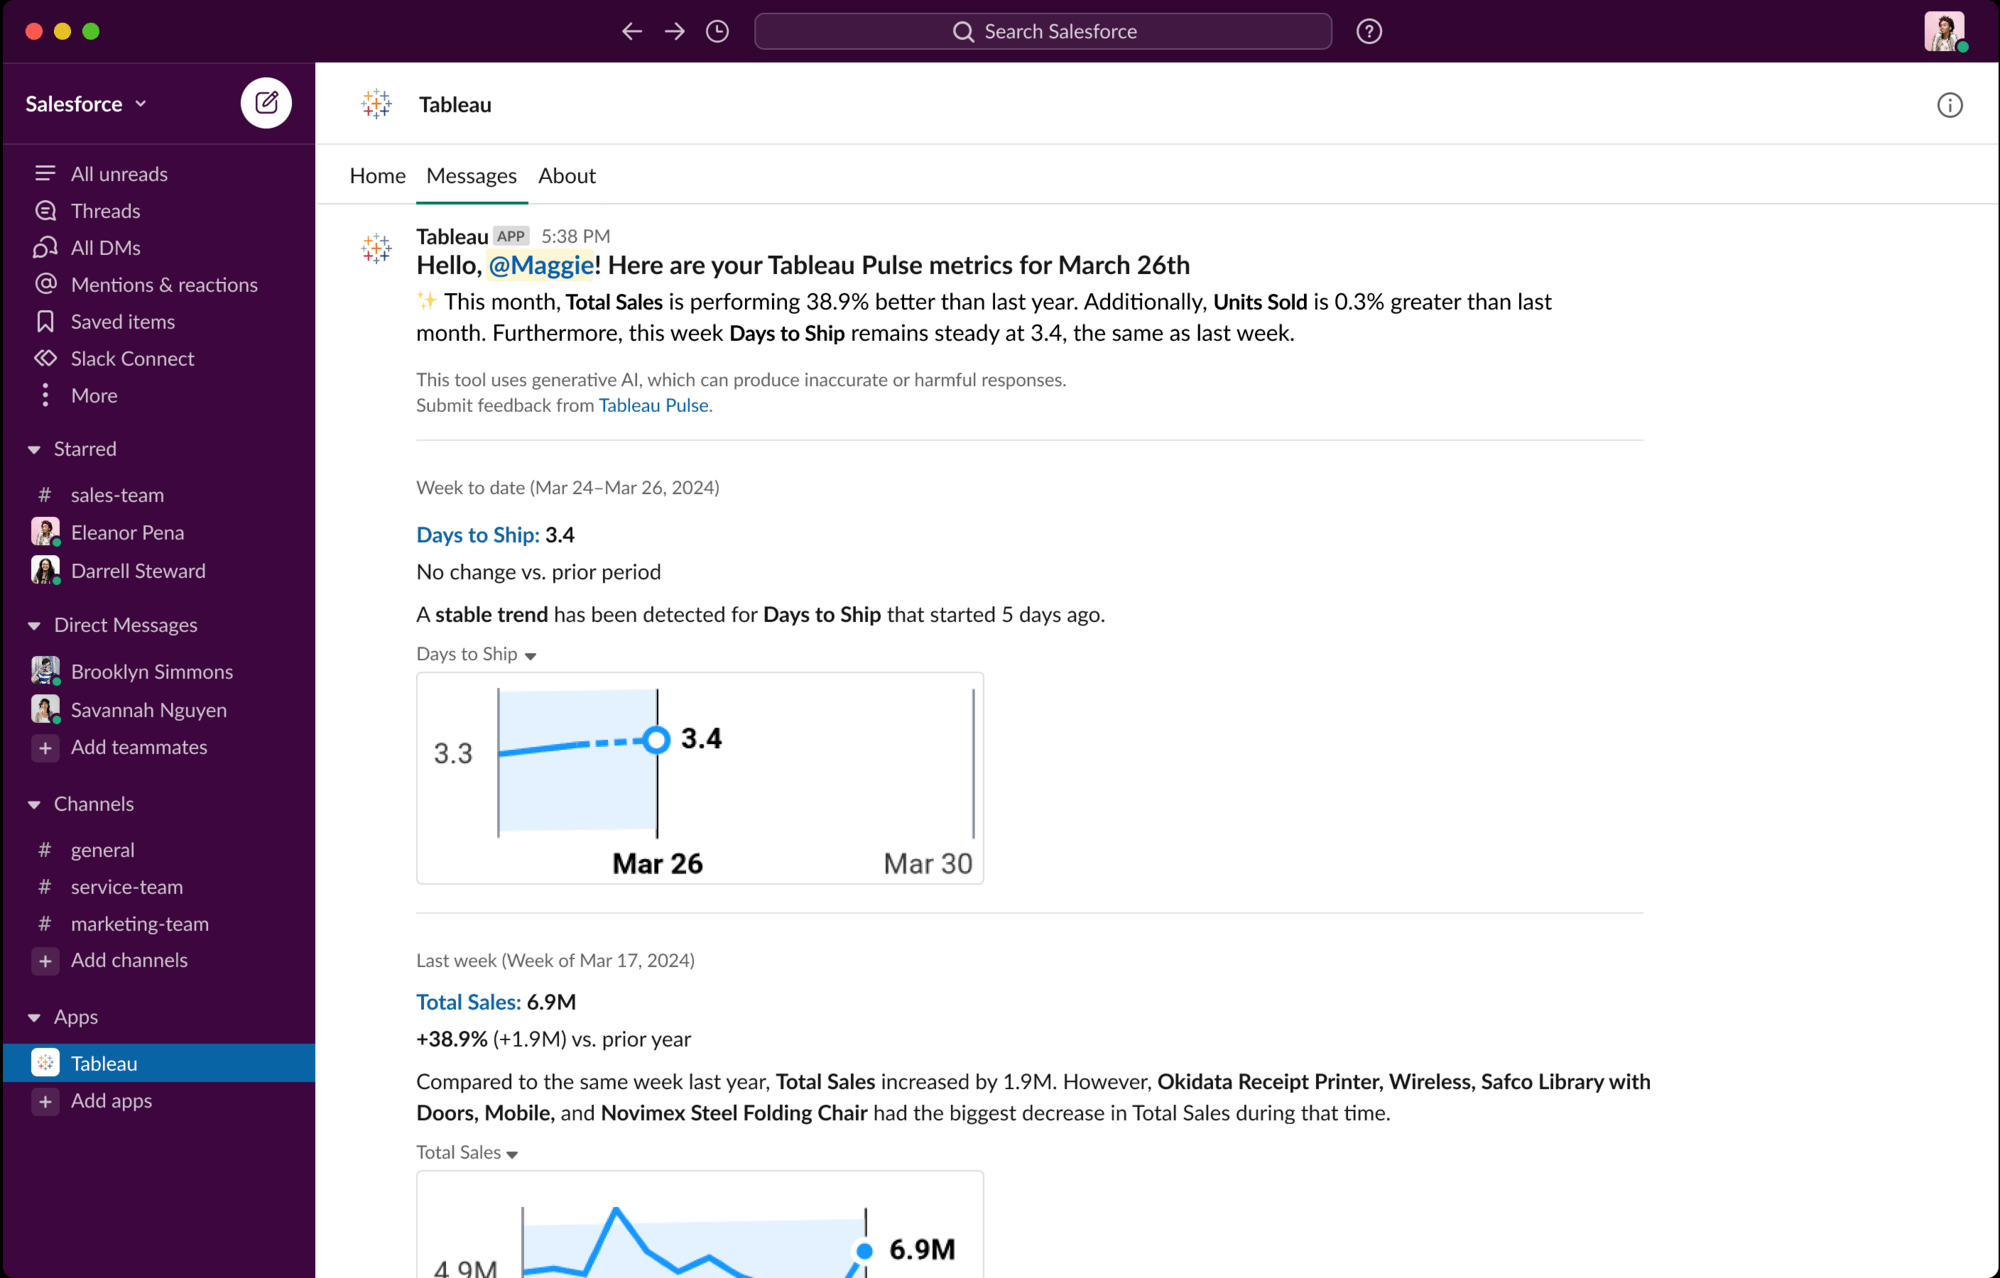
Pulse - Sparklines in Slack
Your Pulse Digest in Slack is more powerful than ever. You now receive natural language insights accompanied by a visual explanation, making it easier to assess the changes in your metrics in the flow of work. Quickly identify the trend in your metrics and if it’s within the expected range so you can make appropriate and timely decisions.
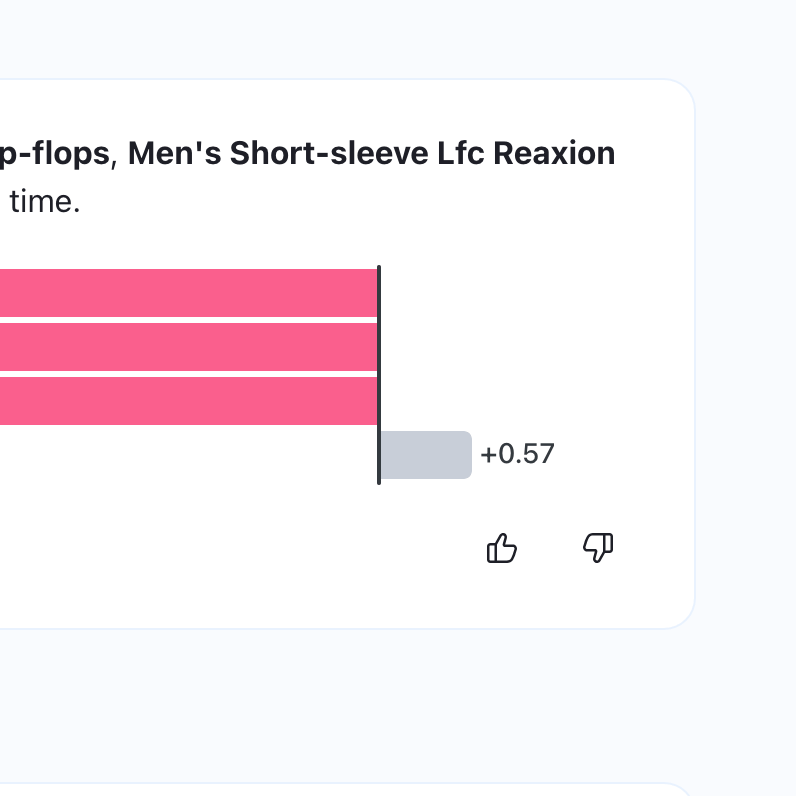
Pulse - Personalized Insights Ranking
Enhance your experience by letting Pulse know which insights you find most valuable. With personalized insight ranking, your feedback on thumbs-up and thumbs-down will shape the insights you see first. Receive insights tailored to your interests and preferences, improving your overall user experience across different workflows, including Digests, Home page, and Metric details page.

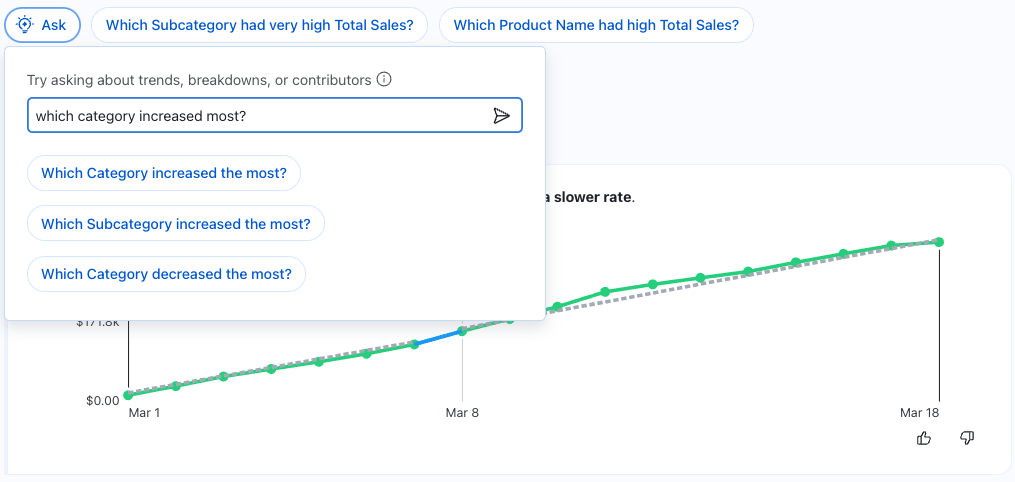
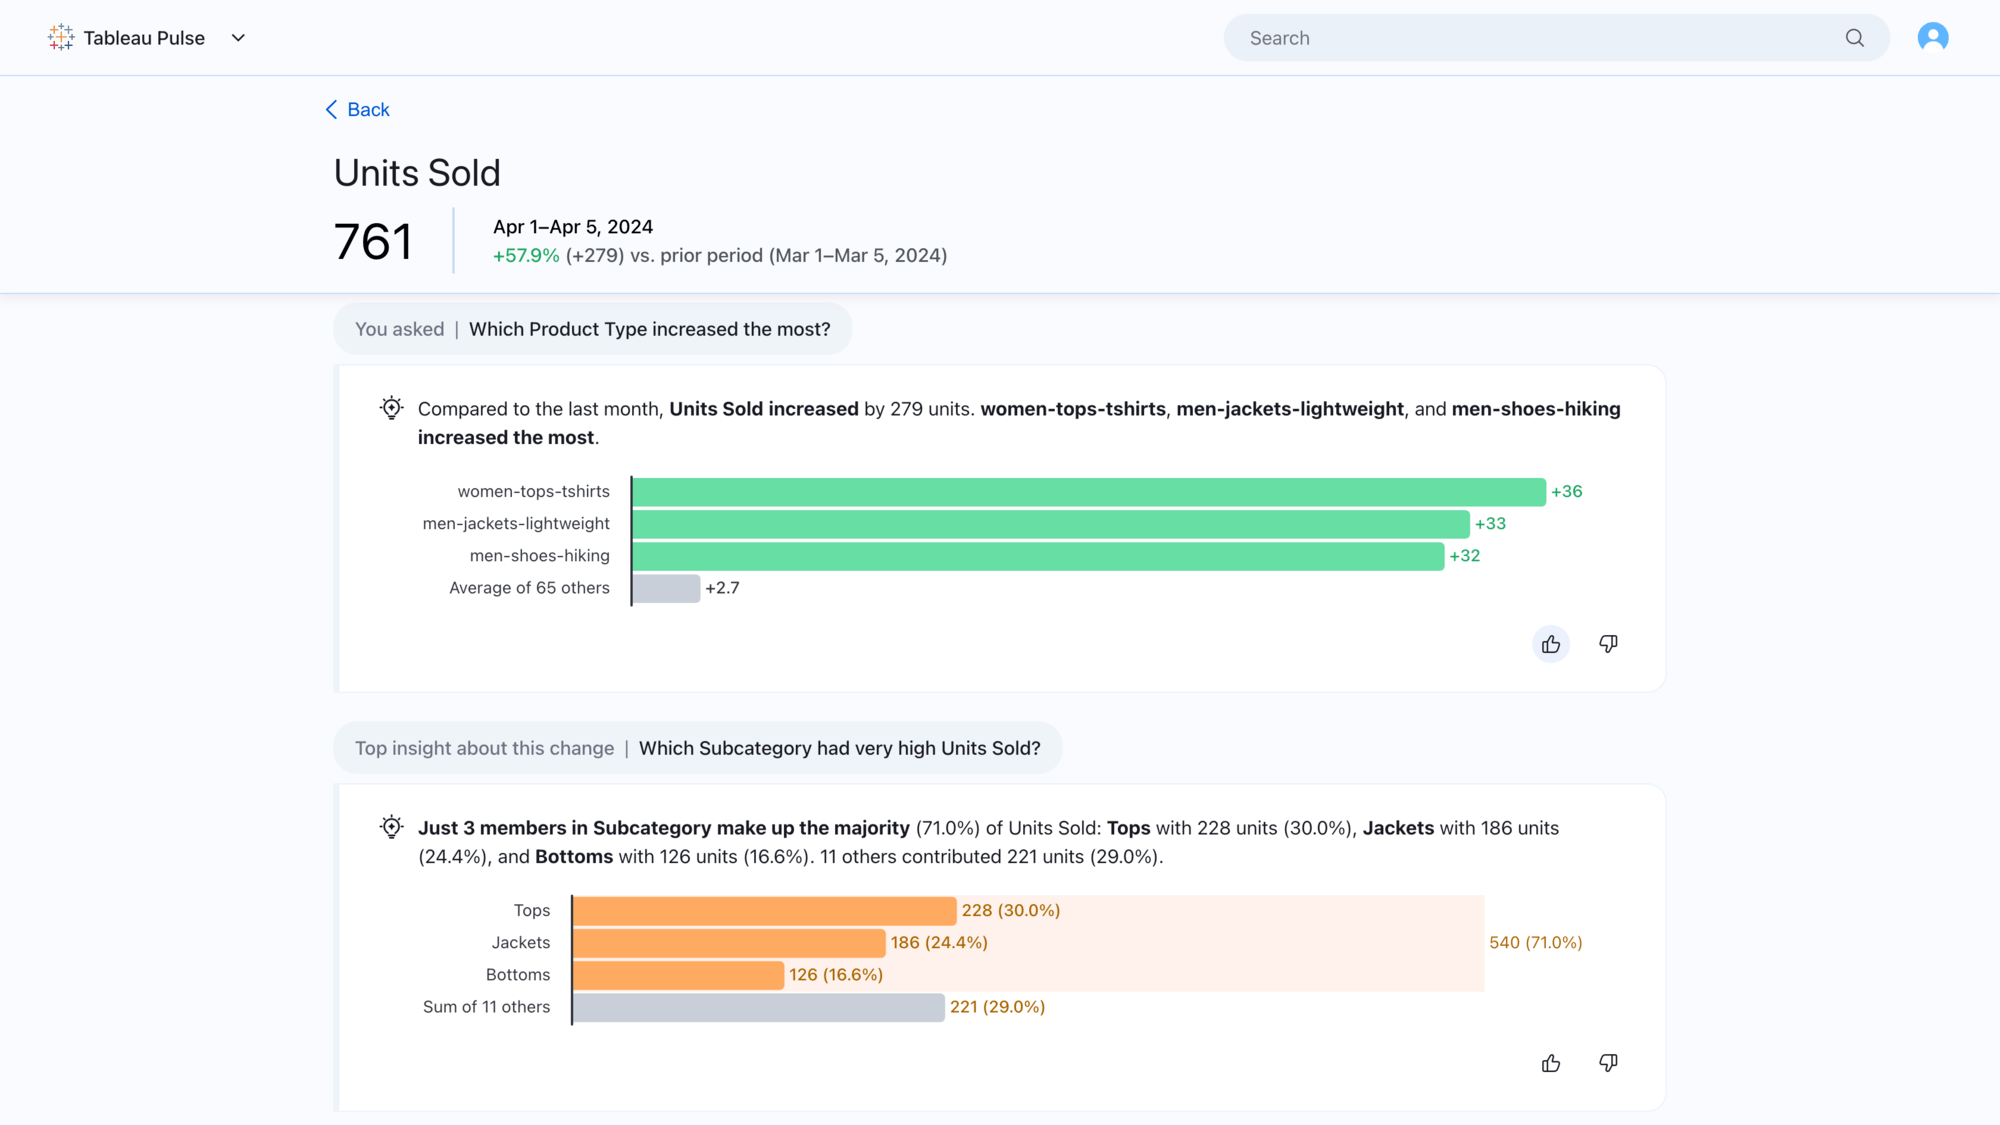
Pulse Q&A Enhancements
Pulse Q&A unlocks more ways to explore your insights through guided questions and through the ability to ask questions. You will now see an additional "Ask" button next to the existing guided questions which enables you to ask questions related to metrics you are investigating. Using the "Ask" feature will prompt suggested questions that match the insights you are investigating.

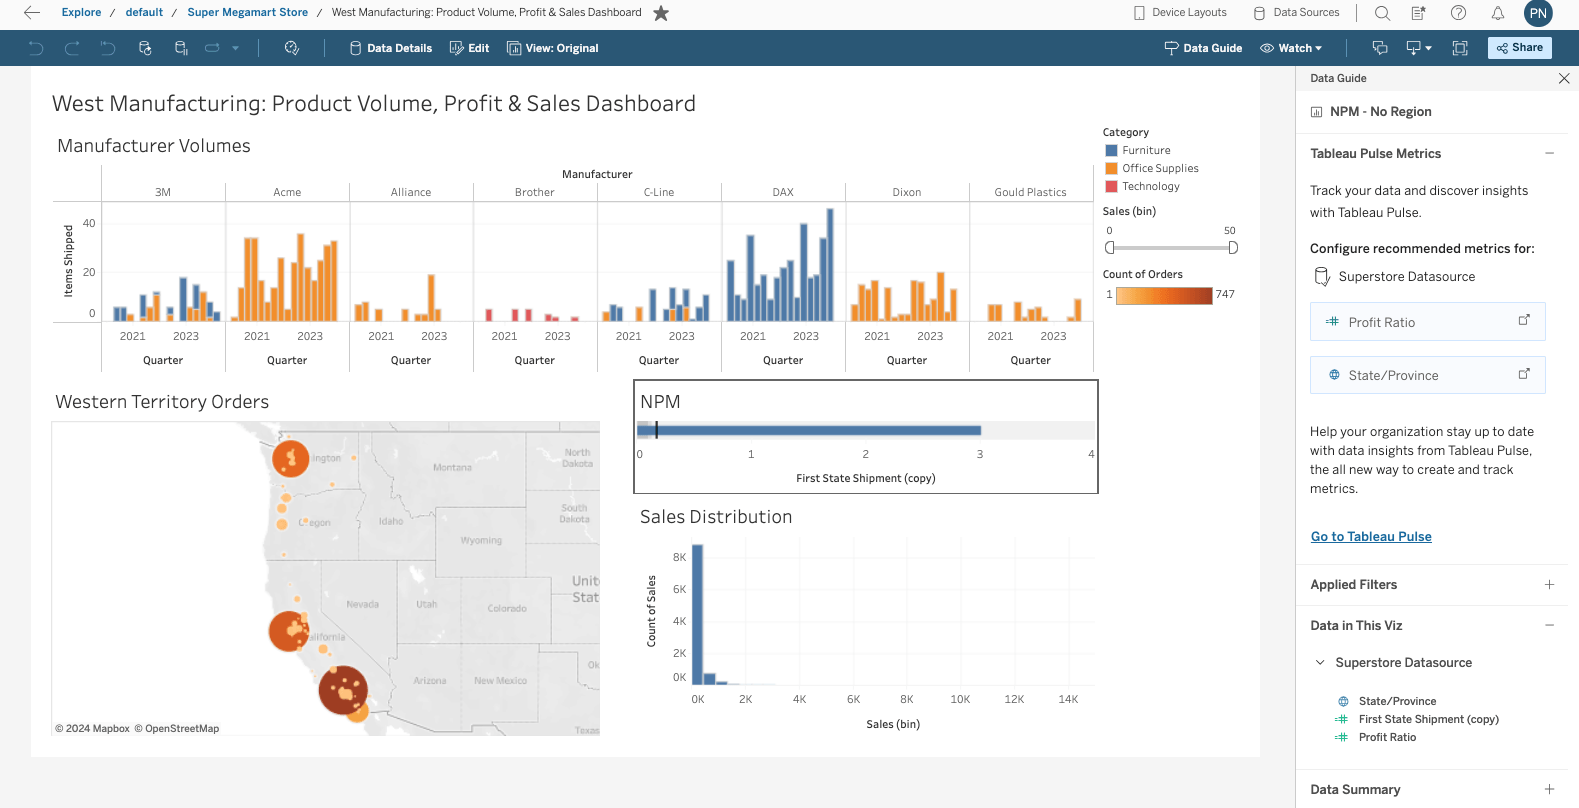
Metric Bootstrapping Enhancements
Discover Tableau Pulse metrics hidden in dashboard vizzes with smarter heuristics and more context using Tableau Data Guide. Enhancements include improved heuristics to identify primary measures and dimensions in key Tableau viz types (bar, area, and line charts), recognition and inclusion of calculated fields within Published Data Source (PDS), and improved visualization of icons for measures and dimensions.

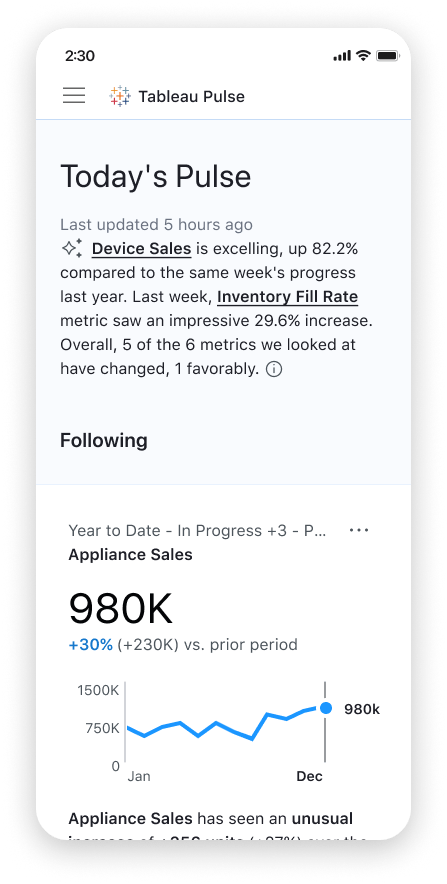
Tableau Pulse Mobile
Check your metrics on the go. Access Tableau Pulse on Tableau Mobile and explore personalized data insights to help you understand the trends, outliers, and other noteworthy changes to the metrics that matter most to you. Tableau Pulse on Mobile makes it easy for you to access your insights by linking metrics in Tableau Pulse email and Slack directly to the app's insights exploration page so you can dig deeper with just one click.
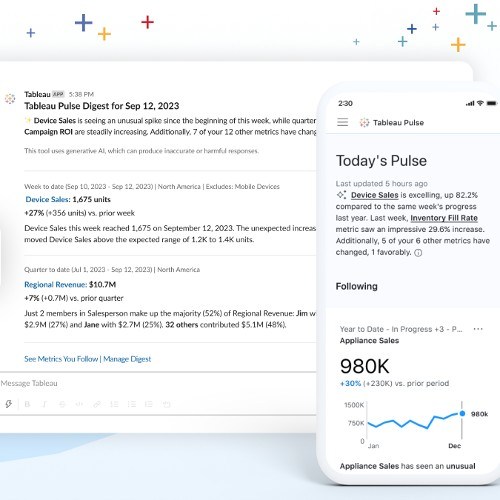
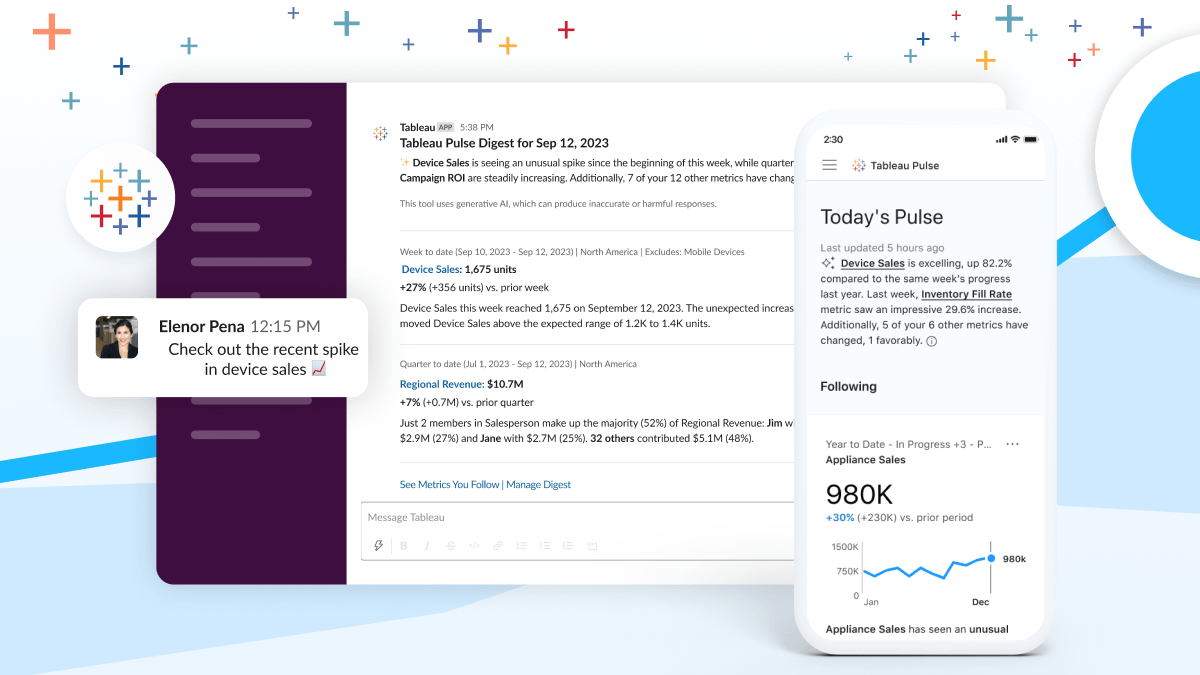
Tableau Pulse Next-Gen Experiences
Discover, follow, and share your key business metrics to quickly identify insights in a friendly and intuitive experience. Tableau Pulse’s Next-Gen Experiences provide digestible data insights wherever you like to work—whether it’s in Slack, email or any application. The best part? Tableau Pulse delivers your insights proactively so you can make decisions on time.


Tableau Pulse GAI
Tableau Pulse is powered by Tableau AI, a suite of predictive and generative AI capabilities that simplify and democratize insight consumption and data analysis at scale. The first feature of generative AI in Tableau Pulse is Insight Summaries. This is where the large language model (LLM) provides an overview of the metrics that matter to you in plain language. Tableau AI is built on the Einstein Trust Layer, meaning it enables trusted, ethical, and open AI-powered experiences without compromising data security and privacy.


Tableau Pulse Insights Platform
Knowing where, when, and why to pay attention to your business has never been easier. Within Tableau Pulse, the Insights platform automatically detects drivers, trends, contributors, and outliers for the metrics you follow. It proactively flags changes that matter to you. Using natural language and supporting visual explanations, users can receive proactive guided questions to progressively reveal business insights via a conversational interface.


Tableau Pulse Metrics Layer
Create a standard definition of your data to power your insights and analysis in Tableau Cloud. Tableau Pulse’s metrics layer lets you define metrics and enrich them with real-world business context. You can reuse your metrics to solve countless use cases and maintain consistency across your organization.


Tableau Pulse Recommended Metrics
Derive actionable Pulse metrics from Tableau dashboard visualizations. Utilizing the Tableau Data Guide feature, you can select a visualization within a dashboard to receive tailored recommendations for potential Pulse Metrics. You can then navigate the Pulse user interface to edit, refine, and formally create Pulse metric definitions based on those recommendations. This enables you to identify valuable metrics and provides the flexibility to customize and finalize Pulse metrics.


Tableau Pulse Slack Digest
Make data-driven decisions with convenience and ease right within your Slack app. Tableau Pulse Slack Digest provides AI-generated insights that highlight the performance of metrics that you follow. Each digest includes contextual insights about metrics you follow, which can be explored individually for further insights.


Tableau Pulse Email Digest
Make quick performance assessments directly in your email. Tableau Pulse Email Digest delivers contextual insights about your metrics in your email as a digest. Each email digest contains an AI-generated summary for a quick assessment of key metric performance in addition to sparklines and contextrual insights for more in-depth analysis. Email digest frequency can be adjusted to daily, weekly, or monthly based on your preference.


Tableau Pulse Web Component
See metrics that matter to you in the flow of work. Tableau Pulse Web Component enables you to embed the Pulse metric inside your products or customer applications so you can get a quick glance at the state of your KPIs without disrupting the flow of work of your daily tasks.


Migration SDK
Simplify and speed up migrations from Tableau Server to Tableau Cloud. The Migration SDK gives you the information and tools you need to build custom migration applications with C# and/or Python. With these tools, you can migrate users, permissions, projects, workbooks, data sources, metadata, and more.


Consume native Salesforce Data Cloud objects in Tableau Catalog
Make better-informed decisions using Data Cloud objects. Access to Salesforce Data Cloud objects (Data Lake Objects, Data Model Objects, and Calculated Insights) are now distinct entities native to Tableau Catalog. These objects can be easily discovered in search results, connection dialogs, and external assets.

Labels in Web authoring and custom label management improvements
Elevate your data assessment quickly and precisely due to an improved label management experience. With the consolidated Data Labels dialog, you can easily add and remove data labels, including certifications, data quality warnings, sensitivity labels, and custom categories. The improved web-authoring feature enables users to interact with sensitivity and custom labels, providing a comprehensive view to assess data asset risks.

Identify duplicate rows
Trust your data is clean and accurate with enhanced Tableau Prep functionality to identify duplicate records across your data set. With the visual and direct nature of Tableau Prep, it is now easier to understand the reason behind the duplicate records. Users can fix the identified data issues or remove all the duplicates, based on specific data prep needs.
Splunk JDBC connector
Enhance your ability to harness valuable insights from your Splunk data. Experience improved integration to Splunk Enterprise with Tableau's Splunk Connector. This powerful tool features an embedded SQL Engine, enabling the effortless execution of supported SQL operations directly in Splunk. Distributed via the Tableau Exchange, adding and managing this connector in your existing environment is a breeze.

Select header and start row in Tableau Prep
Ensure precision in cleaning and shaping Excel files in Tableau Prep. Users can effortlessly identify file schemas, including 'metadata rows,' providing clarity at the start of their data files. With the ability to preview data in input settings and explicitly set headers and data start rows, users gain control over their Excel data.


Visual segment creation to Salesforce Data Cloud
Create segments in Data Cloud directly from your visual data exploration within Tableau. Visual Segment Creation to Salesforce Data Cloud provides you with a streamlined way to explore the data from your Data Model Objects (DMOs), identify candidate audience segments, and push those audience segments directly in Data Cloud from your Web Authoring session.
Dynamic parameters in Table extensions
Table extensions unlock live data, enhance security, and transform analytics through automatic retrieval based on user parameters. Seamlessly connect Tableau dashboards to external services, passing parameters securely to unlock the full potential of your data. Make informed decisions faster by reinventing how you interact with data.


