Visualizing the hardest places for girls globally to receive an education
As part of Tableau’s ongoing celebration of the next generation of women leaders in data, we’re also inviting our friends at ONE.org to help explore where women and girls face the highest hurdles in accessing education opportunities.
Over 130 million girls didn’t attend school today. Millions more braved long distances, often in dangerous conditions, to get there. Others arrived to sit in a classroom without a teacher, or where the absence of textbooks and learning materials created challenges, too.
Each of these challenges is another brick in the wall standing between girls and a valuable education to support their development and future. In 2017, on one side of that wall, are half a billion women worldwide who still cannot read.
We recognize that girls who receive a complete 12 years of quality education are more likely to succeed in the workforce. And these educated women go on to advocate for their rights, contribute to their families, shape their communities, and grow economies all over the world.
To make sure every girl has the chance to receive a quality education, we need to understand where girls are left behind. That’s why the Tableau Foundation is proud to support ONE's work to bring equal opportunities to girls everywhere, and is pleased to help visualize critical education data in their Toughest Places for a Girl to Get an Education index.
The index encapsulates 11 factors that reflect girls’ access to and completion of school, indicators of education quality in 122 countries, and of the broader enabling environment. The visualizations were the product of a collaboration between ONE staff and Tableau Service Corps volunteers Nick Hara and Tracy Kropp. With International Women’s Day taking place this month, we asked Nick to share his thoughts on some of the visualizations—why the team designed them as they did, why he thinks they’re impactful, and what others can learn from them.
Map without a map

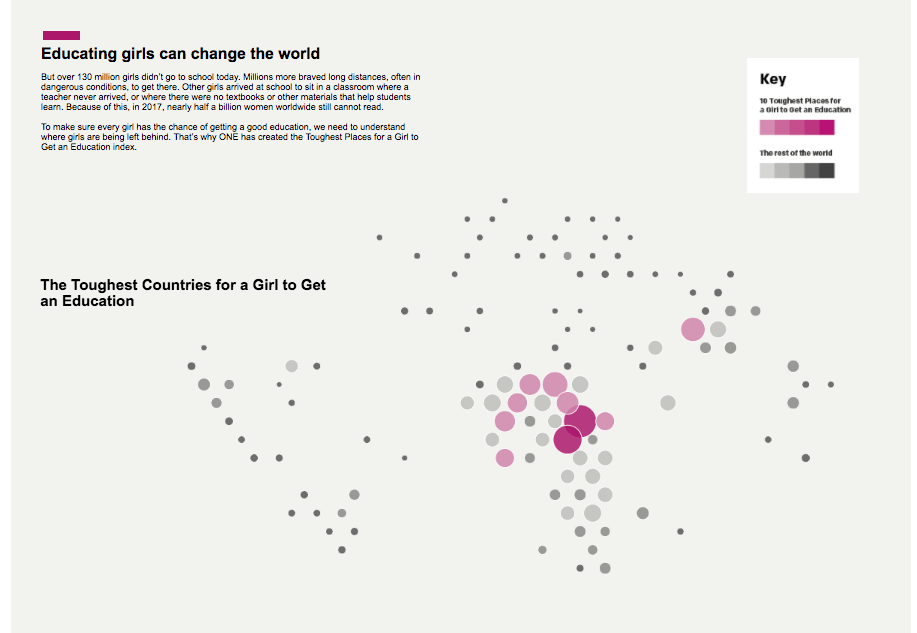
A cartogram is an abstract map that changes geographic features to be proportionate to each other or to a non-spatial factor like population density. We used a cartogram because the shape of the world is instantly recognizable, but the most important point stands out—in this case, a majority of the 10 toughest countries to be a girl in school are in the Sahel region of Africa.
Wheel in a wheel (sunburst chart)

While the map visually conveys the impact of the top ten countries, by highlighting them in a more abstract manner, we can fully communicate just how far behind the rest of the world these countries are with regard to girls’ education. The best-performing countries are not just a little ahead, and this graph puts that into stark contrast.
Importance of interactivity

Besides showing the relationship between indicators, we felt it was important to reveal how each country stacked up. By allowing users to hover over marks and highlight their own country, we hope to encourage deeper learning and understanding of the opportunities and obstacles countries face around funding and ensuring girls’ access to education.
Taking it a step further, this dot plot shows that the distribution of education spending is highly segmented, but education performance doesn’t correlate strongly to the amount of government funding—how a government spends does not uniquely predetermine how a country will perform. Fulfilling one of the funding requirements for bettering education alone was insufficient to improving girls’ education.
Learn more
Over 130 million girls are still out of school – that’s over 130 million potential engineers, entrepreneurs and politicians whose leadership we’re missing in the world. To learn more about the state of education globally for girls and ONE’s work advocating for change, we invite you to download their ground-breaking report, The Toughest Places for a Girl to Get an Education.
相關文章
Subscribe to our blog
在收件匣中收到最新的 Tableau 消息。


