Edmunds democratizes big data with Tableau and Amazon Redshift
Edmunds has helped automobile buyers for more than 50 years, offering advice and online resources to assist them with car purchases. They’re also a valuable and trusted resource for dealers and OEMs who rely on Edmunds to connect with prospective customers. Supporting millions of customers and several dozen OEMs results in significant data for the company to capture and create insights from. Edmunds processes 20 million user actions daily and 40 terabytes of data per year, so having the right solution to manage and optimize all information for customer benefit is paramount.
At Edmunds, a traditional reporting process stood in the way of everyone who wanted more answers from their data. “People in R&D or marketing don’t want to stop and write a query,” explained Punnoose Isaac, Executive Director of Analytics Development at Edmunds. “And they don’t want to have to work through an engineer just to get the information and insights they need.”
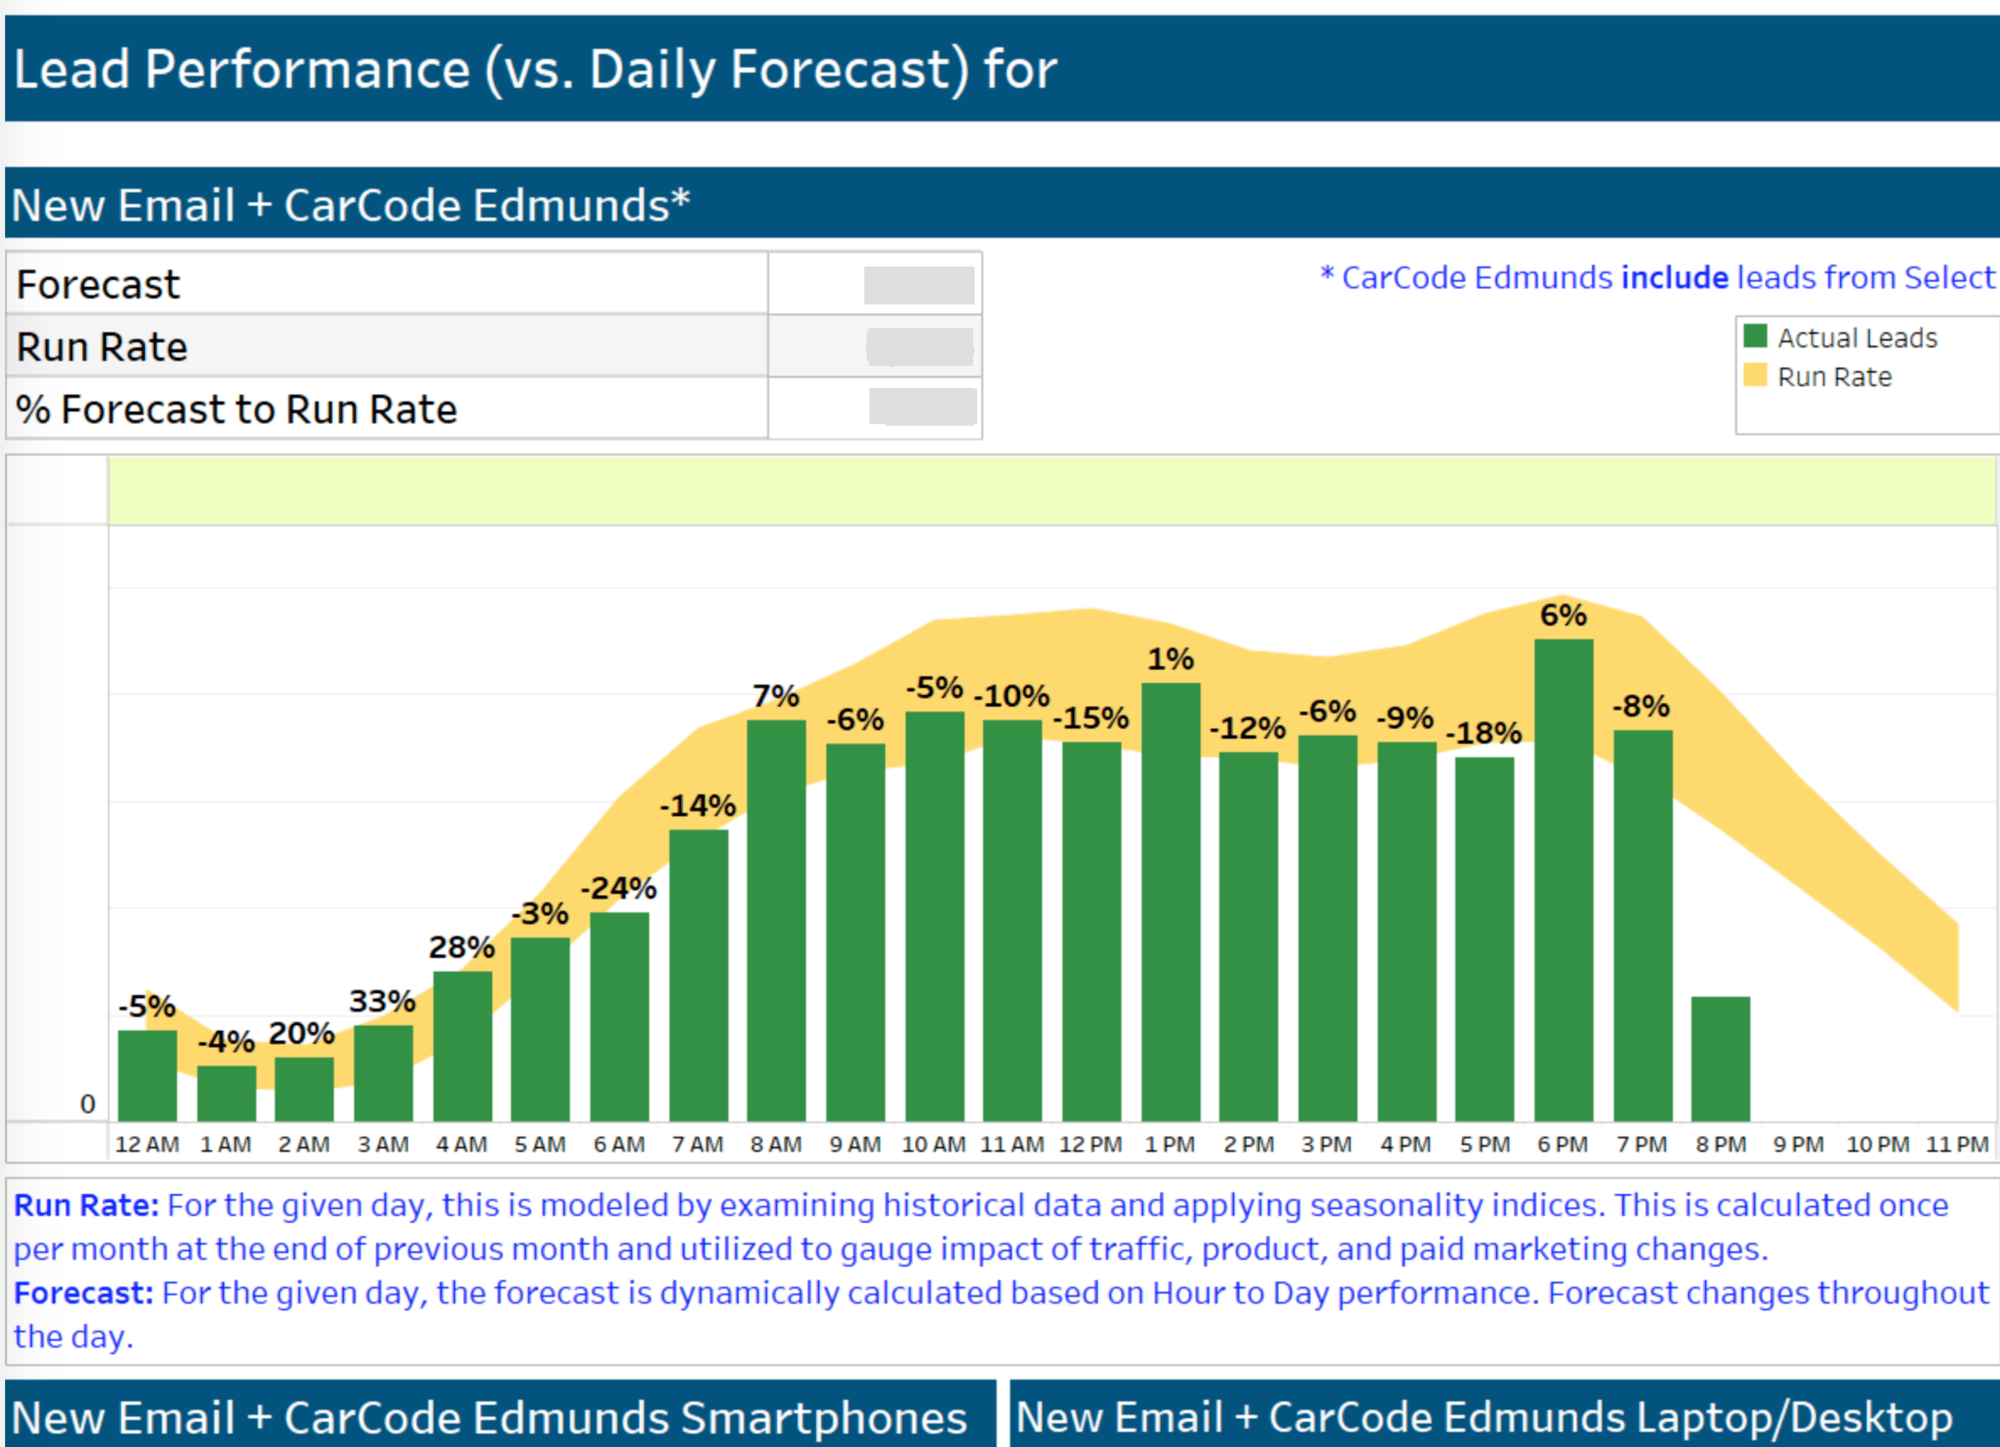
Although a centralized team of around 50 data scientists and analysts provided initial customer use insights with a set of dashboards, if staff wanted to probe further into the data, more dashboards were required. The resulting cycle of recreating them again and again was time-consuming and Isaac and his team found themselves frequently asking, “didn’t we build this before?” At the same time, business users were increasingly resistant to using dashboards that offered surface-level information.
All of this made it difficult to achieve the self-service analytics culture that Edmunds desired. Providing each person or business group with the data that mattered most to them became top priority. A search commenced for a scalable, cost-effective data infrastructure and Edmunds landed with Amazon Web Services (AWS) and Tableau to embrace self-service analytics, “engineering for the n+1st question.” With a visual collection of Tableau dashboards telling an important, cohesive story of Edmunds’ data, the six-month dashboard revisit rate is now at 75 percent.
Tableau Server on AWS offers Edmunds savings and business agility
Tableau appeared on the radar for Edmunds at a critical time, offering a modern business intelligence approach to support their self-service analytics goals and manage their growing data sets. The difference was not just delivery of a report, but how Tableau brought data closer to analysis for Edmunds so that new questions could be answered. Any certified user on staff could create and publish dashboards, and then share them in a governed, secure manner—no programming skills required.

Working with a trial version of Tableau as proof of concept led to more analysts getting licenses and greater proliferation of certified dashboards. This initial use coupled with embedding early adopters in business groups sparked greater requests for Tableau to create company-wide momentum. “The fast adoption is how I knew we were on to something,” said Isaac. “The solution was in sync with our ideology of opening up access to data.” Almost half of the company uses it today. Of those users, nearly 70 percent are in Tableau weekly, and 25 percent daily.
With that momentum also came the realization that they should migrate to the cloud as Tableau Server on AWS offers the flexibility, scalability and cost-efficiency needed to handle their massive data sets and maintain data security and compliance.
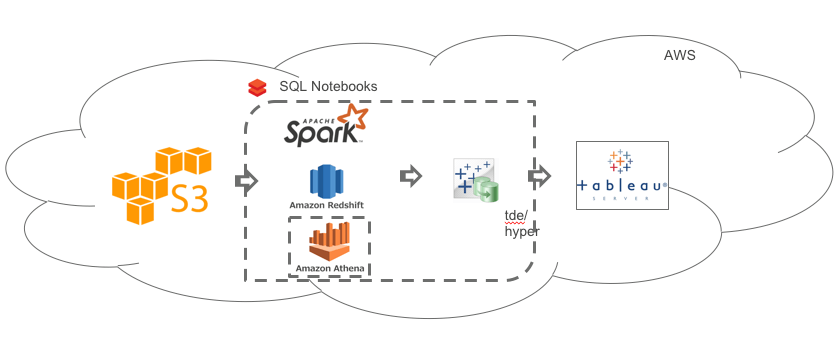
The first key step was the migration of Edmunds.com and back-end systems to AWS Cloud, and it didn’t stop there. Edmunds now employs other Amazon solutions like Amazon EBS, Amazon S3 and Amazon Athena for block-level storage volumes, long-term data storage, and serverless, interactive queries of large data sets, respectively. And with Tableau Server in the mix, Amazon Redshift entered the picture.
The powerful combination of these solutions means that Edmunds understands their data at lower costs and doesn’t have to rely on many data engineers to uncover answers for the business. “AWS and Tableau offer us data democratization, along with a scalable, cost-effective infrastructure to support everything,” stated Isaac. Edmunds has also begun to use Hyper, Tableau’s new in-memory data engine technology, designed for fast data ingestion and analytical query processing on large, complex data sets. As adoption is underway, they’re excited to see results soon.

To learn more about the benefits of integrating Amazon Redshift and Tableau to analyze large data sets and quickly drive better business outcomes, check out our whitepaper.
Edmunds uncovers truth behind traffic decreases with Tableau
Monitoring daily traffic patterns is important to Edmunds. There are many contributing factors that impact traffic spikes or decreases, but determining the root cause(s) was a challenge.
Last year, the site had decreases in users that were initially attributed to the Florida and Texas hurricanes, Irma and Harvey. Leadership used to review the information and make educated guesses that were vetted with an analyst for validation or further exploration. Having multiple ways to filter and assess the data in a live environment with Tableau, looking at traffic from state-to-state and across different browsers, Edmunds realized the same drop happened outside of the states impacted by the hurricanes and on all browsers.
Probing deeper on the data by splitting traffic by paid as well as organic soon uncovered a paid marketing drop triggered by a site bug not capturing user clicks. Had there not been a self-service environment to ask and explore their questions, the truth may not have been discovered and a solution put into place.
With cloud-based data democratization, Edmunds flourishes, enhancing customer and partner connections
Edmunds has been impressed with AWS for what they call the “last mile processing” of data—the application of business rules, filters, and other report rules that feed the data stack and output of dashboards to Tableau Server. The combination of using AWS and Tableau has positively impacted Edmund’s business growth and strategy.
Tableau adoption is exploding with this satisfaction as every business unit at Edmunds now uses it. “Tableau, I have to say, is one of the best things to happen for the company in terms of analytics,” added Isaac.
Together, Tableau and AWS create an optimal data infrastructure that supports analysis and exploration, which has made a critical difference with Edmunds’ customer service and commitment to making the car buying process simple and painless. And by offering self-service visual analytics enabled by Tableau to make trusted data access easier for the whole enterprise, Edmunds has more content staff, customers, and partners.
相關文章
Subscribe to our blog
在收件匣中收到最新的 Tableau 消息。


