DataFam Roundup: May 27–31, 2024


Welcome! Dig into this week's DataFam Roundup—a weekly blog that brings together community content all in one post. As always, we invite you to send us your content—and the DataFam content from your peers that have inspired you! Find the content submission form here.
Community Highlight
To recognize new and consistent Tableau contributors—we’re excited to have a section within the weekly DataFam Roundup called the Tableau Community Highlight. Find out how to get involved.

Joy (Jhoie) Victor, Data Analyst at DataedX Group
Kaduna State, Nigeria
Joy (Jhoie) Victor is a Data Analyst at DataedX Group, where she focuses on their AIAI Network Public Interest project. She uses Tableau to examine data quality management and transparency issues in relation to the Atlanta BeltLine. Joy is involved in the Tableau Community through Tableau User Groups, by sharing content on her blog, being active on the Tableau Forums, and publishing content on Tableau Public.
When starting her Tableau journey, Joy felt inspired by all of the amazing vizzes she was seeing, but she had a hard time grasping how to recreate them. She later discovered that this was a common struggle among new Tableau users so she started a blog to solve that problem. She creates content aimed at helping Tableau newbies better navigate their journeys, by interviewing Tableau experts, writing engaging tutorials, and in-depth documentation of cutting-edge Tableau solutions.
Most recently, Joy has become a founding leader of the AI + Tableau User Group. She hopes to further the conversation about the future of AI in the data industry through her involvement in this TUG. The AI + Tableau User Group is having its inaugural meeting on Monday, June 3. Find more details on how to join here.
Connect with Joy on Linkedin, X, Tableau Public, and on her blog.
DataFam content
Dive into content created by the Tableau Community:
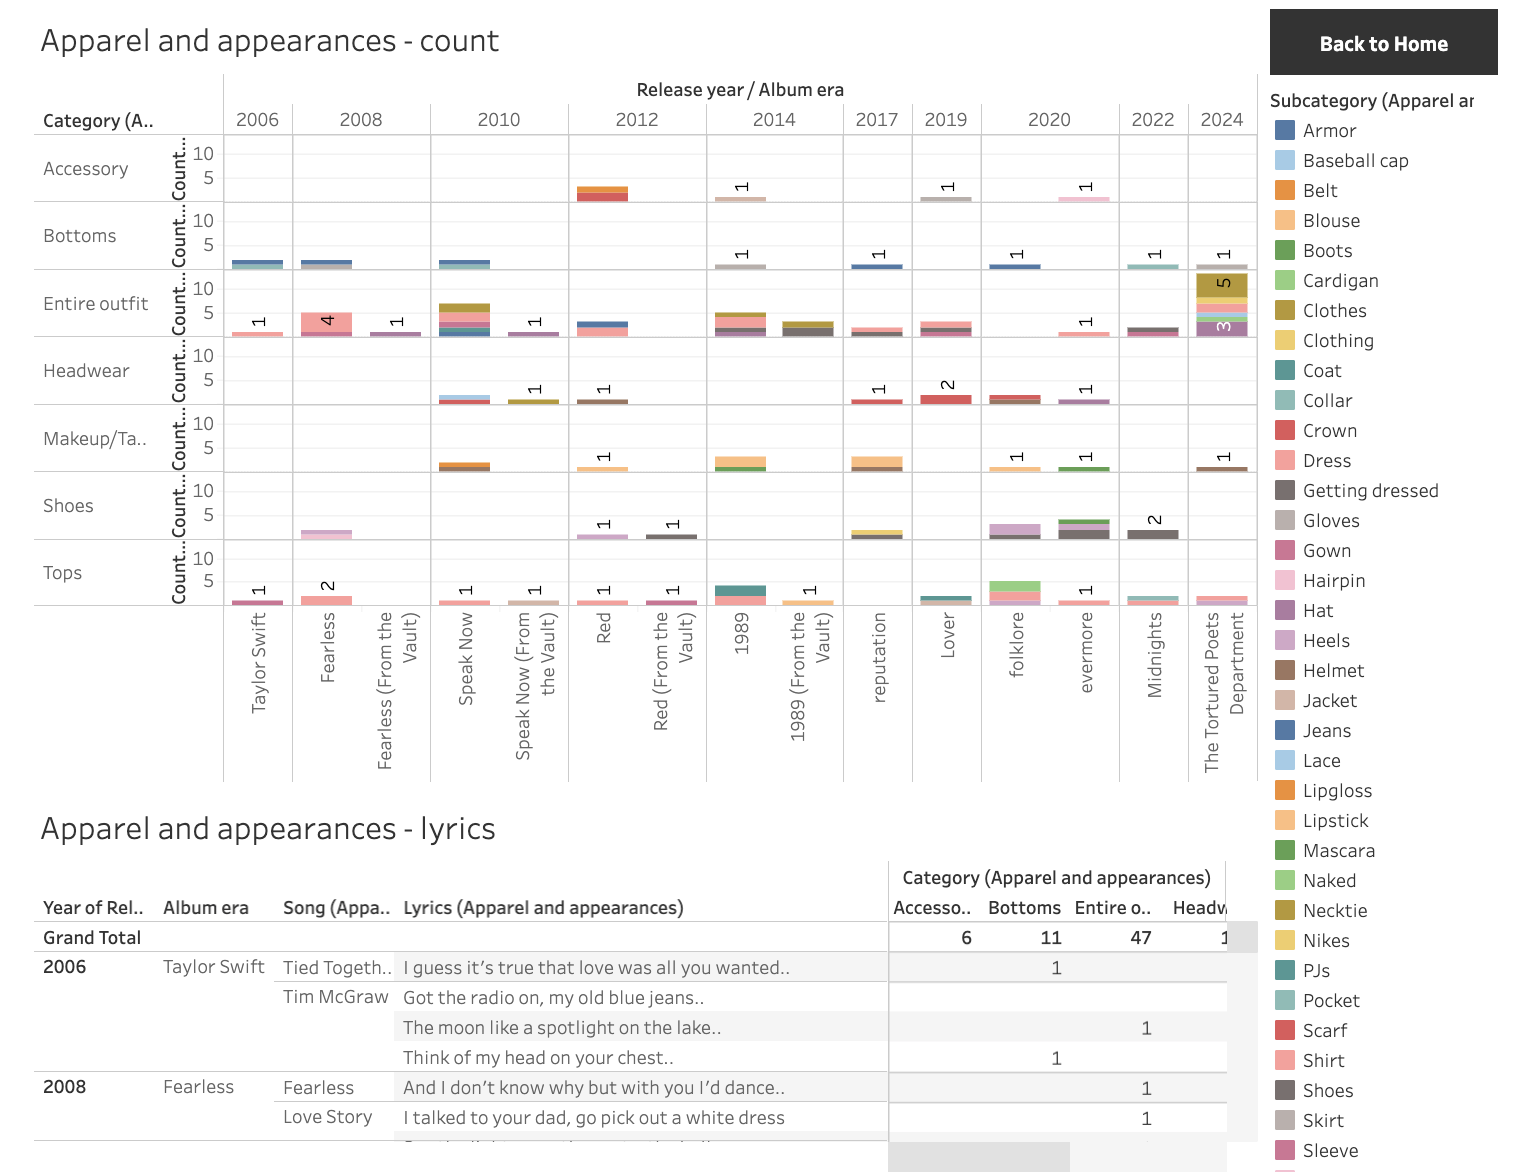
Maxx Ramos: Motifs in The Tortured Poets Department by Taylor Swift (with data)
-
Will Sutton, The Information Lab: Is AI The Death of the Data Analyst?
-
Maxx Ramos: Motifs in The Tortured Poets Department by Taylor Swift (with data)
-
The Flerlage Twins: How I Design an Actuals vs Target Chart
-
Louis Yu: Secrets of the Viz: Love Across the Eras
-
Tim Ngwena, Tableau Tim: S5 E2: Byte: 2024 Tableau Conference Debrief
-
Ayodeji Omokehinde: From This to That: The Power of Discrete Placeholders in Tableau
-
Priyanka Dobhal: Mastering Drill Down in Tableau
-
Eric Balash, Data After Hours: Episode 5 - Chantilly Jaggernauth
-
Lindsay Betzendahl, Viz Zen Data: Coloring the Ends of a Bar Chart in Tableau
-
CJ Mayes: Soccer Analytics With Nick Van Lieshout #SportsVizSunday
-
Slalom Salesforce: Optimizing data models for Tableau dashboard performance
-
Deepak Holla: Tableau Prep Builder Topic: Cleaning Operations possible in the Input Step
-
Frederic Fery: Create a Tableau map with Garmin GPX files
Team Tableau
Upcoming events and community participation
-
Lights, Camera, Action: Tableau and IMDb Launch Data Visualization Campaign for Movie Lovers
-
DataFam Birthday Roundup! In the effort of continuing support for one another, we thought it would be fun to gather data on DataFam birthdays! If you're willing, could you let us know which day you celebrate your birthday? Just go ahead and pick the day from this year's calendar, since it's a leap year and all possible days are available to choose from!
-
Mentorship Program by the Data Visualization Society
-
Women in Dataviz Virtual Coffee Breaks: Held every sixth Thursday morning and every sixth Wednesday afternoon in the EST time zone, Virtual Coffee Breaks are a casual networking event. Feel free to drop in and out as you need toduring the hour, and stay for as little time or as long as you want.
Vizzes
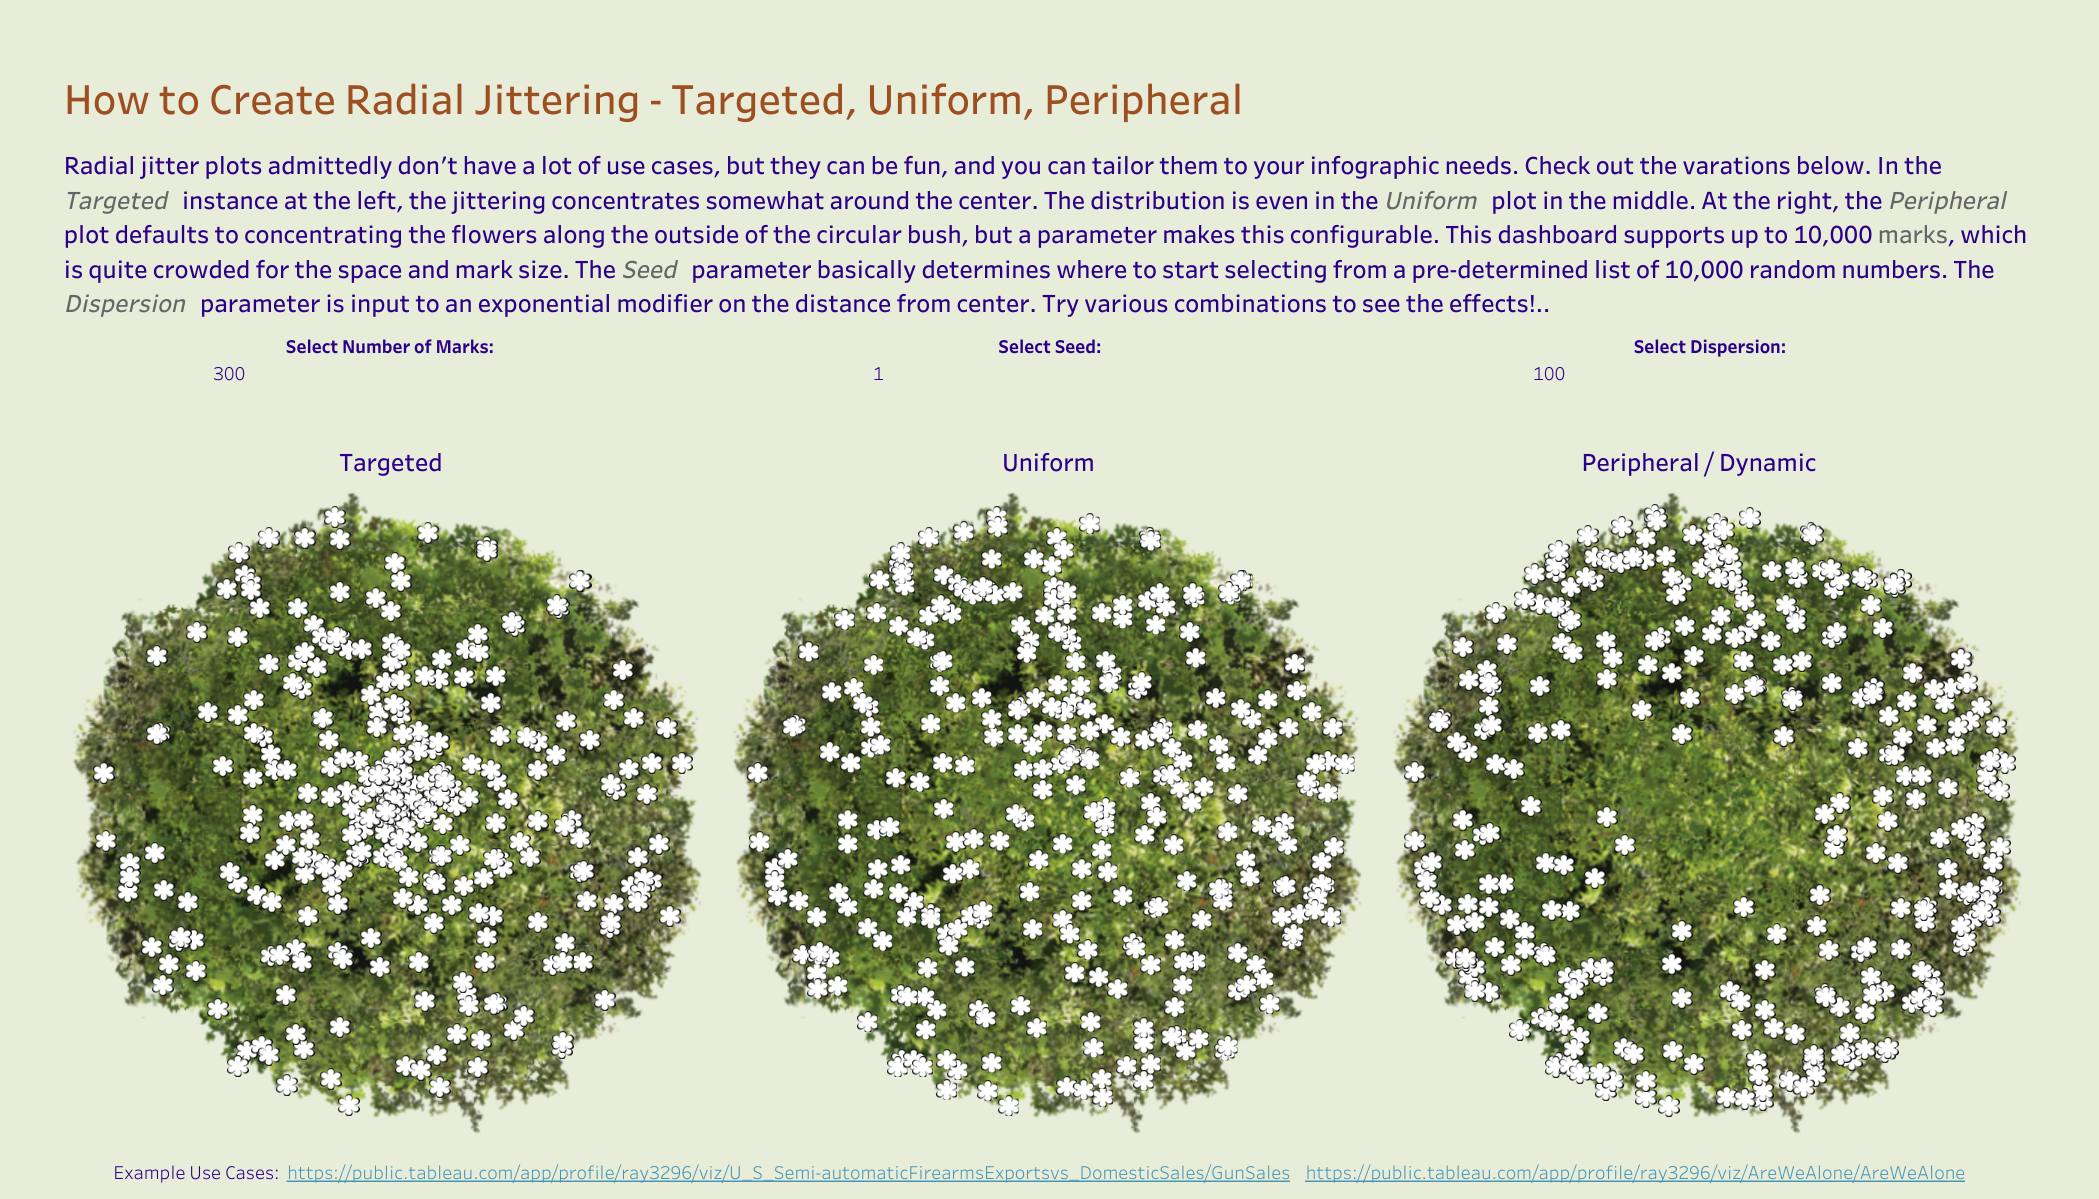
Ray Givler: How to Create Radial Jittering
See the latest Viz of the Day, trending vizzes, featured authors, and more on Tableau Public.
Check out some inspirational vizzes created by the community:
-
Ray Givler: How to Create Radial Jittering
-
Shangruff Raina: HOW MUCH SHOULD PEOPLE IN THE US SHOULD EARN TO BUY A HOME? || #MakeoverMonday 2024 Week 22
-
Anna Mandoki: US Home Affordability by Metro Area #MakeoverMonday
-
Muhammad Azhar: Studying & Living in Europe 2023
-
Cintra Jaggernauth: Iceberg Sightings | #B2VB
-
Will Sutton: The Moods of Midgar | Character Sentiments in Final Fantasy 7 | #GamesNightViz
-
Dennis Kao: Quality of Life of Nigeria's Deaf Community
-
Neil Richards: Crane Point
-
Arshi Saleh: Echoes of Silence - #VizforSocialGood
Community Projects
Back 2 Viz Basics
A bi-weekly project helping those who are newer in the community and just starting out with Tableau. Not limited just to newbies!
Web: Back 2 Viz Basics
X: #B2VB
Week 11: Use Color Purposefully
Workout Wednesday
Build your skills with a weekly challenge to re-create an interactive data visualization.
Web: Workout Wednesday
X: #WOW2022
Week 22: Can You Make a Page Navigator?
Preppin' Data
A weekly challenge to help you learn to prepare data and use Tableau Prep.
Web: Preppin’ Data
X: #PreppinData
Week 22: Top 5 Loyal Customers
Makeover Monday
Create business dashboards using provided data sets for various industries and departments.
Web: Makeover Monday
X: #MakeoverMonday
Week 22: Homebuyers Must Earn $115,000 to Afford the Typical U.S. Home. That’s About $40,000 More Than the Typical American Household Earns
DataFam Con
A monthly challenge covering pop culture and fandoms.
Web: DataFam Con
X: #DataFamCon
March 2024 Challenge: Sports Movies Edition
EduVizzers
A monthly project connecting real education data with real people.
Web: Eduvizzers
May 2024: FAFSA® Completion by High School and Public School District
Viz for Social Good
Volunteer to design data visualizations that help nonprofits harness the power of data for social change.
Web: Viz for Social Good
X: #VizforSocialGood
May 2 - June 6, 2024: Global Deaf Research Institute
Games Night Viz
A monthly project focusing on using data from your favorite games.
Web: Games Nights Viz
X: #GamesNightViz
Season 2: With great power comes great vizzes
Iron Quest
Practice data sourcing, preparation, and visualization skills in a themed monthly challenge.
Web: Iron Quest
X: #IronQuest
Women
Storytelling with Data
Practice data visualization and storytelling skills by participating in monthly challenges and exercises.
Web: Storytelling with Data
X: #SWDChallenge
April 2024: Napoleon's April
Project Health Viz
Uncover new stories by visualizing healthcare data sets provided each month.
Web: Project Health Viz
X: #ProjectHealthViz
Diversity in Data
An initiative centered around diversity, equity & awareness by visualizing provided datasets each month.
Web: Diversity in Data
X: #DiversityinData
Sports Viz Sunday
Create and share data visualizations using rich, sports-themed data sets in a monthly challenge.
Web: Sports Viz Sunday
X: #SportsVizSunday
Real World Fake Data
Create business dashboards using provided data sets for various industries and departments.
Web: Real World Fake Data
X: #RWFD
2024 - Admin Insights
Data Plus Music
A monthly project visualizing the data behind the music we love!
Web: Data Plus Music
X: #DataPlusMusic
相關文章

DataFam Roundup: February 24-28, 2025

DataFam Roundup: February 17-21, 2025

DataFam Roundup: February 10-14, 2025
Subscribe to our blog
在收件匣中收到最新的 Tableau 消息。