DataFam Roundup: January 9-13, 2023
Welcome! Dig into this week's DataFam Roundup—a weekly blog that brings together community content all in one post. As always, we invite you to send us your content—and the DataFam content from your peers that have inspired you! Find the content submission form here.
DataFam content
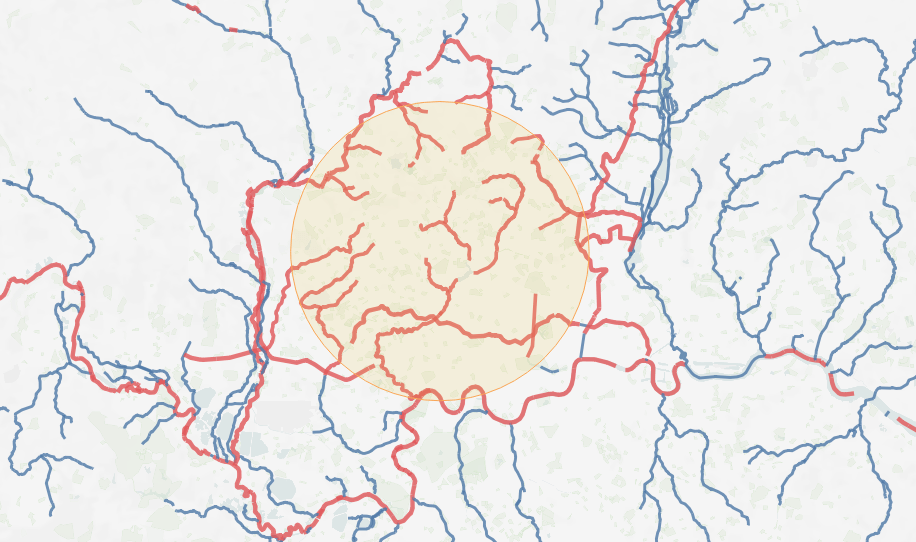
Marc Reid: Intersects Spatial Function
Dive into content created by the Tableau Community:
-
Tableau Tips: Three ways to get rid of the “Abc”s! #tableau #tableautips
-
Nicole Lillian Mark: Meet the DataFam 05: Dennis Kao
-
Nicole Klassen: IronViz Tips from a Top 15 Finisher
-
Antonis Angelakis: Run python scripts and use output tables with Tableau Table Extension
-
Games Night Viz Team: #GamesNightViz GNV Special Awards: Our #IronViz Favorites
-
Marc Reid: Intersects Spatial Function
-
Ann Pregler: Using Icons to change parameters (with parameter actions)
-
Will Sutton: Radial Heatmap Generator
-
Chimdi Nwosu, VizSight: #MakeoverMonday 2022 Week 51 – People with No Religious Affiliation.
-
Rosario Gauna:
-
Gurpreet Singh: Tableau Rank Functions
-
Ant Pulley: My 2022 Review – That was pretty good!!
-
Steve Wexler, Data Revelation: Getting SurveyMonkey data to play nicely with Tableau
-
Nicola Osinaike,
-
Be Data Lit: Psychology is the Key to Data Literacy
-
The Data Leadership Collaborative: Ethical AI: No Longer Optional
-
-
Abisola Oni, Laura Madsen and David Pires, The Data Leadership Collaborative: How to be a Data Leader
-
Christian Silva& Marc Montanari, The Data Coffee Break Podcast: #12 - Top Data Trends for 2023 with Ivan Coelho
-
Prasann Prem: Tableau Buddy Calculation Guide Part-1
-
Vignesh Suresh: PROPER() Function: The Game Changer. New in Tableau 2022.4
-
Annabelle Rincon, Rativiz: Inspiration is everywhere
-
Andy Kriebel, VizWiz: How to Create a Two Color Area Chart in Tableau
-
Laurie Rugemer: Uncorking the Genie
-
Jim Dehner: Dynamic Zone Visibility Use Cases
-
CJ Mayes: More Chord Variations
-
Alexander Mou, Vizible Difference: Fiscal Calendar Calculations Cheatsheet for Tableau
-
Zach Bowders,
-
Sruti Deka: Tableau Dashboard Optimization
-
Kevin Flerlage, The Flerlage Twins: 3 Methods for Excel Download Buttons in Tableau
-
Manali Mahakalkar: The Ultimate Guide to Learn CRM Analytics
-
Dawn Harrington, Tech Tips Girl: Great Tableau Public Business Vizzes
-
Sadie St. Lawrence, The Data Leadership Collaborative: 5 Data Trends to Watch in 2023
-
Marco Giardina: How to Connect to PostgreSQL inTableau in 4 Easy Steps
-
Ross Helenius: How Well Does ChatGPT Know Tableau?
-
Ethan Lang, WeeklyTableauTip: Creating a Waterfall in Tableau
Team Tableau
-
Students—Use These 3 Data Best Practices to Take Your Skills to the Next Level
-
Help raise the bar of the possible: Apply or nominate others to become a Tableau Visionary
Upcoming events and community participation
-
Community Calendar and Upcoming Events: stay up-to-date on the latest Women in Dataviz events and other data visualization-related events. If you'd like to submit an event to the calendar, please fill out this form.
Vizzes
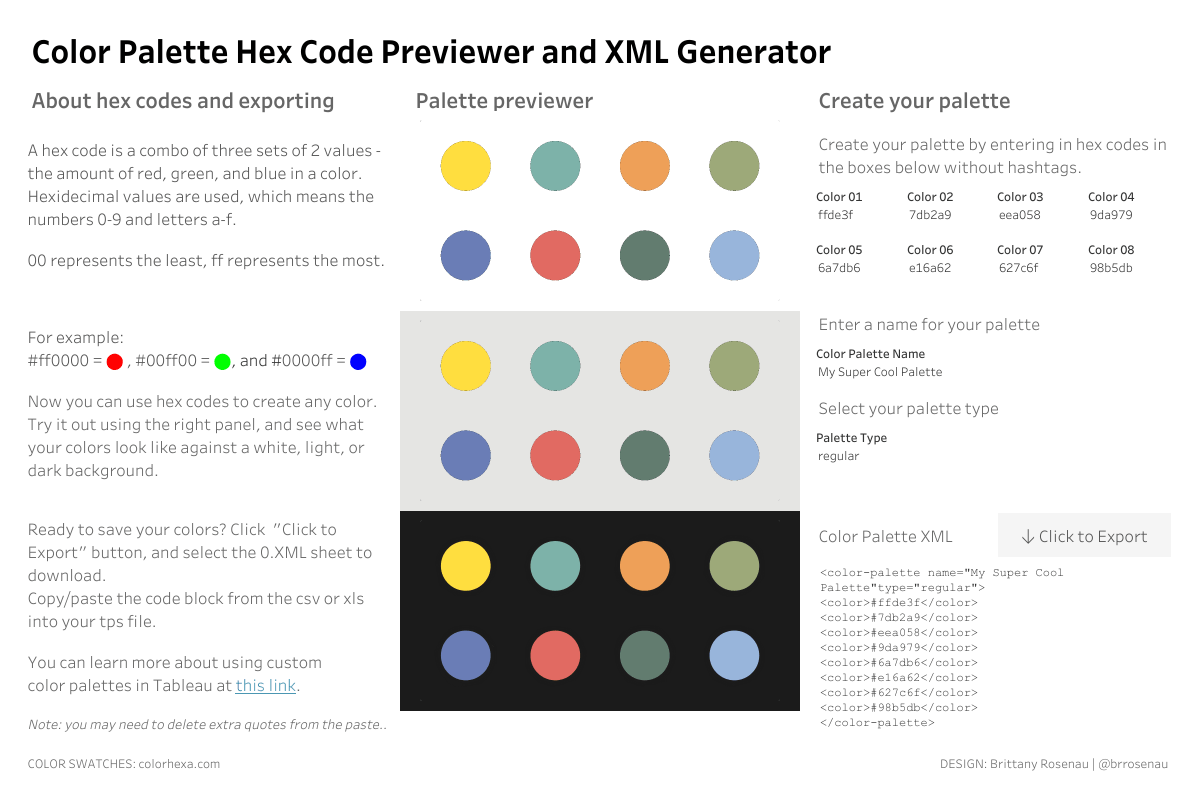
Brittany Rosenau: Hex Code Previewer + XML Generator
See the latest Viz of the Day, trending vizzes, featured authors, and more on Tableau Public.
Check out some inspirational vizzes created by the community:
-
Chimdi Nwosu: 5 Design Overhauls to Improve Business Dashboards (#TFF Presentation)
- Kevin Wee 黃克文: #B2VB Dynamic Pixel Art Connected to a Submission Record Punched Card
-
Brittany Rosenau: Hex Code Previewer + XML Generator
-
Jessica Moon: Circles of Engagement
-
Varun Jain: Astronomy Calendar 2023 | Build your own calendar | #ReVizIt
-
Chris Westlake: Goal Tracking 2023 - A template for goals
-
Candice che: Cat's Secret Life #IronQuest
-
Vinodh Kumar: Tableau Book of Functions
-
Kevin Flerlage: 5 Years on Tableau Public
-
Nicole Klassen: The Music of Doctor Who
-
Sean Miller: The #DataFam Mixtape
-
Toludoyin Shopein: RWFD | Call Center
Community Projects
Back 2 Viz Basics
A bi-weekly project helping those who are newer in the community and just starting out with Tableau. Not limited just to newbies!
Web: Back 2 Viz Basics
Twitter: #B2VB
Week 25: Use an Image
Workout Wednesday
Build your skills with a weekly challenge to re-create an interactive data visualization.
Web: Workout Wednesday
Twitter: #WOW2022
Week 49: Can you make a pie chart?
Makeover Monday
A weekly social data project.
Web: Makeover Monday
Twitter: #MakeoverMonday
Week 49: How Americans Perceive Demographics
Preppin' Data
A weekly challenge to help you learn to prepare data and use Tableau Prep.
Web: Preppin’ Data
Twitter: #PreppinData
Week 49: Cleaning Status History (HR month)
DataFam Con
A monthly challenge covering pop culture and fandoms.
Web: DataFam Con
Twitter: #DataFamCon
November 2022: Don’t blink, or you’ll miss traveling through space & time.. and data!
EduVizzers
A monthly project connecting real education data with real people.
Web: Eduvizzers
December 2022: Salaries by College Type
Games Night Viz
A monthly project focusing on using data from your favorite games.
Web: Games Nights Viz
Twitter: #GamesNightViz
October 2022: IronViz Edition: Tips from the Team
Iron Quest
Practice data sourcing, preparation, and visualization skills in a themed monthly challenge.
Web: Iron Quest
Twitter: #IronQuest
November 2022: Weird or Wonderful
Public Policy Viz
Bridging the gap between analytics professionals and policy practitioners.
Web: Public Policy Viz
Twitter: #PublicPolicyViz
Project 1: Redlining in Pittsburgh, PA
Data Plus Music
A monthly project visualizing the data behind the music we love!
Web: Data Plus Music
Twitter: #DataPlusMusic
July 2022: The Intro
Storytelling with Data
Practice data visualization and storytelling skills by participating in monthly challenges and exercises.
Web: Storytelling with Data
Twitter: #SWDChallenge
November 2022: comedic charts
Project Health Viz
Uncover new stories by visualizing healthcare data sets provided each month.
Web: Project Health Viz
Twitter: #ProjectHealthViz
August 2022: Mental Health Care Professionals Shortages
Diversity in Data
An initiative centered around diversity, equity & awareness by visualizing provided datasets each month.
Web: Diversity in Data
Twitter: #DiversityinData
September 2022: Global Women
Sports Viz Sunday
Create and share data visualizations using rich, sports-themed data sets in a monthly challenge.
Web: Sports Viz Sunday
Twitter: #SportsVizSunday
October 2022: Row, row, row your boat
Viz for Social Good
Volunteer to design data visualizations that help nonprofits harness the power of data for social change.
Web: Viz for Social Good
Twitter: #VizforSocialGood
Sept 2-Sept 30 2022: India Water Portal/Arghyam
Real World Fake Data
Create business dashboards using provided data sets for various industries and departments.
Web: Real World Fake Data
Twitter: #RWFD
Session 3: Community Service Requests
SDG Viz Project
Visualize data about Sustainable Development Goals provided by the World Health Organization.
Web: SDG Viz Project
Twitter: #TheSDGVizProject
相關文章
Subscribe to our blog
在收件匣中收到最新的 Tableau 消息。


