DataFam Roundup: February 14 - 18, 2022


Welcome! Dig into this week's DataFam Roundup—a weekly blog that brings together community content all in one post. As always, we invite you to send us your content—and the DataFam content from your peers that have inspired you! Find the content submission form here.
DataFam content
Autumn Battani, phData: How to Make Custom Sorting Headers in Tableau
Dive into content created by the Tableau Community:
- Allen Hillery & Sarah Nell-Rodriquez, Be Data Lit: All the Data Ladies (with Catherine d’Ignazio and Lauren Klein)
- Tyler Garrett: Micro Python Tools in Tableau Desktop
- FELIPE DOMINGUEZ TOLEDO: ¿Cómo hacer un diagrama de embudo en Tableau? (How to make a funnel plot in Tableau?)
- Ajay Manshani: BUTTERFLY CHART IN TABLEAU | STEP BY STEP TUTORIAL
- Gaurav Sahani: Build a Tableau Dashboard | Pokemon Data Analysis
- Nir Smilga: Minecraft- Block Dist per Layer - The making
- Autumn Battani, phData: How to Make Custom Sorting Headers in Tableau
- Pete DeOlympio, Cleartelligence: Doing Moore with Data: Interviewing a Tableau Power Couple
- The Flerlage Twins: Ten Tableau Tips & Techniques - Round 4
- Brittany Rosenau: The Story of Film — Building my Iron Viz 2022
- Matt Francis, Matt's World of Viz: Why Background Colours Matter In DataViz
- Jared Flores, WhatTheViz: How I Used Tableau Prep In #IronViz 2022: Put Some Prep In Your Step
Team Tableau
- Honoring Black History Month with the Tableau Community
- Explore the Iron Viz entries on Visualizing the Arts
Upcoming events and community participation
- Stay up to date with the latest and greatest from the Tableau Community. We'll help you along in your Tableau journey, bring your data skills to the next level, and nurture powerful connections.
- Sign up to be a panelist for the 3charts@3 Live: A Mystery Chart Show featuring topics like personal finance, energy, healthcare and more!
- Join the Data Book Club for a Live Q&A on February 22 at 9am PST with author and storyteller, Cole Nussbaumer Knaflic.
- Calling all DataDevs: Join Tableau at TrailblazerDX 2022, April 27–28 in San Francisco—or virtually from anywhere—to boost your skills and celebrate with other builders, creators, and makers.
Vizzes
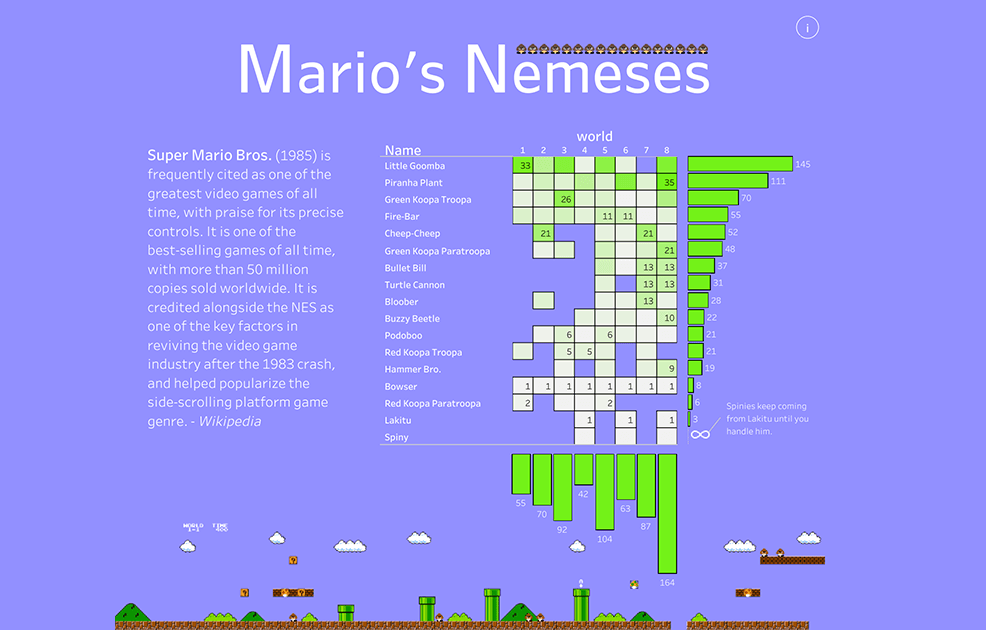
Joshua Preston: Mario's Nemeses #GamesNightViz
Catch this week’s Viz of the Days here and subscribe to get them emailed directly to your inbox.
Check out some inspirational vizzes created by the community:
- Jacob Turner: Find True Love in SKYRIM
- Dennis Kao: Snow Patrol Run - MIDI Analysis | #DataPlusMusic
- Han: Endangered species
- Joshua Preston: Mario's Nemeses #GamesNightViz
- Wendy Shijia 汪士佳: The Entertainer #dataplusmusic
- Jeremy Poole: #DATA22 Who is in Town?
- Sean Miller - @HipsterVizNinja: MIDI - Jurassic Park
- Ervin Vinzon: A Whole New World
- Mark Bradbourne (he/him): Queen - Bohemian Rapsody
Community Projects
DataFam Con *COMING SOON!
A monthly challenge covering pop culture and fandoms. First topic is launching February 21st!
Web: DataFam Con
Twitter: #DataFamCon
EduVizzers *NEW!
A monthly project connecting real education data with real people.
Web: Eduvizzers
February 2022: Level 1 dataset: Bright Green Future Grant Data
Level 2 dataset: American Community Survey – Mean Income in the Past 12 Months
Back 2 Viz Basics
A bi-weekly project helping those who are newer in the community and just starting out with Tableau. Not limited just to newbies!
Web: Back 2 Viz Basics
Twitter: #B2VB
Week 4: Design Some KPIs
Data Plus Music
A monthly project visualizeing the data behind the music we love!
Web: Data Plus Music
Twitter: #DataPlusMusic
February 2022: MIDI Music Analysis
Games Night Viz
A monthly project focusing on using data from your favorite games.
Web: Games Nights Viz
Twitter: #GamesNightViz
February 2022: Level 2: Hello World
Workout Wednesday
Build your skills with a weekly challenge to re-create an interactive data visualization.
Web: Workout Wednesday
Twitter: #WOW2022
Preppin' Data
A weekly challenge to help you learn to prepare data and use Tableau Prep.
Web: Preppin’ Data
Twitter: #PreppinData
Week 52: Departmental Decemeber - Operations
Iron Quest
Practice data sourcing, preparation, and visualization skills in a themed monthly challenge.
Web: Iron Quest
Twitter: #IronQuest
February 2022: Re-Viz-It
Storytelling with Data
Practice data visualization and storytelling skills by participating in monthly challenges and exercises.
Web: Storytelling with Data
Twitter: #SWDChallenge
February 2022: declutter & focus
Project Health Viz
Uncover new stories by visualizing healthcare data sets provided each month.
Web: Project Health Viz
Twitter: #ProjectHealthViz
January 2022: One Year of Sleep
Diversity in Data
An initiative centered around diversity, equity & awareness by visualizing provided datasets each month.
Web: Diversity in Data
Twitter: #DiversityinData
November - December 2021: The countdown to Christmas and New Year!
SDG Viz Project
Visualize data about Sustainable Development Goals provided by the World Health Organization.
Web: SDG Viz Project
Twitter: #TheSDGVizProject
Sports Viz Sunday
Create and share data visualizations using rich, sports-themed data sets in a monthly challenge.
Web: Sports Viz Sunday
Twitter: #SportsVizSunday
February 2022: Winter Olympics
Viz for Social Good
Volunteer to design data visualizations that help nonprofits harness the power of data for social change.
Web: Viz for Social Good
Twitter: #VizforSocialGood
Real World Fake Data
Create business dashboards using provided data sets for various industries and departments.
Web: Real World Fake Data
Twitter: #RWFD
Viz 2 Educate
Each month, create vizzes on global education syllabus topics as resources for teachers worldwide.
Web: Viz 2 Educate
Twitter: #Viz2educate
February 2022: Food & Nutrition
Makeover Monday
Join the community every Monday to work with a given data set and create better, more effective visualizations.
Web: Makeover Monday
Twitter: #MakeoverMonday
相關文章
DataFam Roundup: November 11-15, 2024
 2024/11/15
DataFam Roundup: November 4-8, 2024
2024/11/08
DataFam Roundup: October 28 - November 1, 2024
2024/11/01
Subscribe to our blog
在收件匣中收到最新的 Tableau 消息。