Alert! Alert! Turn on conditional subscriptions with 1 click in Tableau 10.1
The following is a guest post by Tableau Zen Master Jonathan Drummey.
How can I get automatically notified when the work queue gets larger? How can I get alerted whenever sales drop below a threshold?
These are the kinds of questions that Tableau users have wanted to know for a long time. And they’ve resorted to building their own code or using add-on tools like Metric Insights or VizAlerts.
Tableau 10.1 begins to address these needs with the new conditional subscriptions feature. As one of the developers of VizAlerts, I’m thrilled that Tableau is building more functionality into the core product. Let me show you how you can use this new feature.
Conditional subscriptions are so easy to use they only take one checkbox to turn on: In Tableau 10.1, subscribe your viz to a schedule and click the “don’t send if view is empty” checkbox:
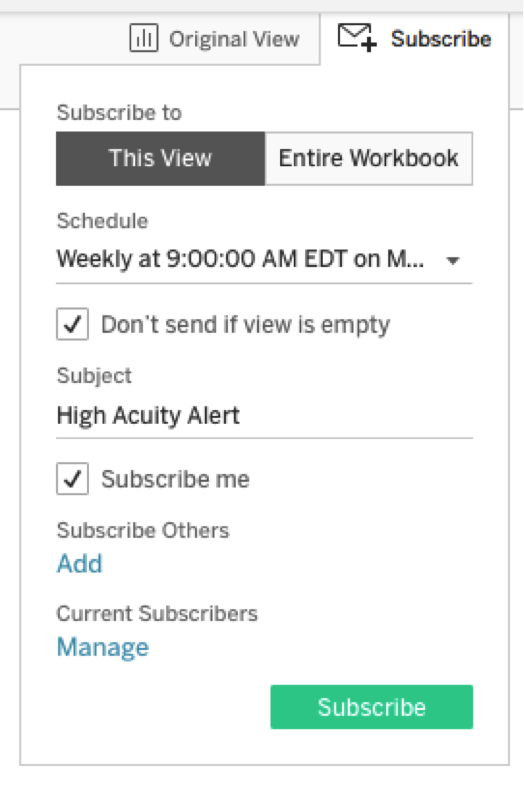
When the subscription runs, if there’s data displayed on any worksheet in the viz, then Tableau will send an email. If everything has been filtered out and the view is empty, then Tableau won’t send an email. I love checkbox labels that exactly specify what they do!
If you’ve used VizAlerts, this is essentially the same functionality as a Simple Alert in VizAlerts. The difference is that instead of having to use a special subscription in VizAlerts, you use the “don’t send if view is empty” checkbox with regular subscriptions.
Configuring the filter that drives whether the view is empty is the most complicated part. Let’s walk through an alert based on a real-world example of patient flow in a hospital's emergency department (ED).
A nurse I know was building a model to generate a rating between 1 and 5 of the workload in the ED. And it turned out that using a combination of volume and acuity (a number between 1 and 5 where 1 is the least severe and 5 the most severe) was a good start.
Using some made-up data and a variation on the model, here’s a Tableau view showing the work load at 7 a.m.:
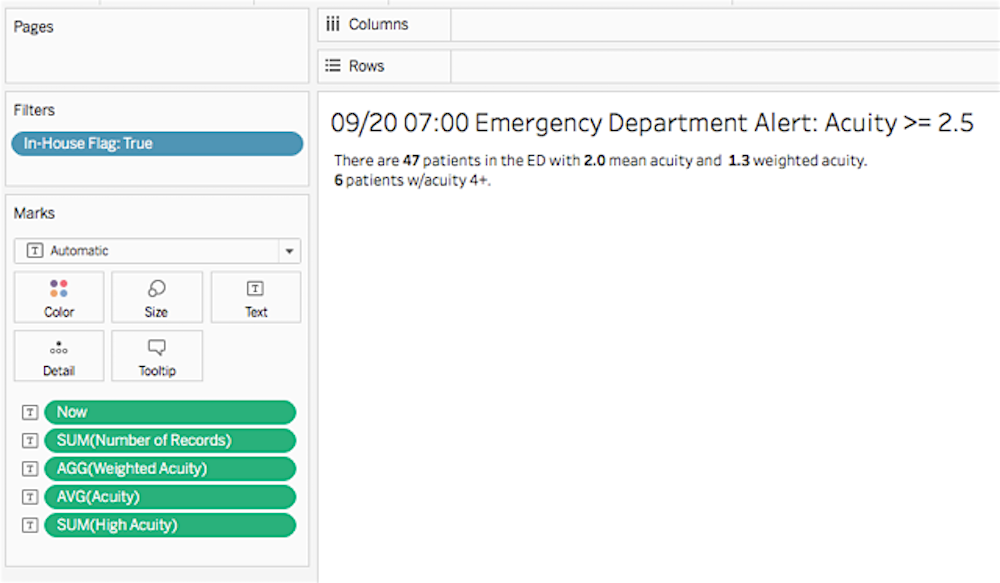
Let’s say we want to only send out the alert to administrators on an hourly basis if the work load is 2.5 or greater. That way, they can be ready to mobilize additional staff, handle patient complaints due to increased wait times, etc. In this case, all we need to do in the view is add a filter for the workload measure:
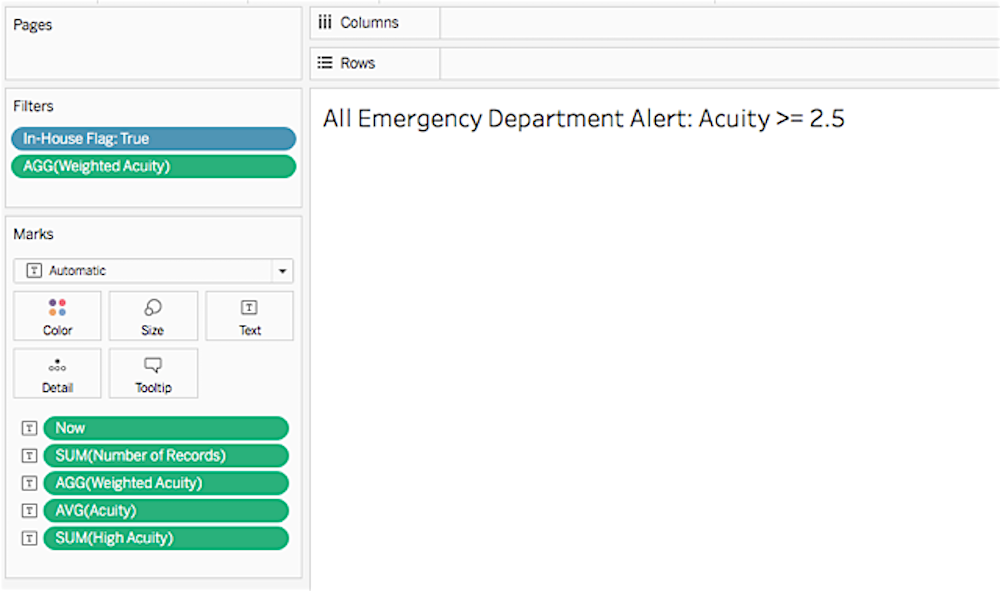
Note that Tableau is still displaying the worksheet title and has changed the time to “All.” But there is no data returned to the view itself, and that’s the important point. When Tableau Server or Tableau Online runs the subscription, it will ignore this view. When the subscription does run, for example at 9 p.m., the resulting email looks like this:
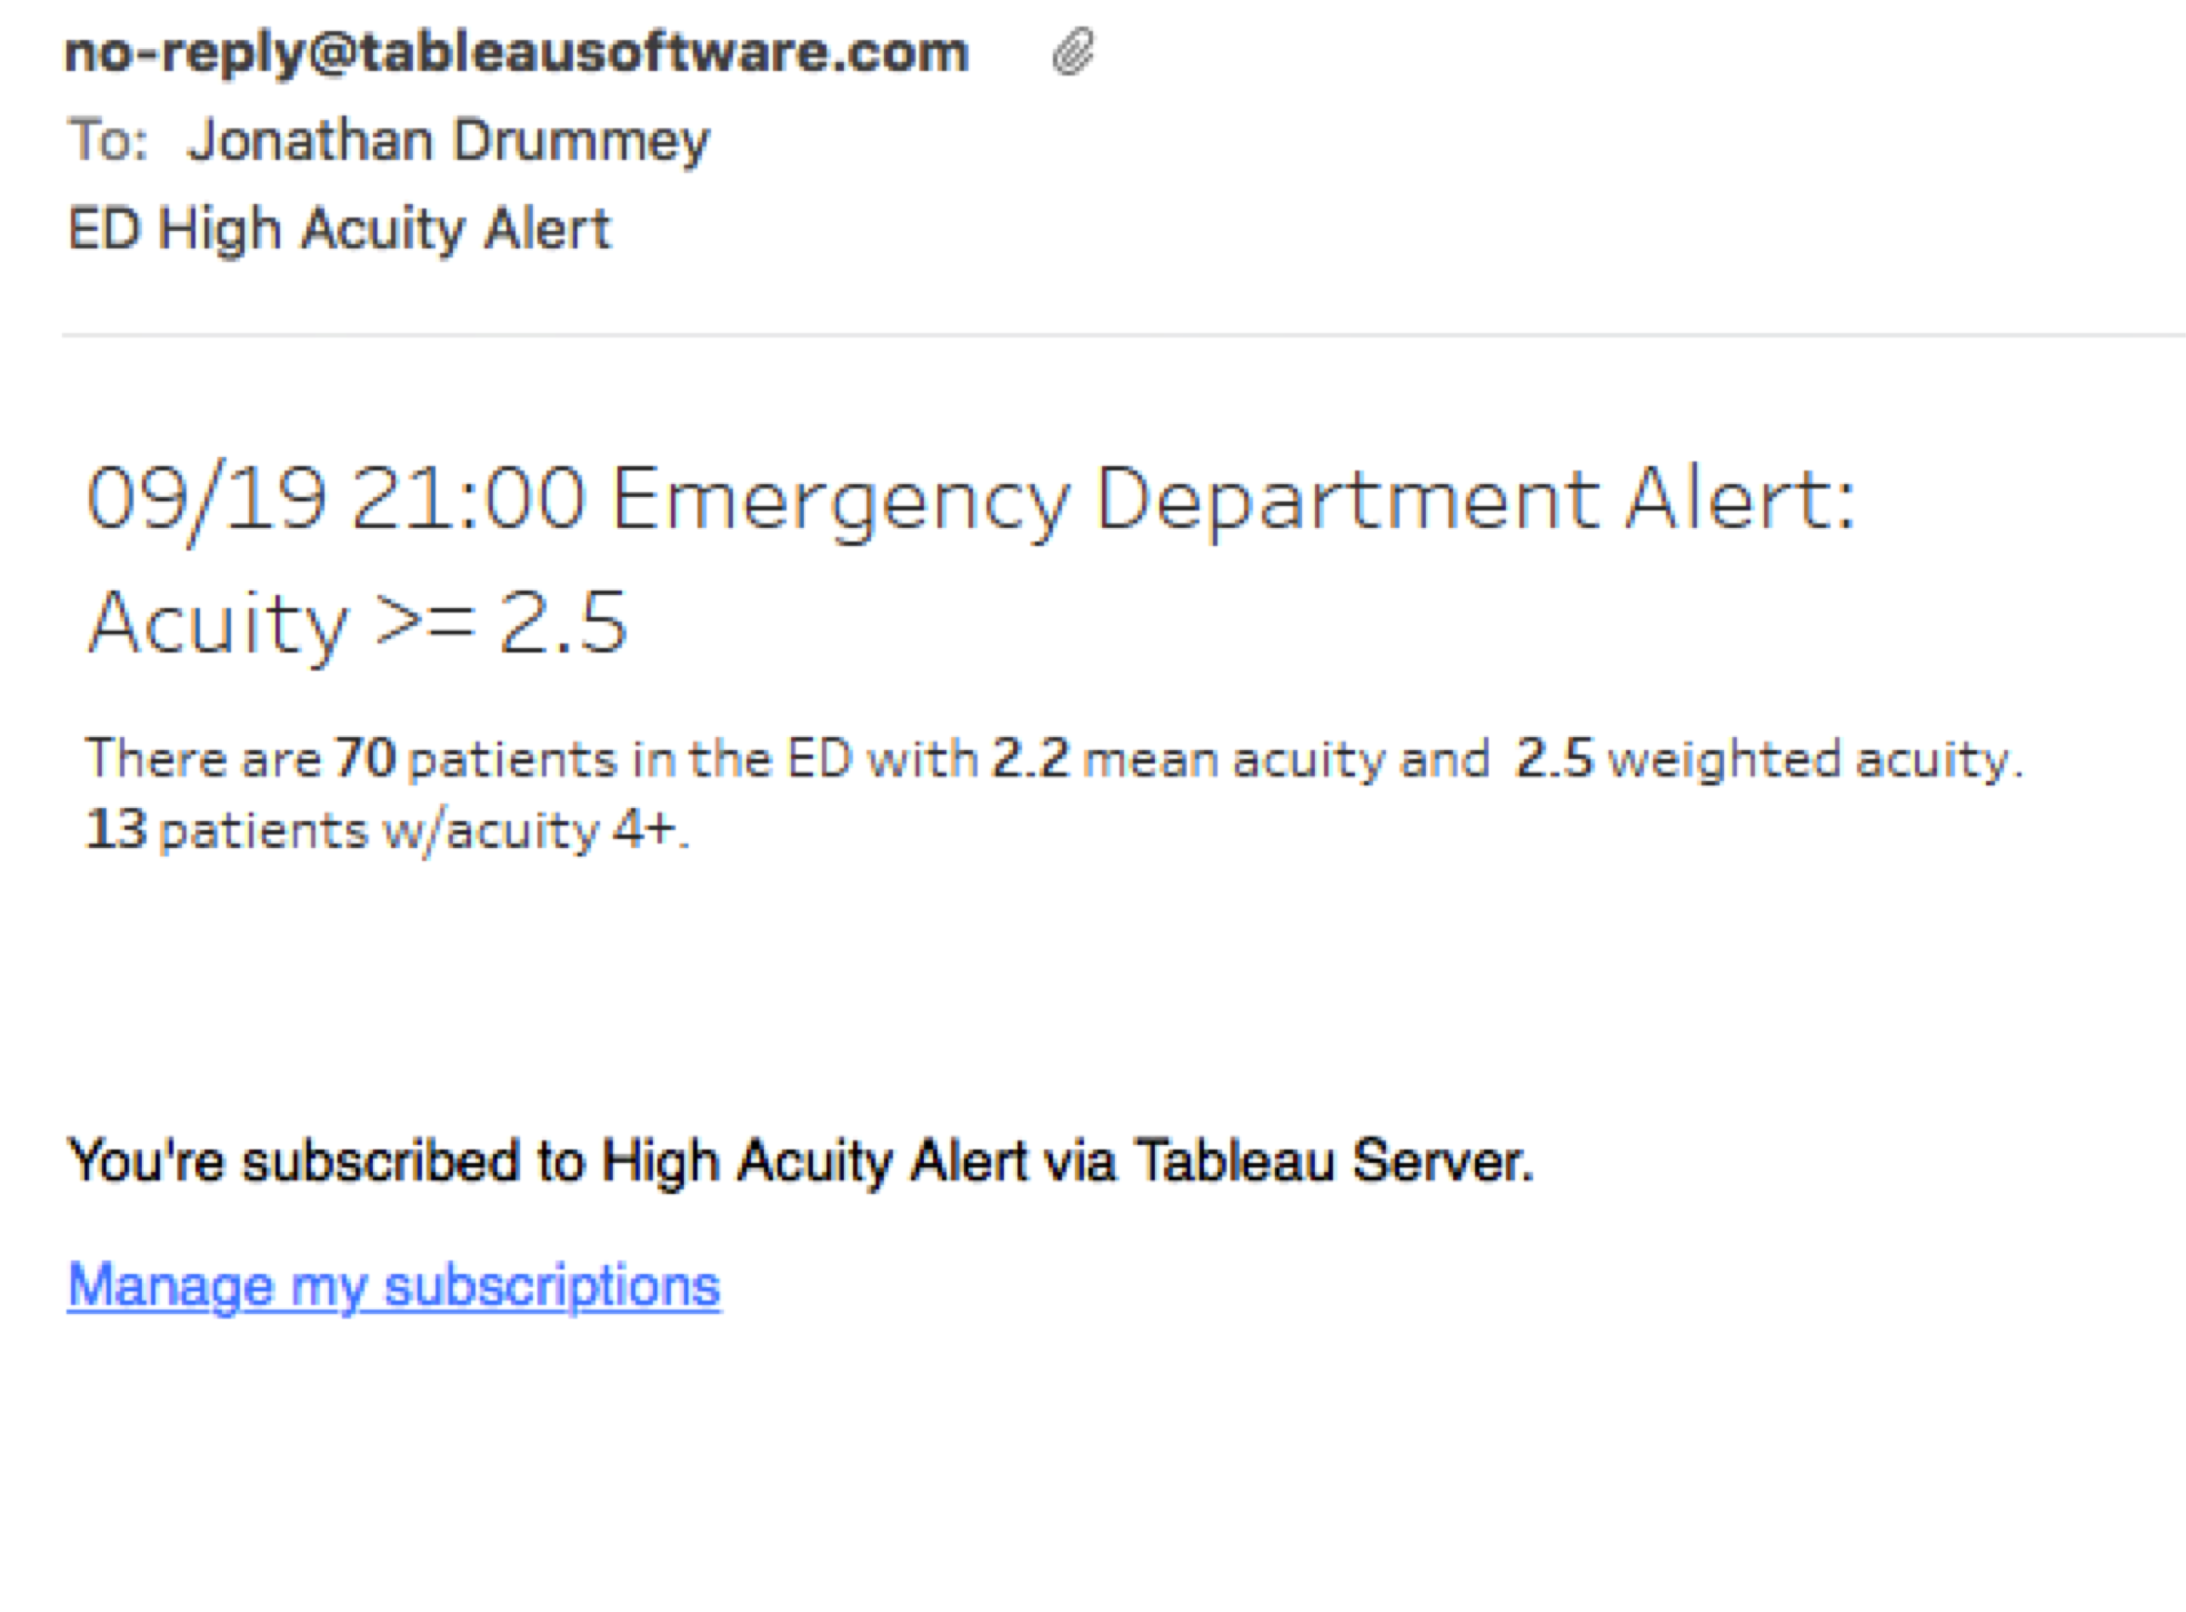
The email is just like the existing subscriptions: an image of the subscribed view that is a hyperlink back to the view, and a footer with some subscription information.
Here’s another example: Let’s say we want to notify sales staff on a daily basis only when their monthly sales quota has been met on the day prior (assuming that sales data is only updated once per day). Configuring a filter for this kind of view takes a bit more effort. In this first release of conditional subscriptions, Tableau is not tracking whether an alert has previously been sent for a given set of data. Therefore, we have to juggle several factors:
- How often the data is updated and whether there is any latency in data updates: For example, sales data might be updated every morning sometime between 7:15 a.m. and 8 a.m. based on system load.
- When the schedule runs and whether there is any latency due to Tableau Server load: Using the above example, if we set an alert to run at 7:45 a.m. every day, it might miss yesterday’s results if they weren’t updated until 8 a.m.
- The time zone of the Tableau Server or Tableau Online vis-a-vis the time zone of the user: For example, my Tableau Online server runs in Pacific Time and I’m on Eastern Time, so I need to account for that.
- Whether the data is sparse: If the data is sparse, we may need to do some padding (in the data source or using Tableau’s data densification) to ensure that calculations and titles work properly.
In this case, because we only want to send out the alert on the day after sales have exceeded the threshold and not any other day, we need to use a running sum of sales instead of a regular sum of sales. That way, we have enough data to check that we only alert sales staff on the desired day that they’ve exceeded the threshold.
Here’s the view. I’m going to focus on the key calculations:
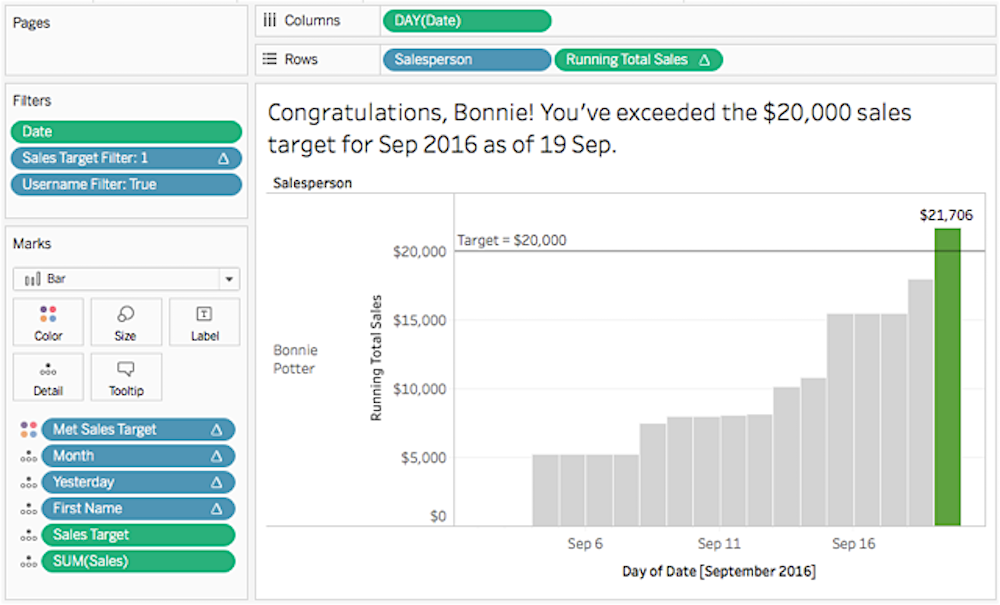
The Running Total Sales measure is the running sum quick-table calculation turned into a calculated field: RUNNING_SUM(SUM([Sales])).
The Met Sales Target Flag field has a compute using on the Date and the following formula:
//returns true when the sales target is exceeded yesterday
//sales for today are greater than target
IIF([Running Total Sales] >= [Sales Target]
// and sales for yesterday are below target (so we skip days past the first day)
AND LOOKUP([Running Total Sales],-1) [Sales Target]
// ensure that we only return the flag for yesterday
AND MIN([Date]) == TODAY()-1,TRUE, FALSE)
This only returns “true” for the day after sales have exceeded target and “false” for all other days in the month. Since the desired view is to show the running sum over the month, we can’t just drop that in the Filters shelf (we’d only show the single day that exceeded the target). Instead, we use one more table calculation to pad out the Met Sales Target Flag for the whole month for the salesperson. The Sales Target Filter also has a compute using on the Date:
//pads out the Met Sales Target Flag for all marks
//uses INT() to convert the boolean to 1/0, we'll filter for 1
WINDOW_MAX(INT([Met Sales Target Flag]))
This returns 1 or 0 for each salesperson.
Finally, to ensure that this view is only displayed for each salesperson, there’s a Username filter:
USERNAME() = [Salesperson ID]
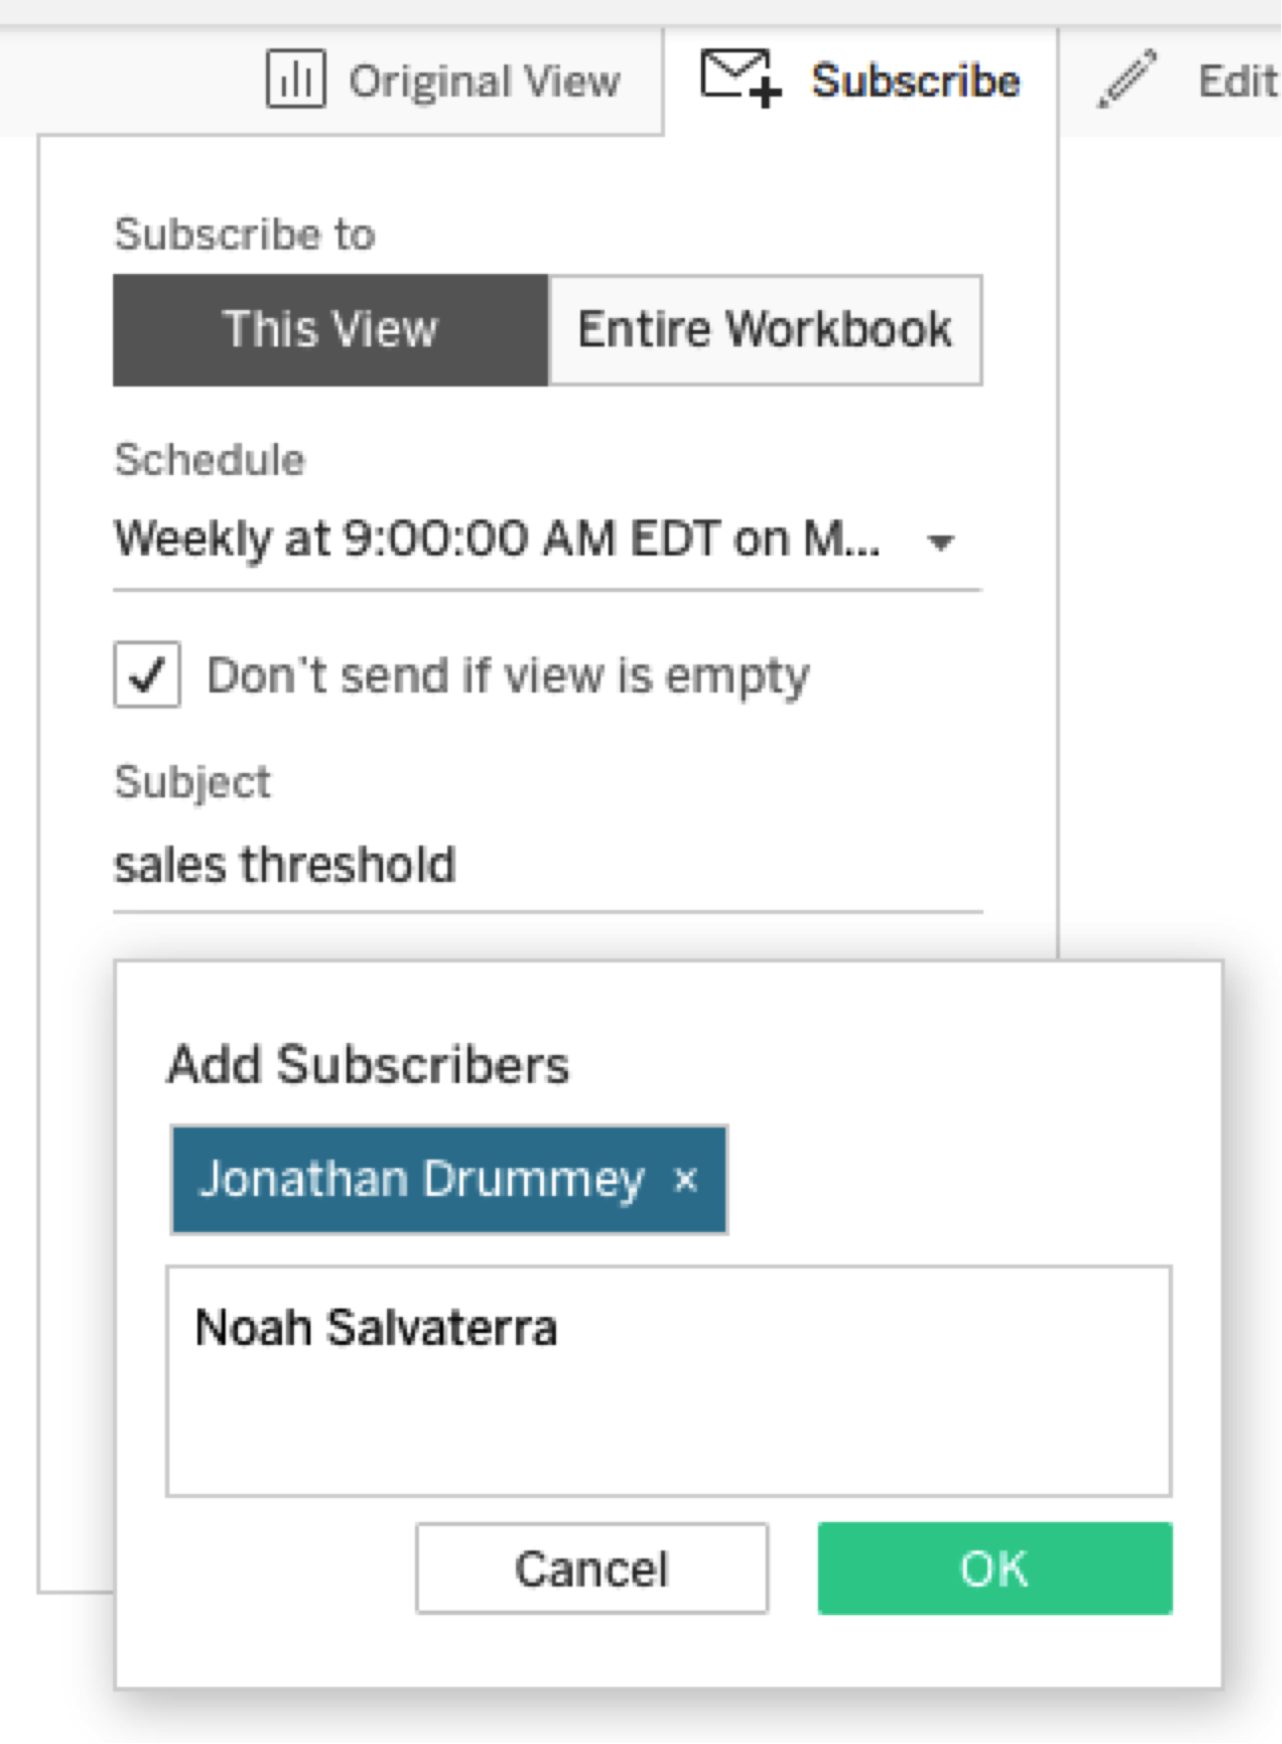
Then each salesperson can be subscribed to the view with “don’t send if view is empty” checked and only be alerted when sales exceed the threshold. Note that people don’t have to subscribe themselves, We can take advantage of Tableau 10’s subscribe-others feature and add additional salespeople to this:
With Tableau 10’s improved notifications on extract failures and the subscribe-others feature, and the new conditional subscriptions feature in Tableau 10.1, Tableau is upping its game for subscriptions and alerting. And, to quote the Devs on Stage from the keynote: I think they are just getting started.
If you’re a VizAlerts user, you might be wondering how the built-in features compare to VizAlerts. In that case, check out this document for a comparison.
Also, Matt Coles, the other developer on VizAlerts, and I are presenting a session on using VizAlerts at the Tableau Conference in November. We'll speak to the similarities and differences along with an update on whatever new goodies Tableau announces. And a little birdie pointed out a session that’s just been added to the conference schedule on data-driven alerts with Tableau's Zac Woodall. I bet we’ll get to learn even more about what Tableau is up to!
See what's new in Tableau
相關文章
Subscribe to our blog
在收件匣中收到最新的 Tableau 消息。


