4 steps to deploying IT-powered business analytics
We believe in going beyond discovering insights to driving meaningful change across the entire organization. To achieve this, people across teams must work together, communicating their insights and leveraging each other’s work. And you, IT, are the central actor that makes all of this possible.
People in your organization are already using Excel and other tools to answer their questions. So how do you take charge and enable self-service analytics while also making sure the data is governed, trusted, and secure?
The goals of self-service analytics are simple:
- Empower people to ask and answer their own questions of the data
- Enable people to easily share their insights with their team and the rest of the organization
- Ensure that the data driving the decisions is accurate
There are four key steps to successfully deploying self-service analytics with Tableau.
1. Set up your environment rapidly
It’s easy for one person to pick up Tableau Desktop and start exploring the data in just minutes. How can you quickly enable everyone in your organization to be self-reliant?
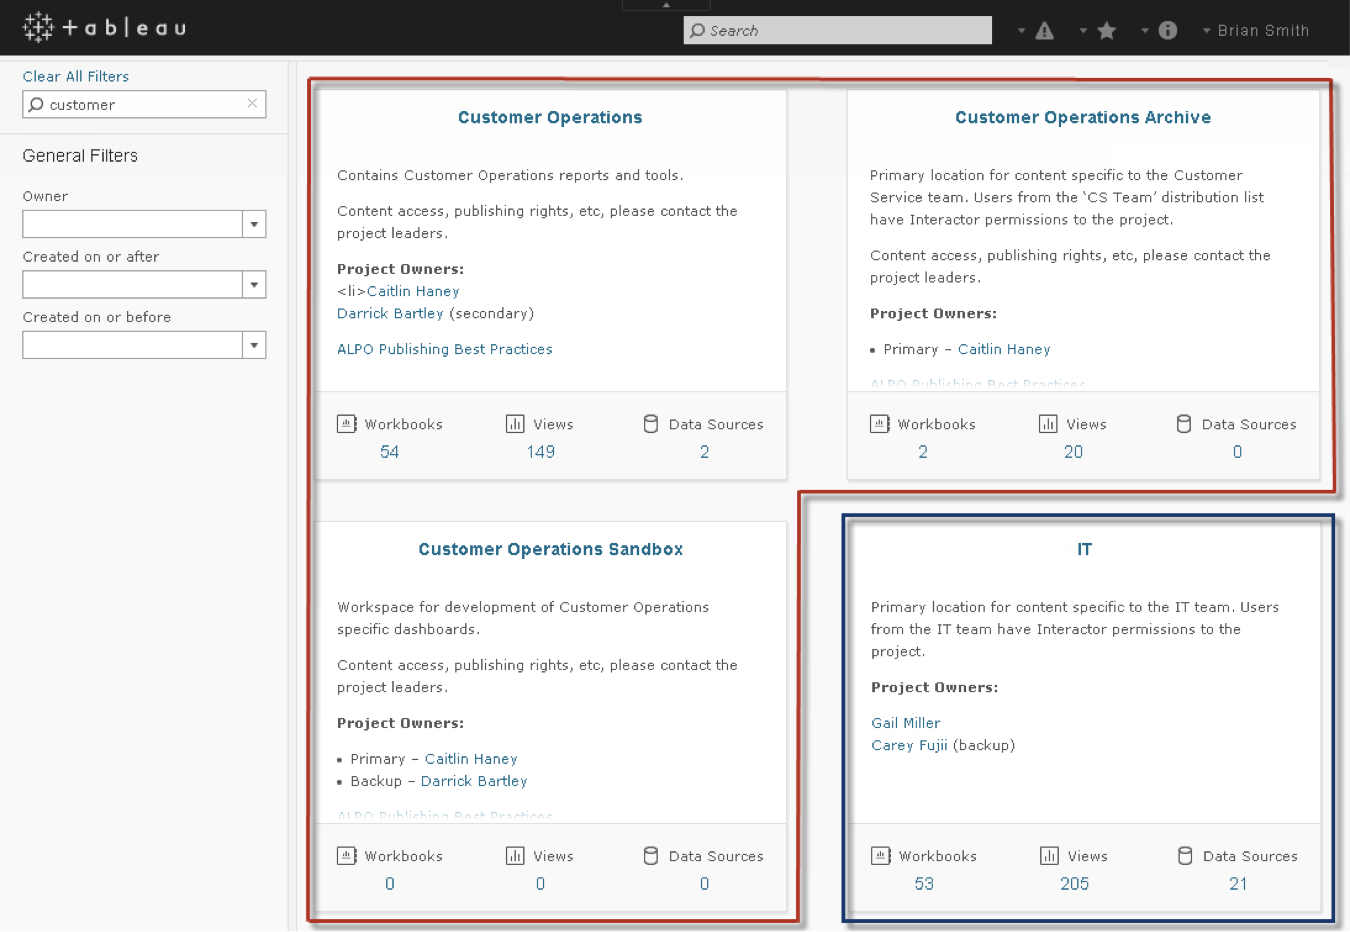
Not only is Tableau fast and easy to install, set up, configure, and update, you also have multiple options to help you manage content based on your needs. IT can use different projects—for instance, sandbox and production—as a way to manage content.
You can create projects for teams to use as their self-service sandbox. This is where users can freely explore and perform ad hoc analysis. In addition, you can create a “production” project with vetted data sources and dashboards. That way, the entire organization can trust the data and use it with confidence.

Tableau also integrates seamlessly with the authentication and authorization standards that you already have in place.
Tableau Server is so easy to manage that we often see IT delegate the role of site administrator to select business users, especially when it comes to content management and permissions. For example, the analyst aligned to the marketing department can be the project leader for marketing projects.
2. Empower your users to be self-reliant
What do new users need to quickly come up to speed in your environment? They need a place to find answers to questions and to share insights.
You, IT, lay the groundwork so users can easily access existing dashboards where ever they are, even on the go, and conduct their own analysis and share with their colleagues. You can rest easy knowing that the security in Tableau Server and Tableau Online will protect against unauthorized access. Permissions can be applied to workbooks, data sources, projects, and sites using predefined group roles or custom permissions.
And when you or your users create dashboards, you can help make the findings part of existing business processes by embedding them in the platforms already in use.
3. Centralize your data models
Provide users with trustworthy data so they can be confident that they are using the latest, most accurate data.
Centralize data connections into published data sources that are secure, permissioned, fast, reliable, and easy to find. This reduces duplication and gives all users a single source of the truth on which to base their analysis.
Changes to a master data source are automatically propagated to workbooks built using that data source. This allows the business user to focus on deriving insights from the data instead of having to worry about the underlying database structure, joins, proper field definitions, or data integrity.
You can also use the Tableau Data Server to consolidate your extracts to avoid unnecessary processing and storage.
4. Monitor and audit usage

Monitoring usage is a critical piece of the self-service model as it allows you to be proactive about usage and performance, and to quickly react to failures.
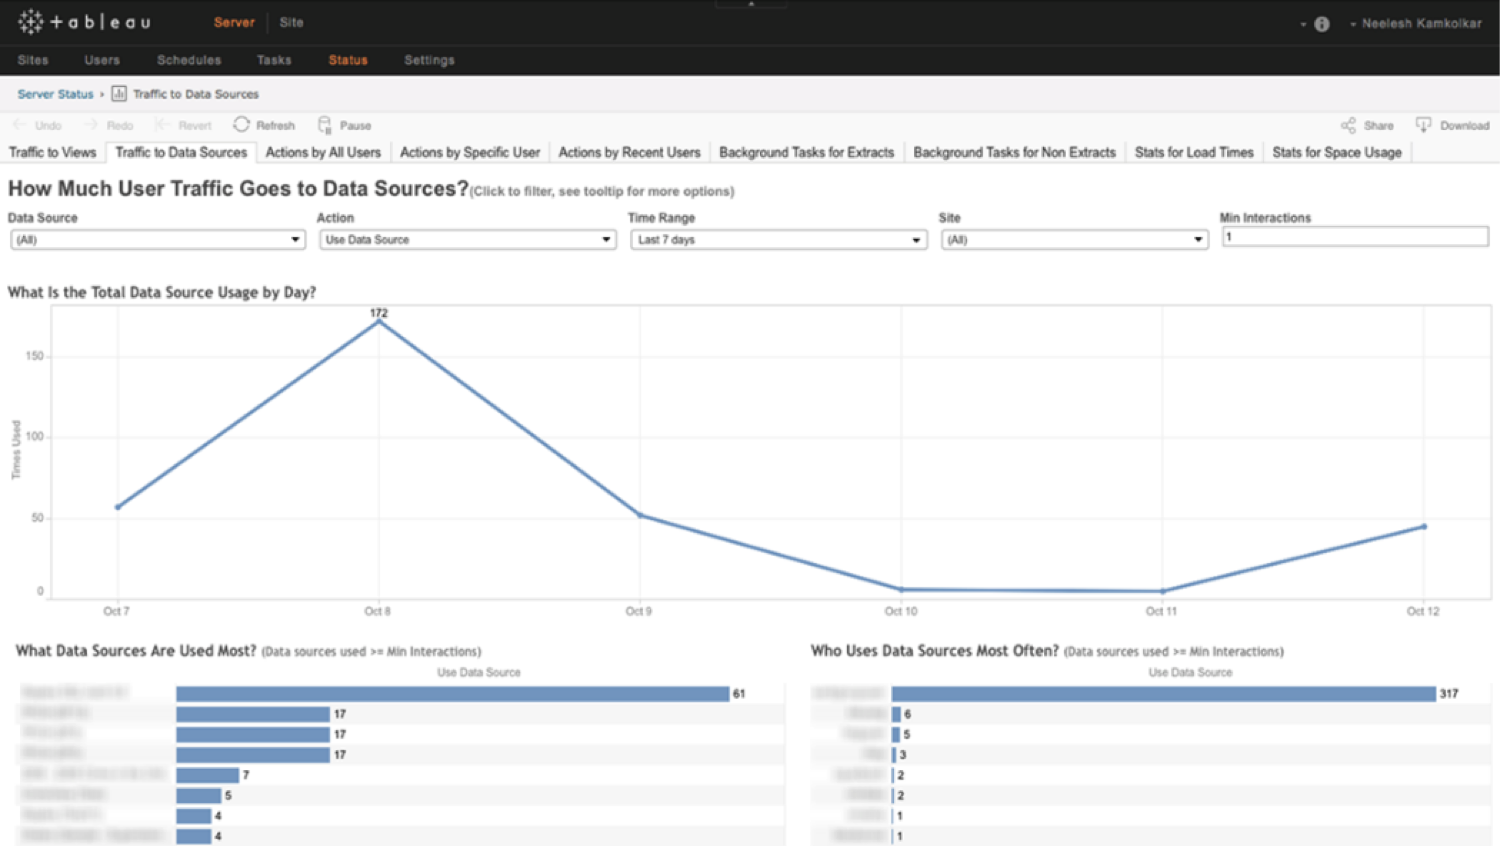
Tableau Server provides a set of curated, interactive admin views. You can drill down, aggregate and answer your questions to find your own insights. Just as business users leverage data to make smarter decisions, you, too, are empowered to make data-driven decisions on your Tableau deployment.
You can detect patterns in your organization’s data consumption, then focus your efforts on maintaining the most widely-used data. You also have visibility into server health issues and background tasks through the admin views and email alerts.
The power doesn’t stop with the curated views. Tableau provides access to all the repository data so you can customize the views to meet your needs.
Moving forward
With these steps, IT can transition from a report-factory role to a more strategic role of governance, working to make data available. To begin the process, IT should partner with the business to identify key stakeholders with questions of the data. IT can then learn their needs to enable them to see and understand their data.
To learn more about IT-powered business analytics, download our whitepaper.
相關文章
Subscribe to our blog
在收件匣中收到最新的 Tableau 消息。


