10 key vizzes for today’s college students
This piece is part of the Back-to-School series on the Tableau blog. Students around the world are returning to school with the hopes of learning new skills that will help them find success in their future careers. Learn more about the skill that tops that list—Tableau.
As much as it pains me to admit it, I didn’t learn about Tableau until after I graduated from college. However, I can wholeheartedly say now that it would have made my life a lot easier—and fun! Why? Not only is visual analytics beneficial in your courses (think about analyzing data for your marketing class), it conveys information about personal interest topics. Over the years, our Tableau community has published more than a million (literally) visualizations with themes ranging from sports and music to politics and education. Here is a sample of 10 interesting vizzes that I wish I knew about in college:
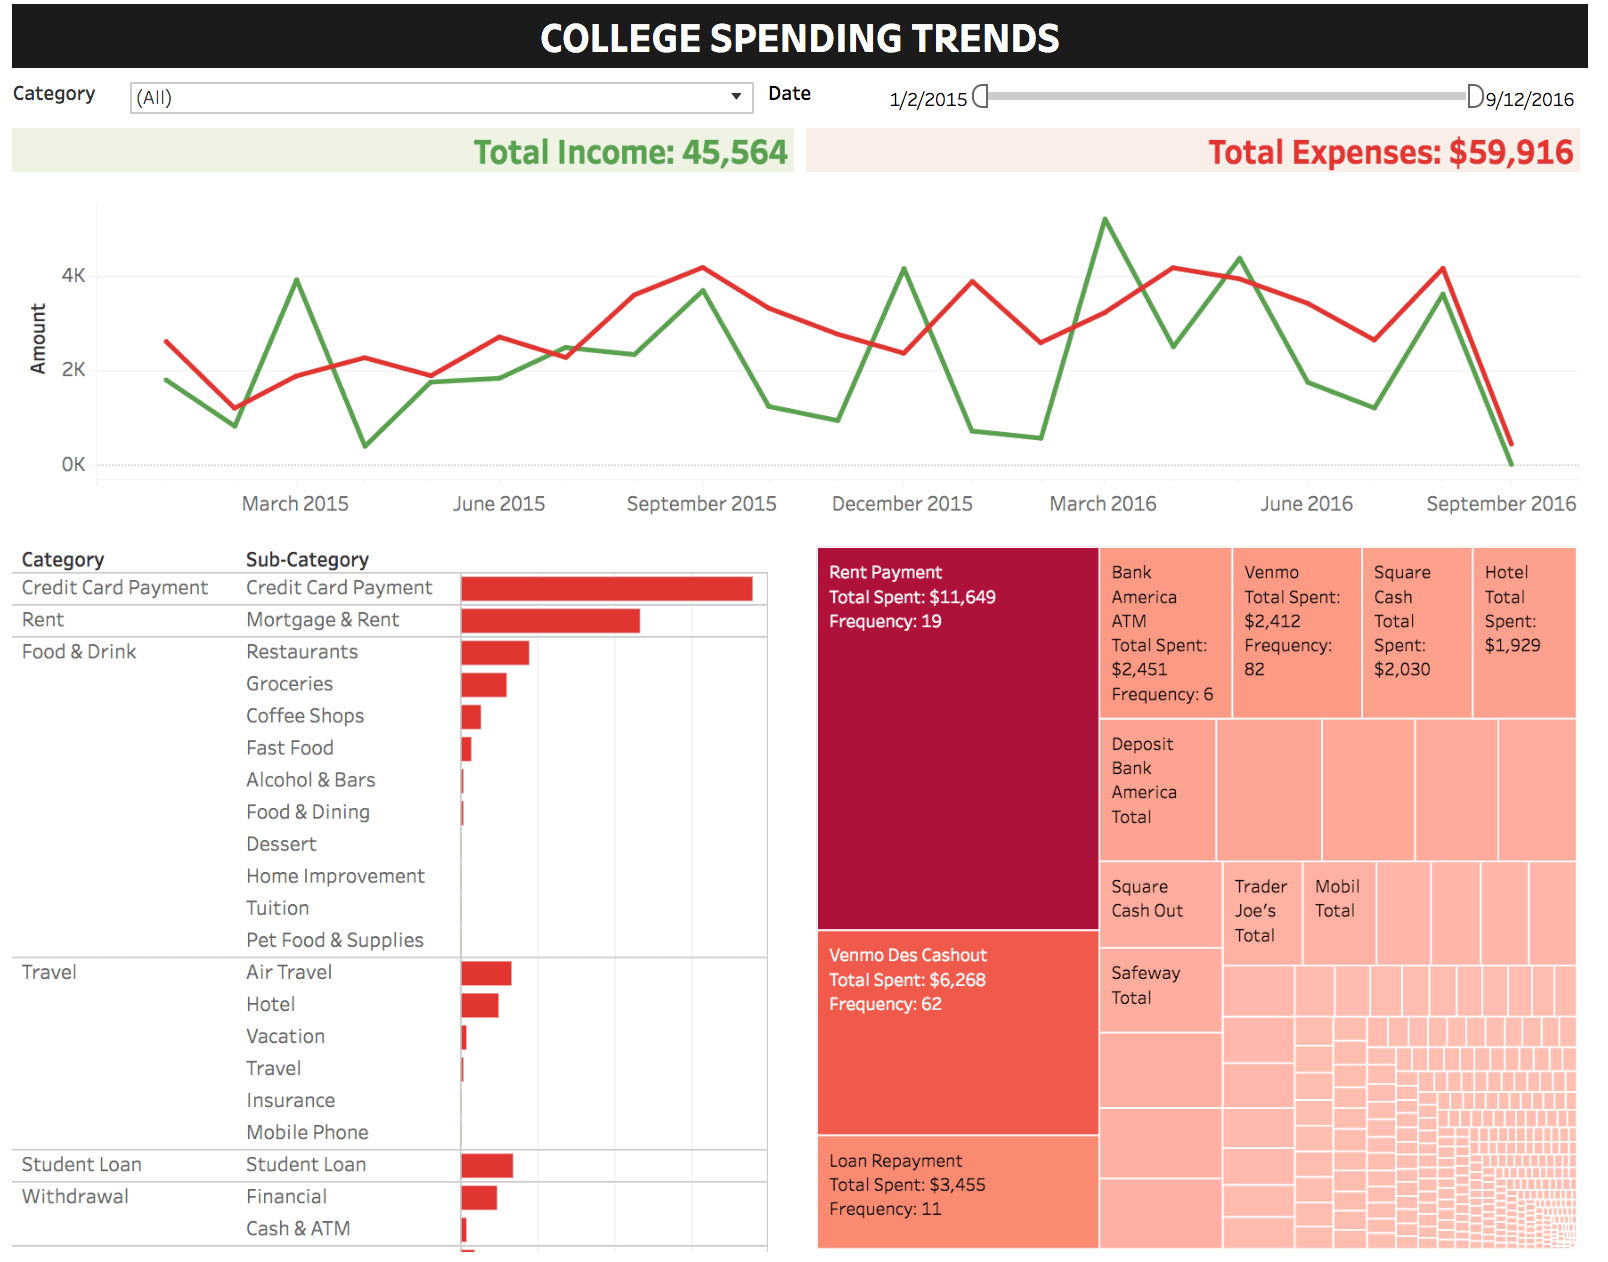
College spending
Are you on a budget? I can imagine most college students would answer “yes.” This dashboard uses data from mint.com to track your spending habits.
Viz by Midori Ng
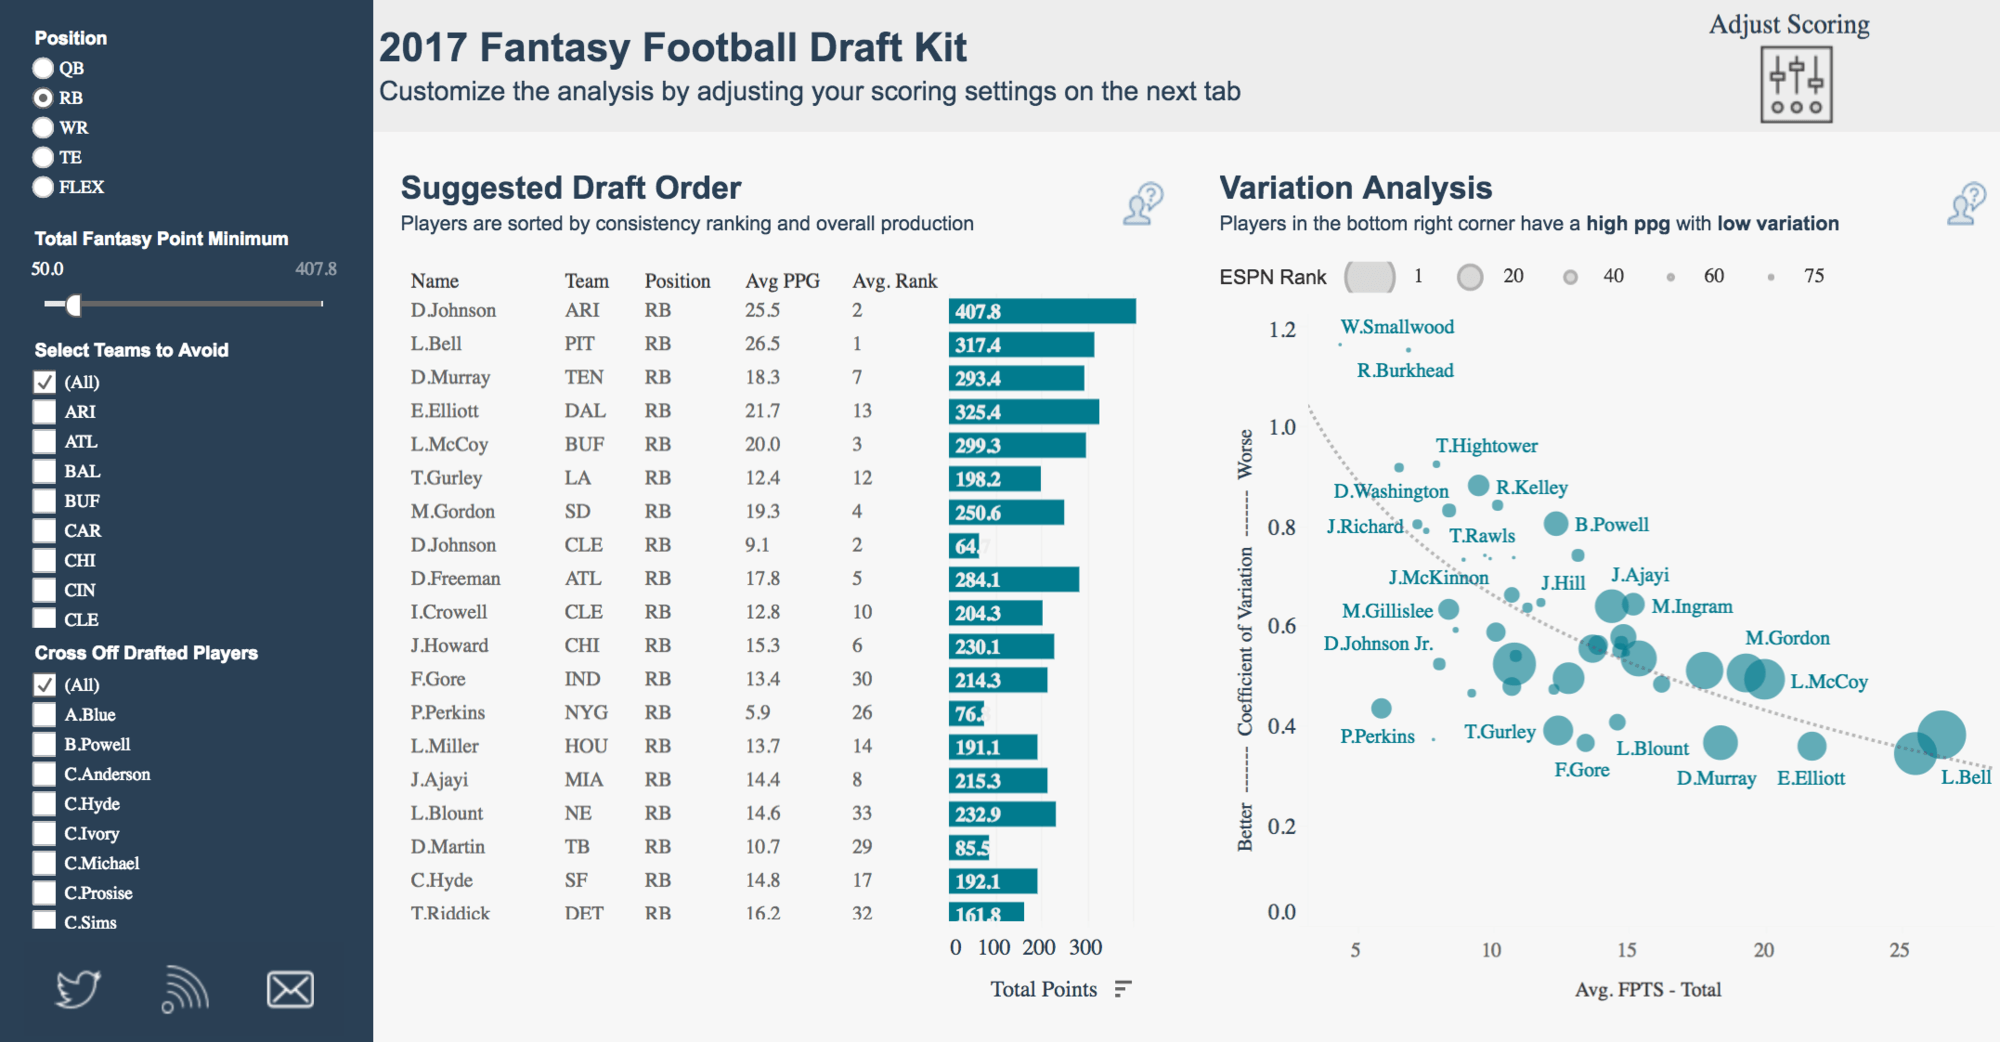
Fantasy football draft kit
Do you spend hours trying to figure out what players to draft for a fantasy football team? Increase your odds of picking a winning line-up with this draft kit.
Viz by Curtis Harris
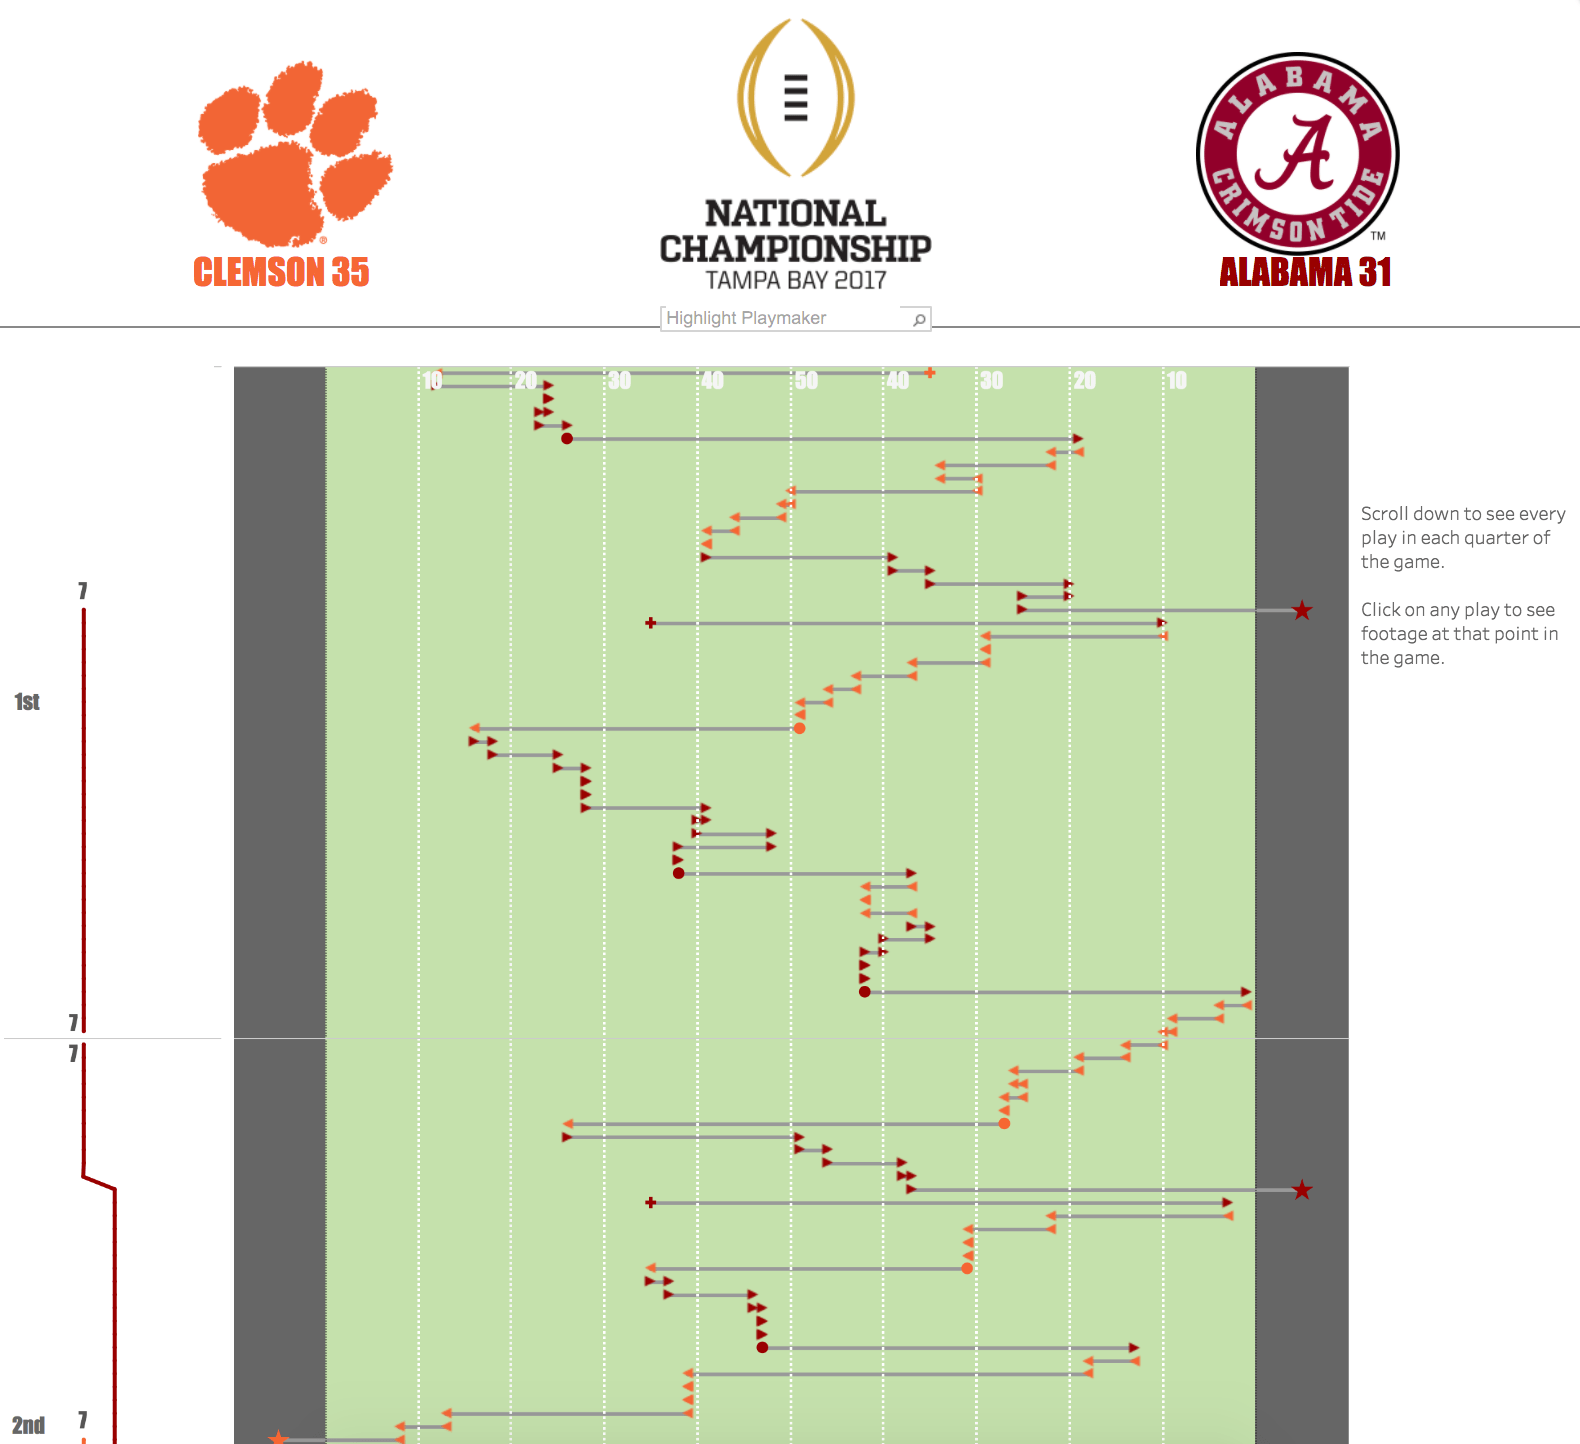
2017 National Championship - Clemson vs. Alabama
Perhaps you’re more of a college football fan. This viz looks at key stats from the 2017 National Championship game.
Viz by Matt Chambers
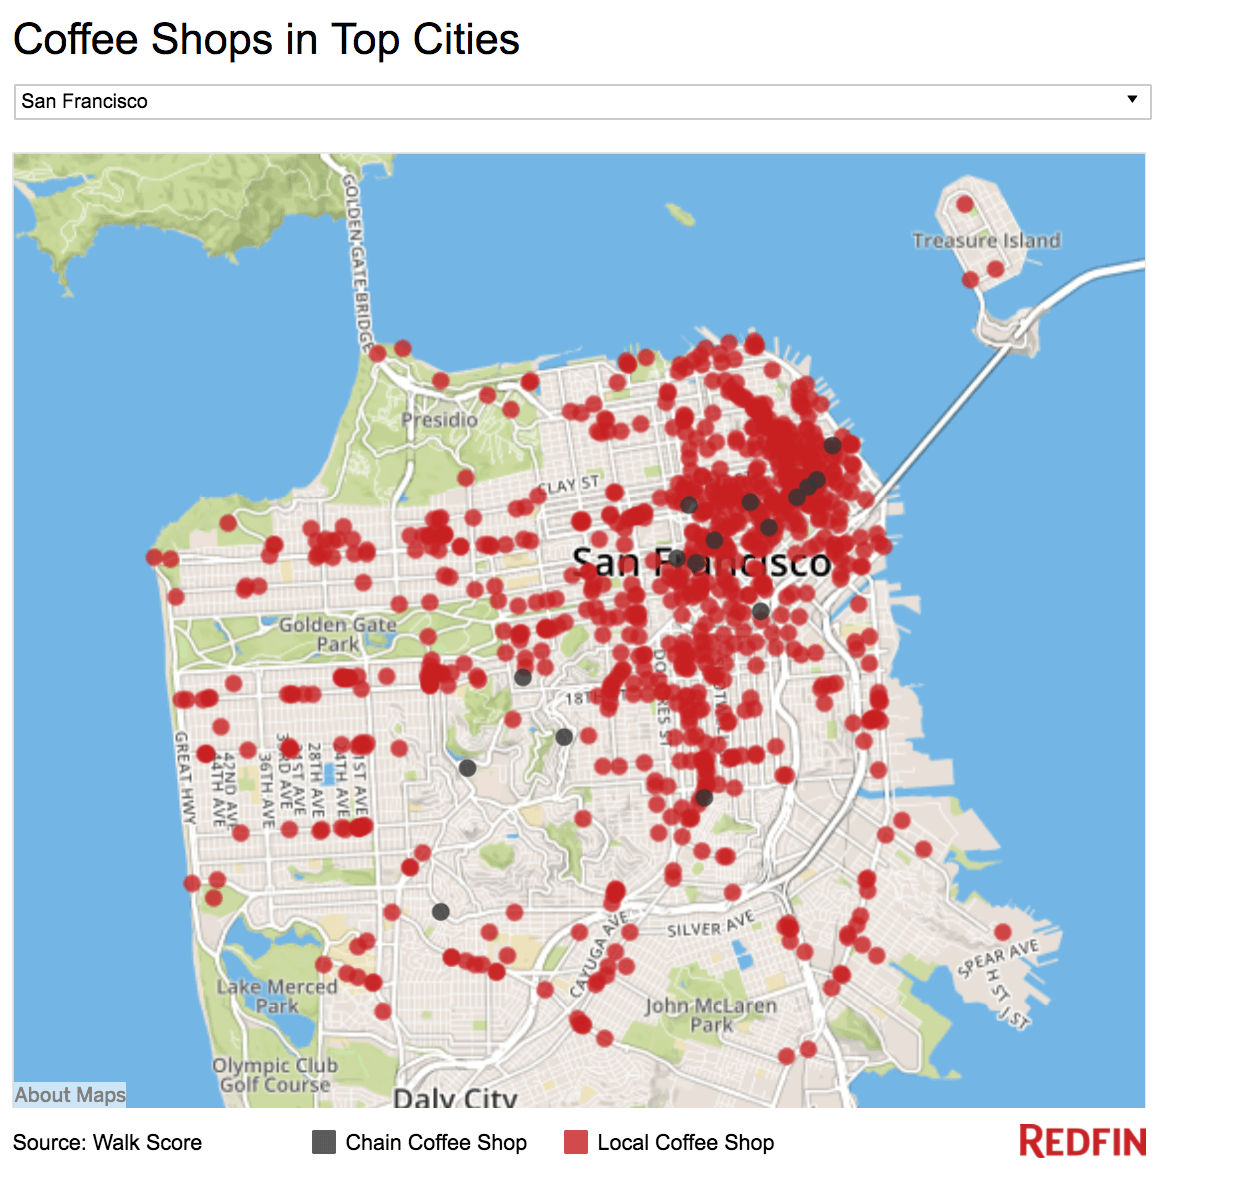
Coffee shops in top cities
Maybe it’s pre-finals and you’re searching for a coffee shop to fuel up on a good cup of joe. This viz has you covered.
Viz by Redfin
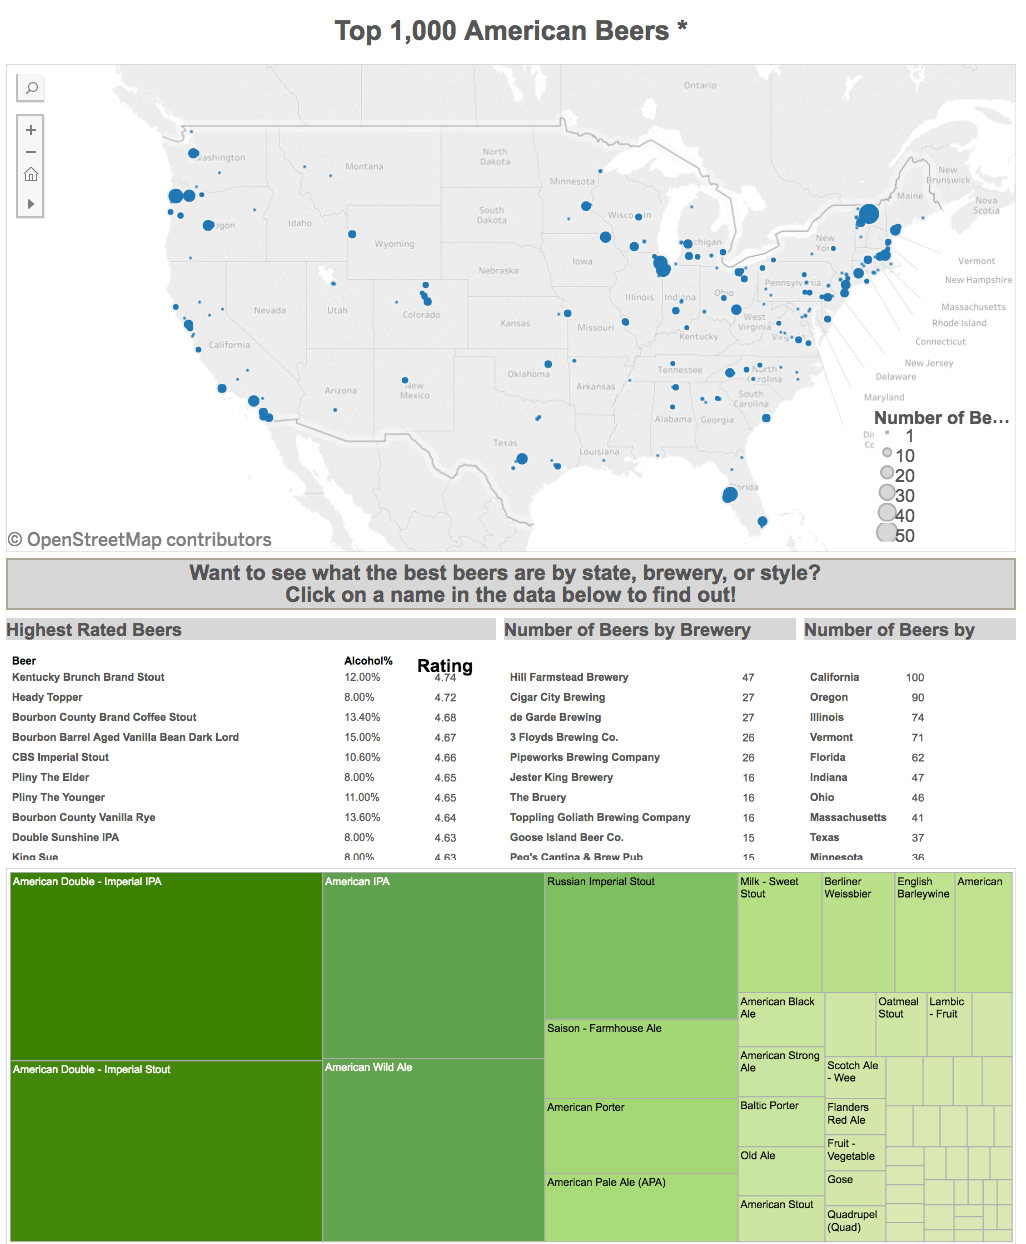
The best beers in America
If you’re more of a beer-connoisseur, check out the best beers in America featured in this viz.
Viz by Abartel
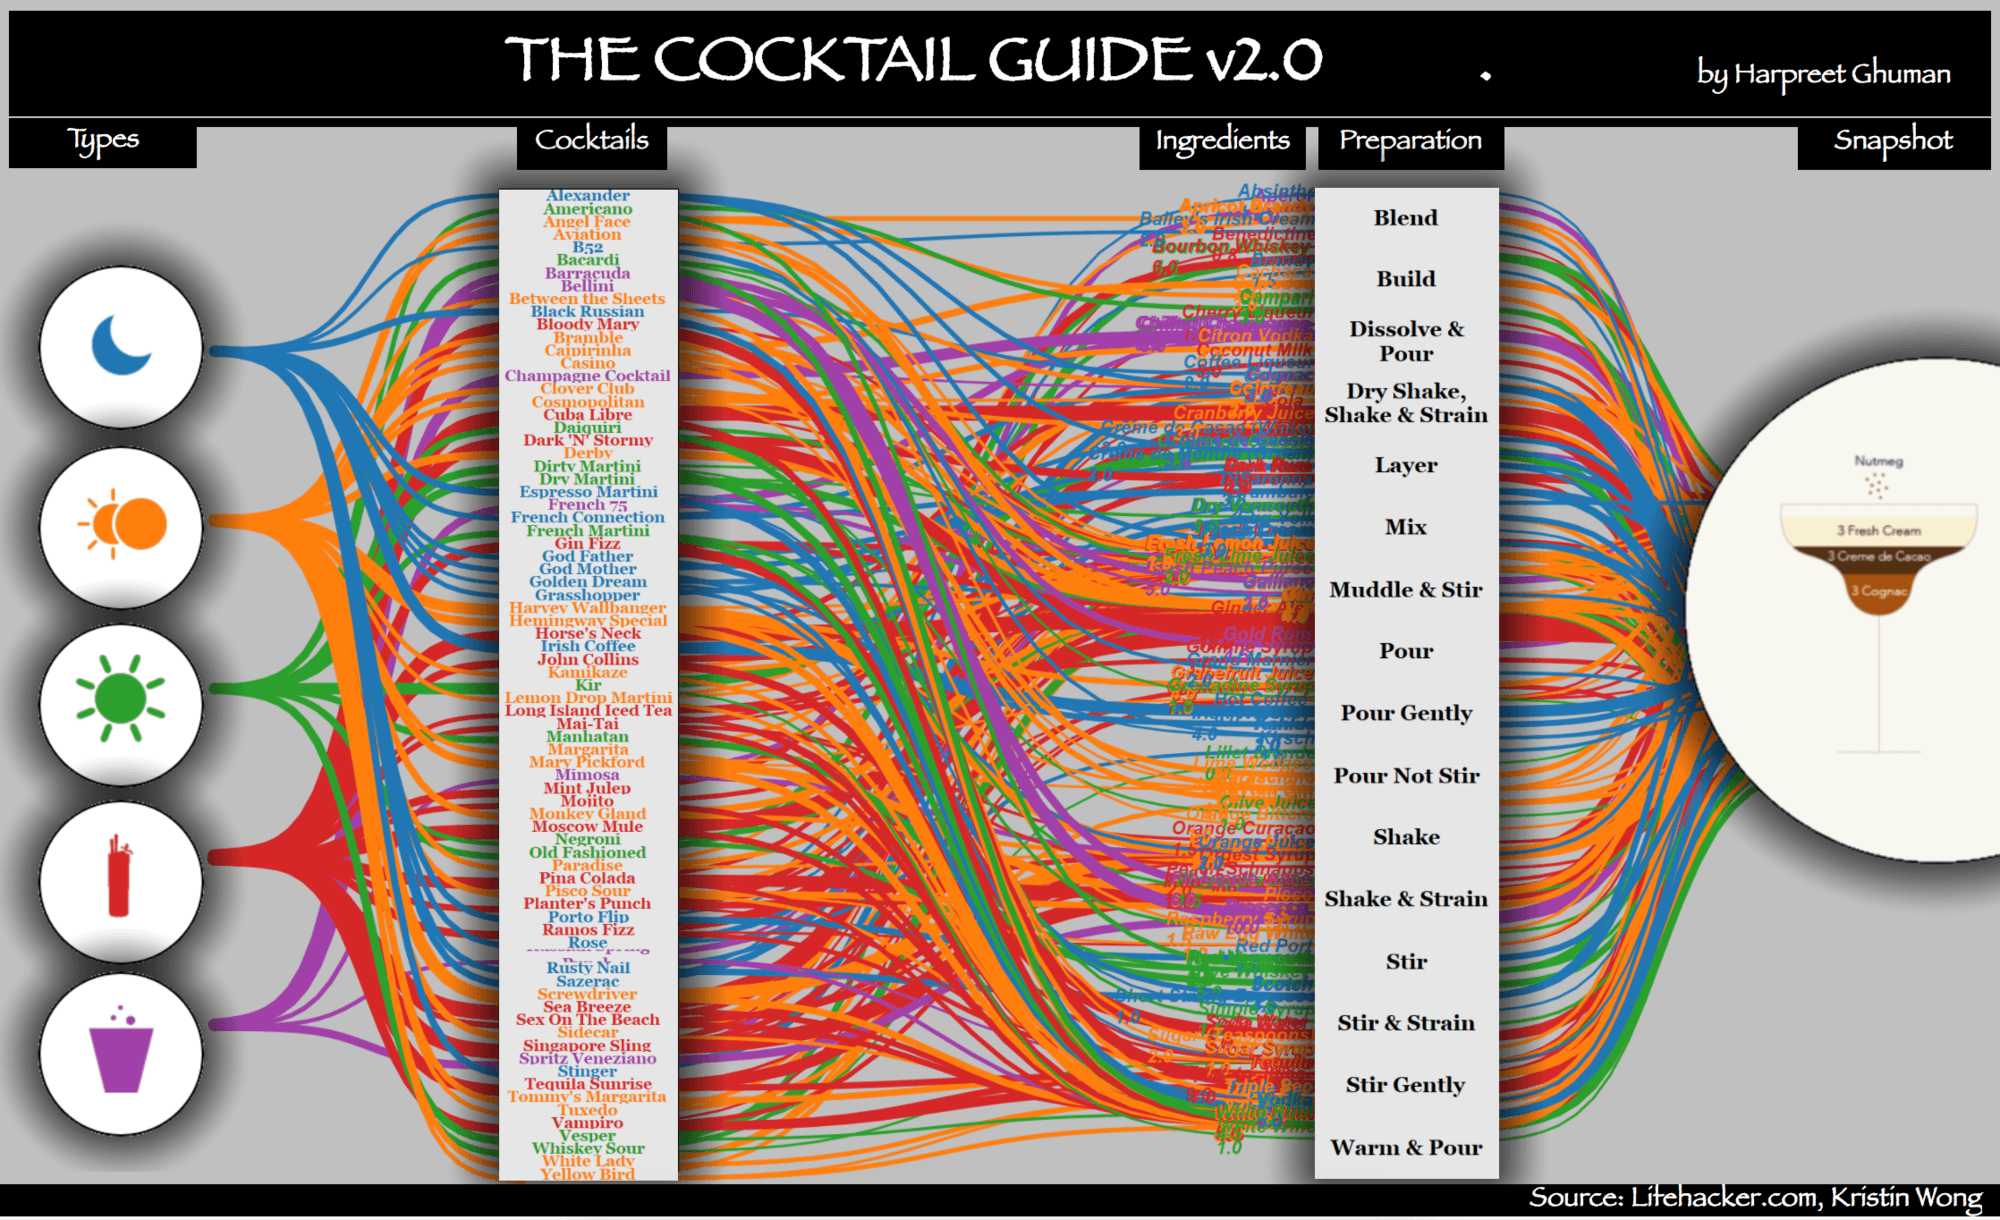
The cocktail guide
Looking to make the perfect drink to celebrate the end of the semester or quarter? Take a look at this Cocktail Guide.
Viz by Harpreet Ghuman
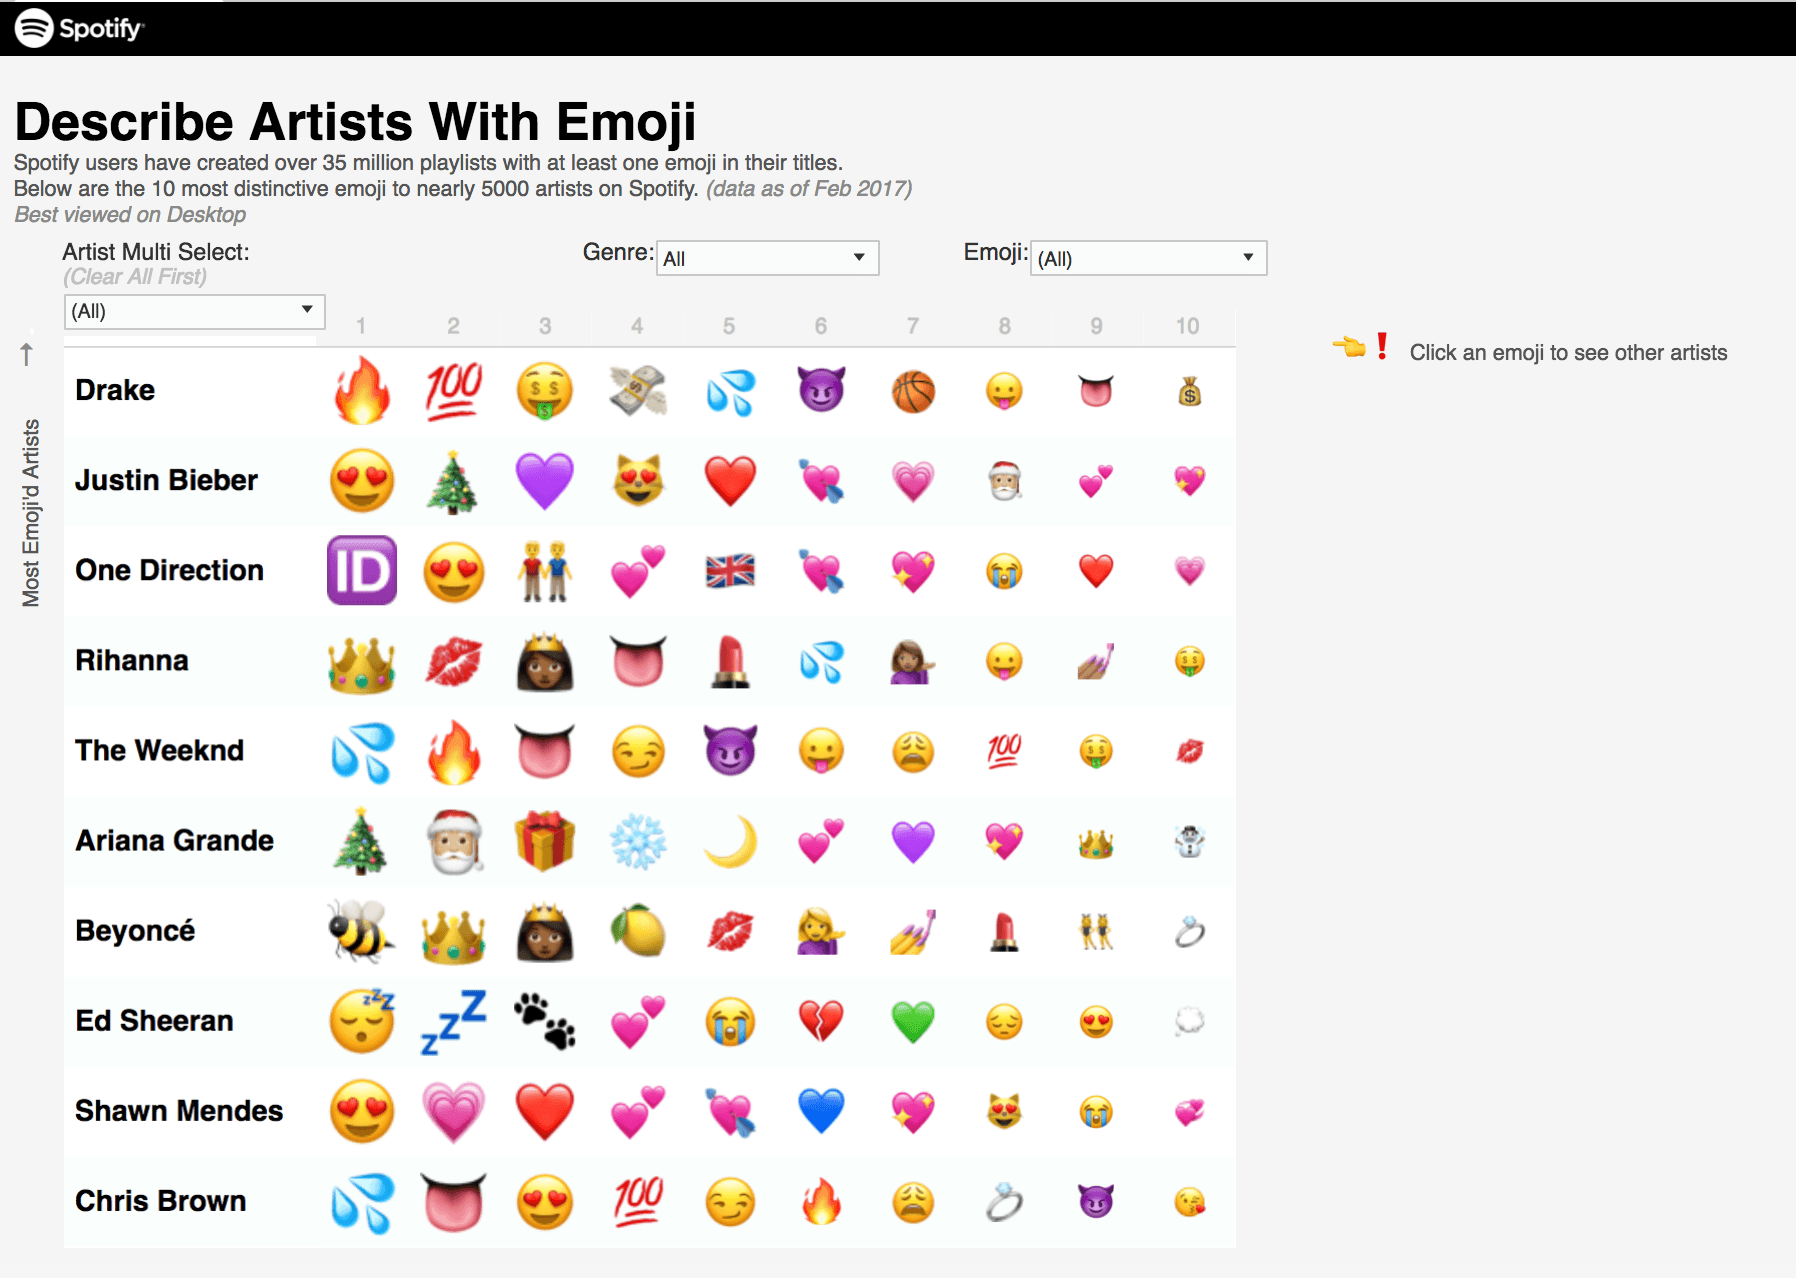
Describe artists with emojis
Looking for a study break? Check this out to learn which emojis are most commonly associated with certain artists.
Viz by Spotify Insights
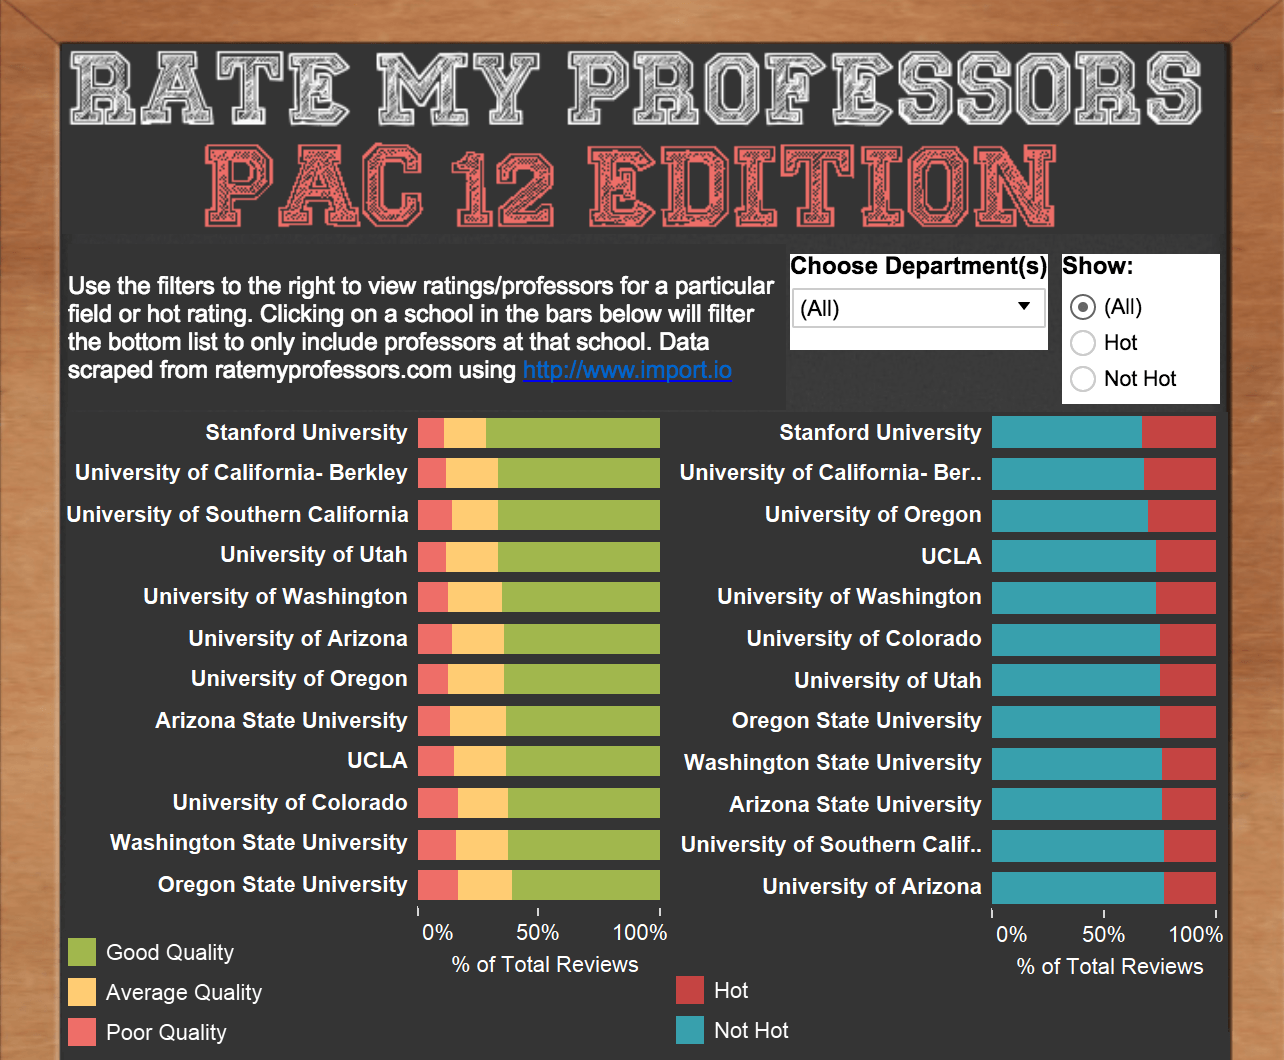
Rate My Professors
If you are picking courses for the upcoming term, be sure to make the right choices by consulting this viz.
Viz by Jewel Loree
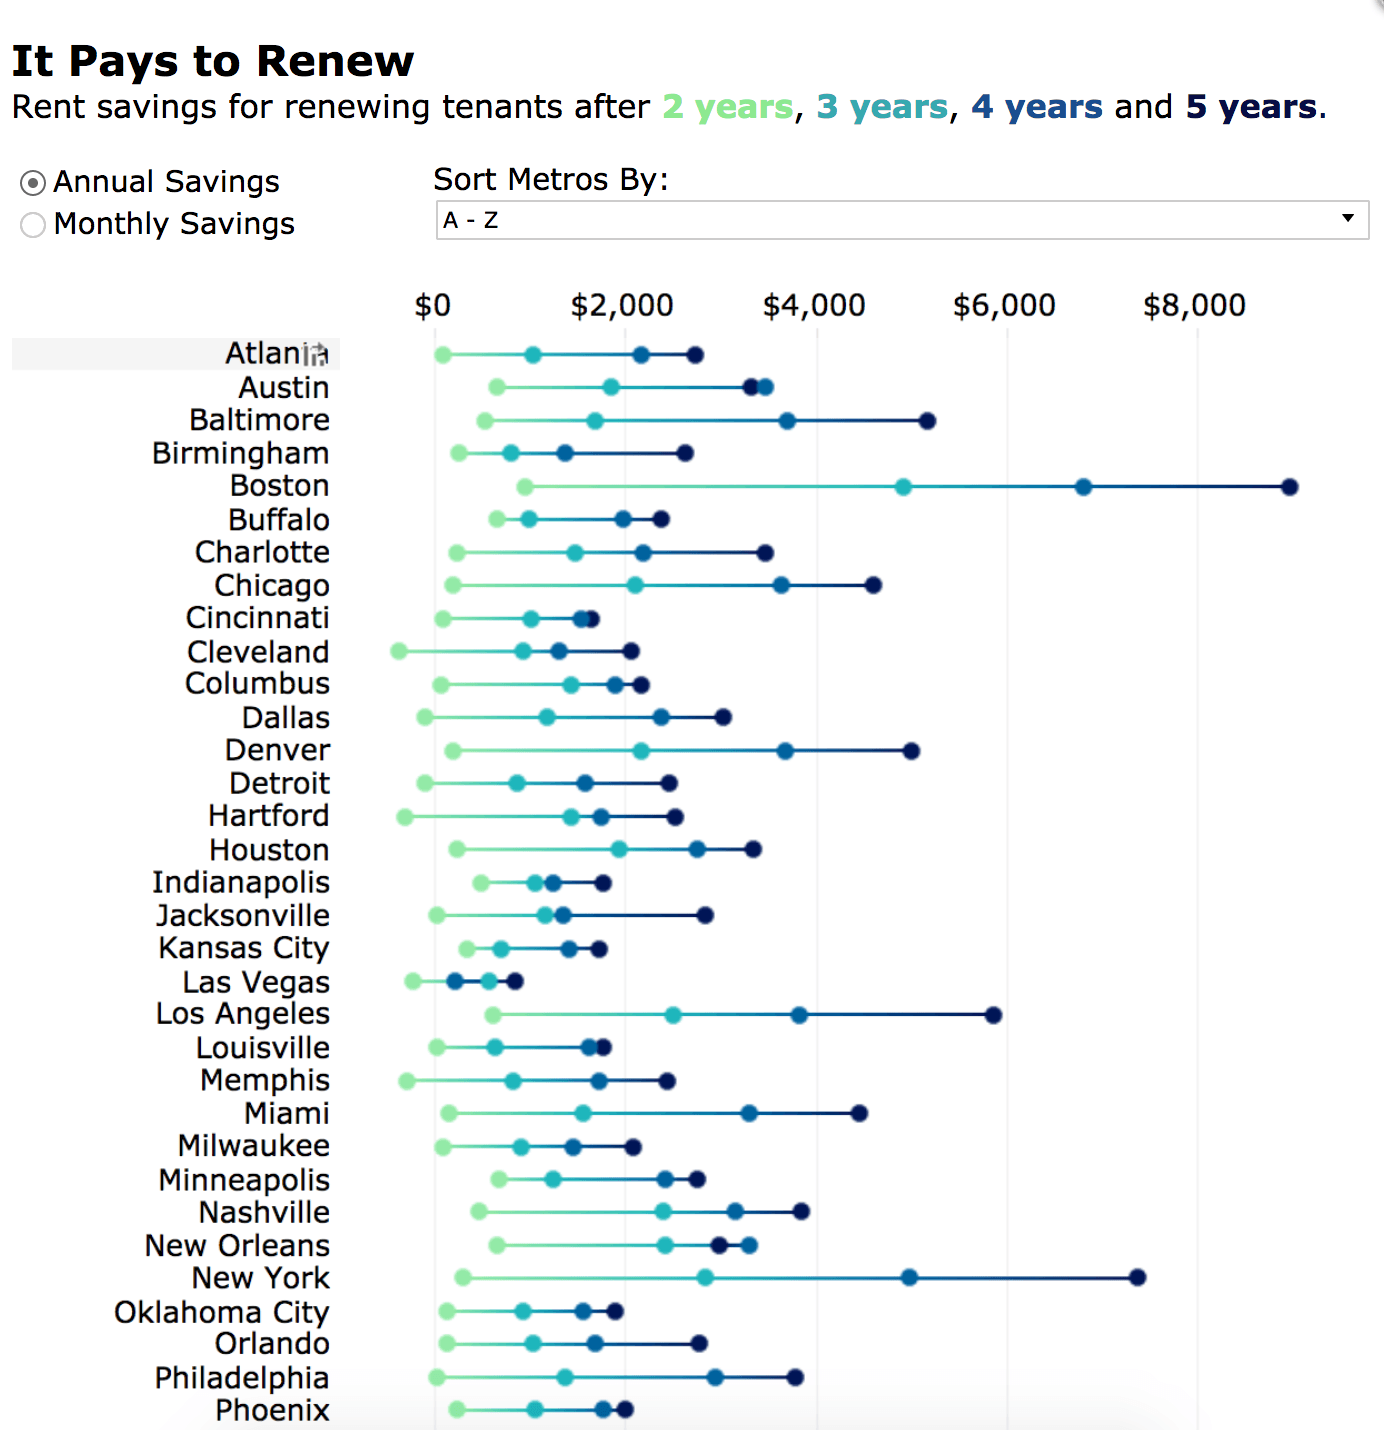
It pays to renew housing
If you’re currently renting an apartment near campus, check out this viz to see if you should move or renew your lease.
Viz by Zillow Economic Research
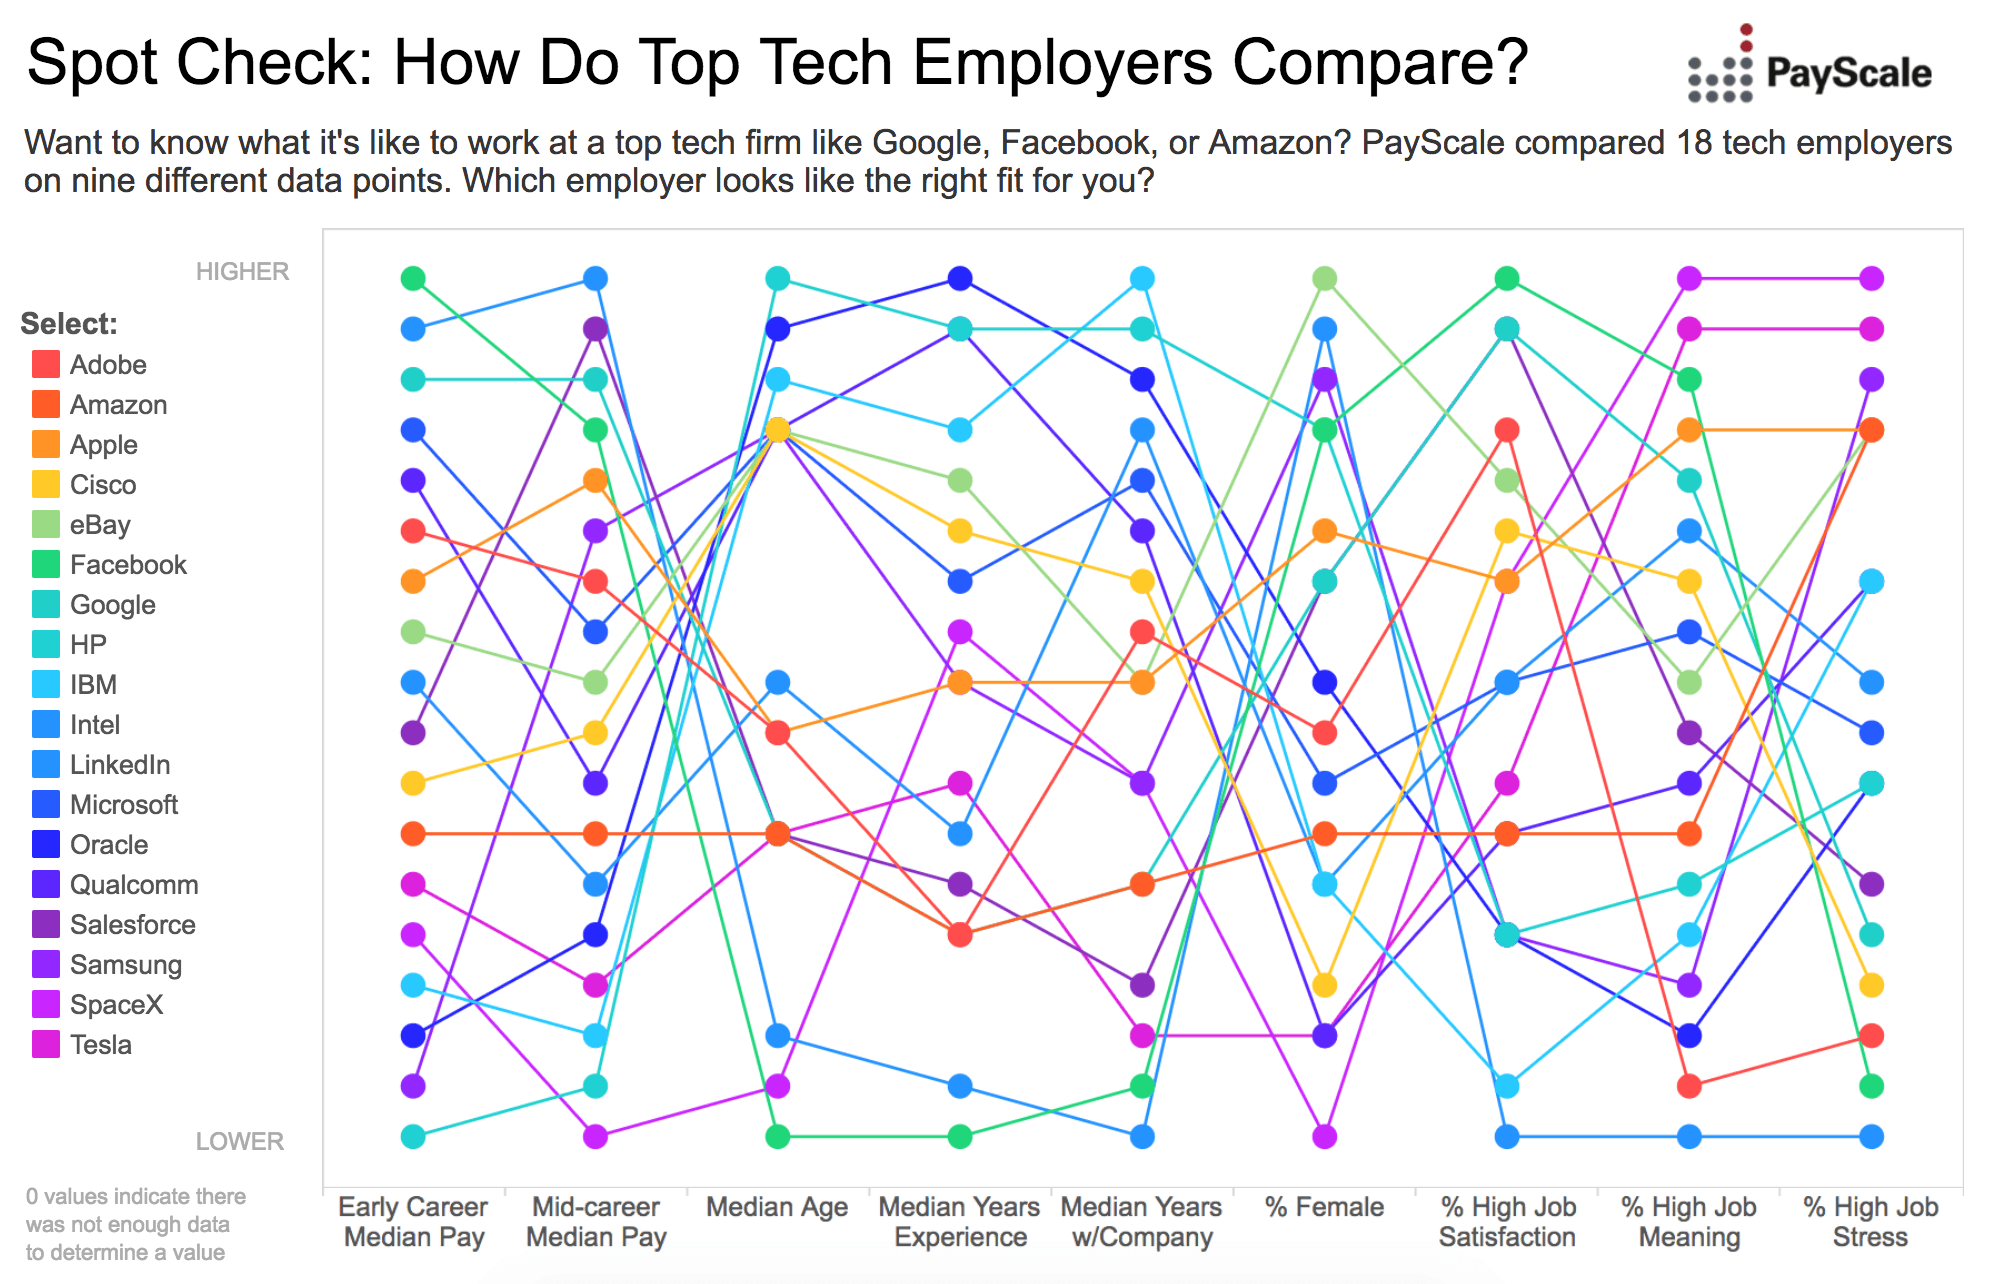
How do top tech employers compare?
Are you thinking about an internship or full-time job? Check out this data to see what it’s like to work at a top tech company.
Viz by PayScale
It’s your turn
Feeling inspired? It’s your turn to create a viz. Here are a few fun data sets to help you get started:
- Netflix Shows (data.world)
- TMDB 5000 Movie Dataset (Kaggle)
- 2017 ESPN World Fame 100 (data.world)
- Meteorite Landings (Kaggle)
- Uber Pickups in New York City (Kaggle)
Don’t forget to publish your viz to Tableau Public and share it with the world! Need a student license? Request one today.
相關文章
Subscribe to our blog
在收件匣中收到最新的 Tableau 消息。


