Interactive Whitepaper

Four Service Analytics Strategies

How to transform your service organization with data

Introduction: A new era of service leadership

Digital transformation demands an entirely new set of skills from today’s service leaders. Yesterday’s customer support organizations needed leaders capable of motivating their call center teams while driving efficient operations. Today’s customer support organizations leaders must deliver on that same goal, but also be capable of creating a vision of how their company differentiates itself through customer experience. Leaders must then back up that vision with investments that enable their organization to follow through and earn loyal customers. One of the critical investments to realize your vision for better customer experience must be in analytics. In the age of digital transformation, when data is exploding and service organizations deliver on more channels than ever, it is impossible to create a service organization offering efficient, high quality customer service without deep insights into customers and your business. The opportunity that lies in customer service data is too obvious to ignore, but almost too overwhelming to fully quantify. Where should you start and what should you prioritize? Here are four strategies to transform your service organization with analytics:

  1. Continuously improve every customer touchpoint
  2. Align your service metrics to your vision
  3. Enable career growth in service
  4. Turn customer service into everyone’s responsibility

In this interactive whitepaper, we will share field-test use cases from Tableau customers that align to those strategies, and provide resources that will help your analytics team get started. By identifying your greatest service analytics opportunities, we hope that you’ll be able to deliver the customer experiences that differentiate your company and earn you customers for life.

Continuously improve every customer touchpoint

The average customer service team uses nine channels to help its customers, according to a Salesforce Study. While some customers still default to calling, many others prefer self-service channels like chatbots, community forums, and knowledge-base articles. A phone call is increasingly a last resort.

As a result of this ongoing digital transformation, service teams need to be able to look at data from every touchpoint to understand customer service performance. Exploring data from web site activity, social media posts, survey ratings, product usage, purchase history, and training activity can be just as important as tracking customer service case records themselves.
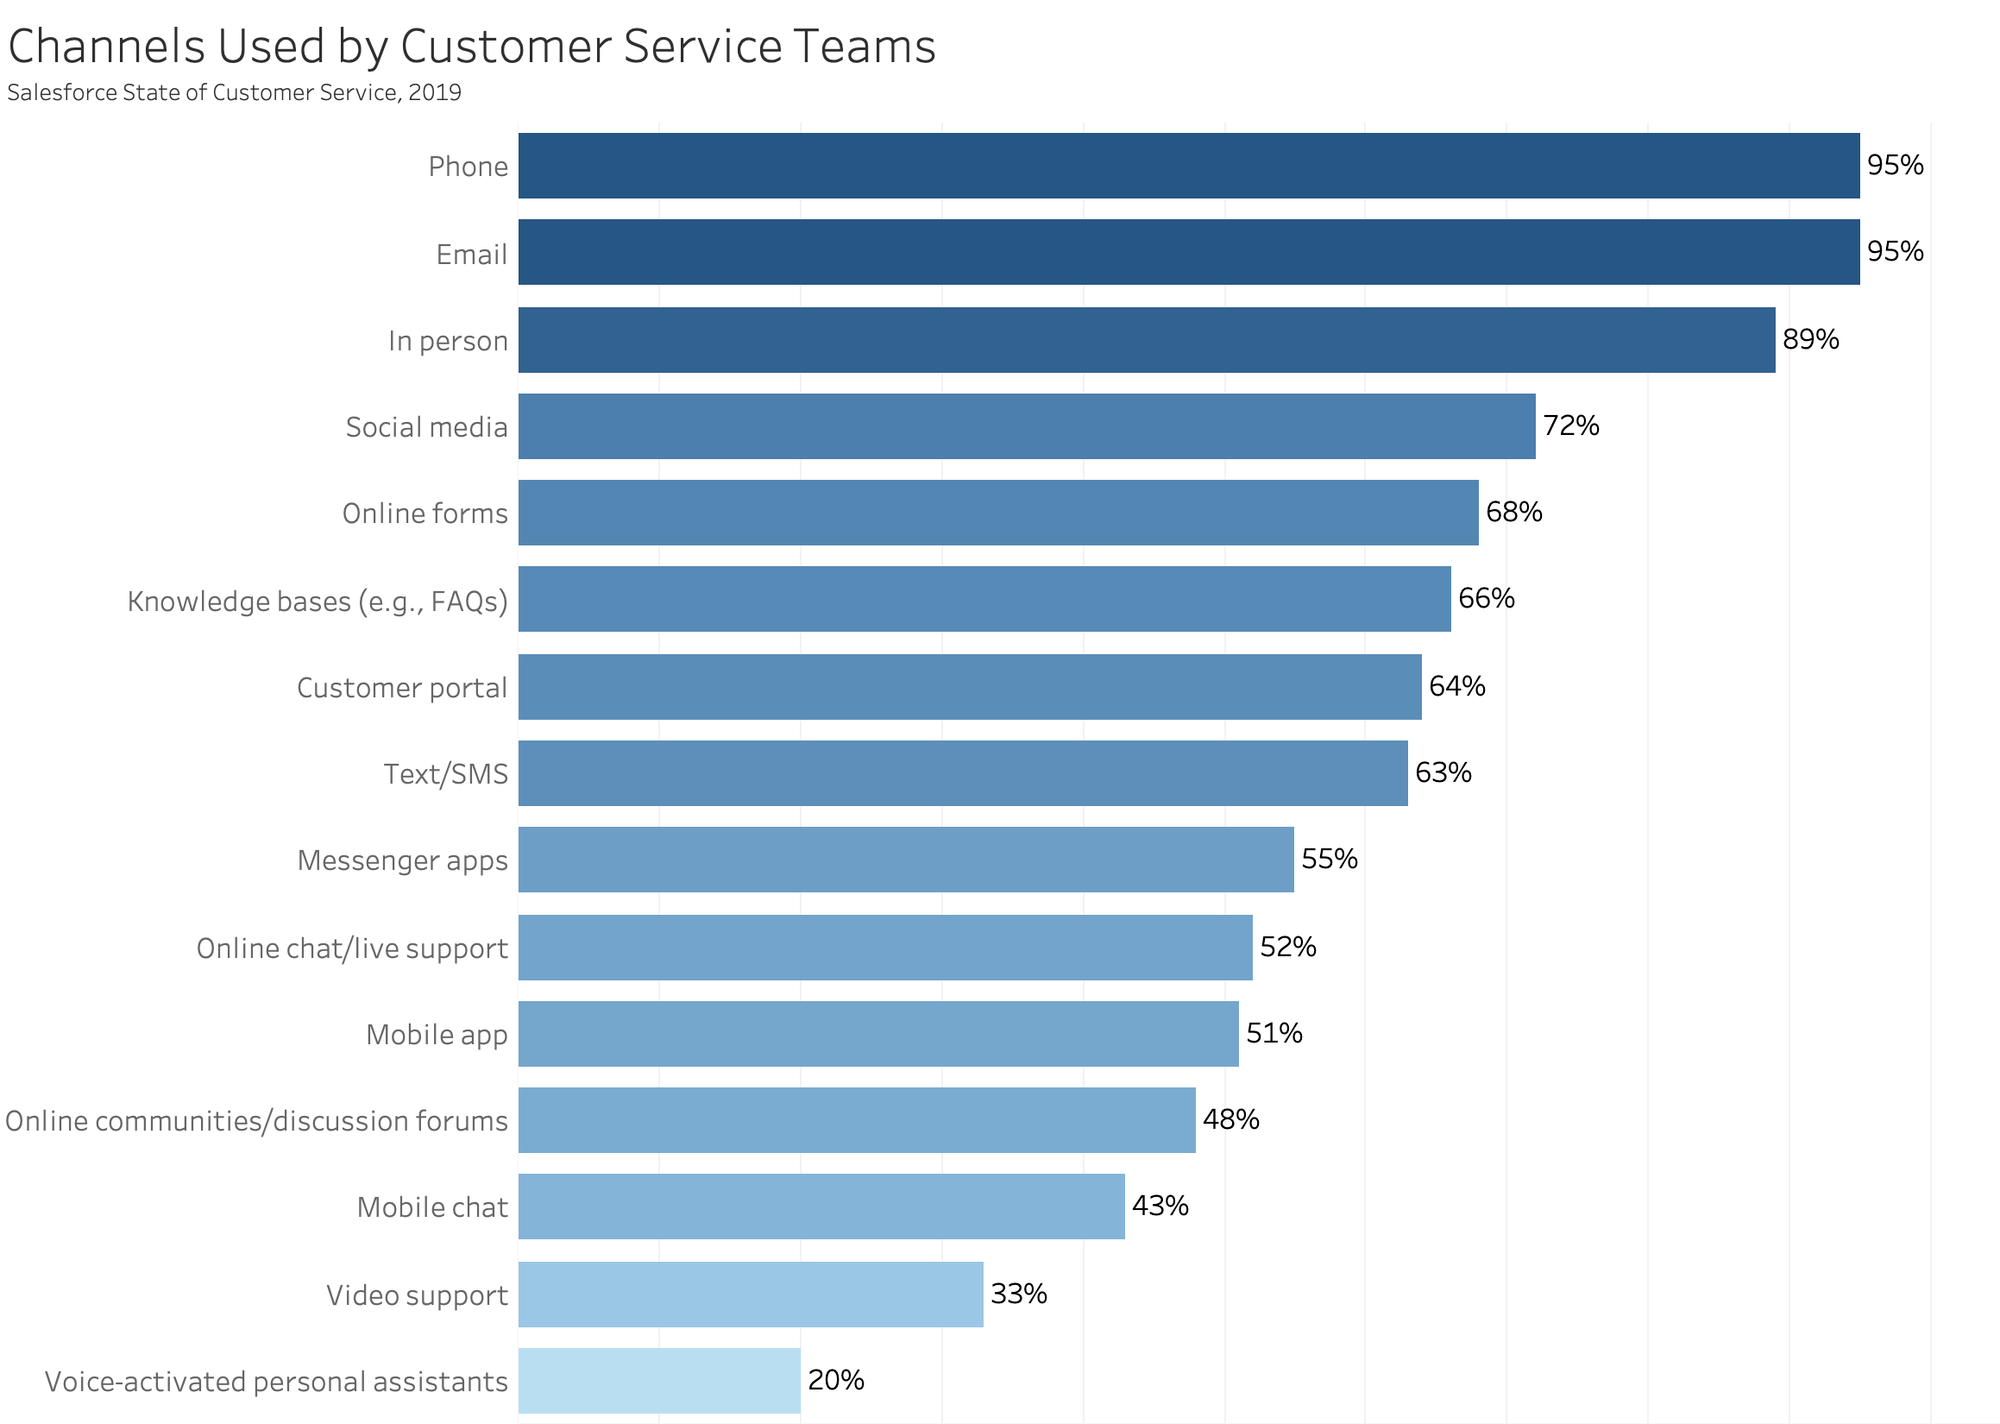
Key Service Organization Channels

Here are three companies that are looking at data from across their customer journeys and prioritizing improvements that resolve cases more efficiently or avoid them altogether.

Case Study

Verizon optimizes self-service support with chatbots

Verizon, an American telecommunications with more than 100 million customers, released a Fios on Facebook Messenger chatbot to support stronger customer engagements in 2017. The team uses analytics to track the category of questions that customers ask the bot. The extracted information was used to train the bot's intelligence so it recognizes more questions and responds appropriately to solve issues. They also learned the most popular times for customer engagement and increased staff to handle high-volume service events like power outages or pay-per-view sporting events on Fios TV. Check out Verizon's overview of their service analytics at TC 18 and their deep-dive on speech analytics at TC 19. Or click below to read the case study.

Case Study

Charles Schwab unlocks automated phone technology

Charles Schwab, one of the largest U.S. financial services firms, takes tens of thousands of calls each day to its contact center. What callers say in Schwab’s interactive voice response (IVR) technology, the automated phone system, had been a black box for some time. After collecting data from the IVR to understand where calls came from, what path customers followed in voice prompts to speak with a representative, who made contact with customers, and the outcome, they visualized all the data in a network diagram This helped Schwab improve its data quality and changed the way they focus on customers to enhance their Schwab experience.

Case Study

Southwest continuously improves call centers

Southwest Airlines has seven reservation centers that handle customer requests and inquiries. By consolidating data stored in Microsoft SQL Server and Teradata along with survey data stored in Microsoft Access and Excel, Southwest was able to create a universal view of call behavior. In addition to providing real-time feedback on team performance, Southwest was also able to spot that process changes were impacting call volumes on their teams and make changes necessary to prevent problems. Now the team is able to focus on continuous improvement, a process they shared in their TC presentation.

仪表板中的见解可帮助我们优化呼叫中心的运营,减少客户需要反复呼叫的情况。这些仪表板为我们提供了及时的信息。通过监控这些信息,我们发现,随着问题解决速度及客户满意指数的提升,呼叫数量和调度数量(重要的成本因素)下降了。

Align your service metrics to your vision

To transform your service organization, it’s essential to communicate a vision and tie that vision back to specific metrics. That’s often the easy part. Enabling your teams to act on improving those metrics often requires change management. Here are two stories that share how service leaders have prioritized customer experience and enabled their teams to follow through with analytics to make their metrics actionable.

PEMCO Insurance: Shifting mindsets in the claims department

PEMCO Insurance is a personal-lines mutual insurance company based in Seattle. As the team described in their TC presentation, the company’s claims VP set a strategy “to not be be constrained by the past, but instead to focus on what we want to build for the future.” After assembling a team of key players, PEMCO’s team undertook a change management program. By combining industry expertise, business acumen, and analytical talent, the company enabled more efficient claims handling, leading to higher customer satisfaction and a boost to overall business performance.

Ochsner Health System: Making every interaction count

The EVP of Operations at Ochsner Health System, Louisiana's largest non-profit, academic, healthcare system, set a mandate: Make every interaction count. The analytics team followed through on the vision by bringing third-party survey data together with demographics and interaction data to make NPS scores actionable for their executives, clinic managers, and doctors. It's now possible for everyone to track exactly how they stand relative to their goals and get deeper understanding of how to improve customer experiences.

Using a single Tableau dashboard, adjusters can track every claim they have open, follow up with customers and close claims in a much timelier manner. As a result, they’re able to provide a much better service when and where they couldn’t before.

Enable career growth in service

Analytics offers a powerful way to transform challenging service jobs into rewarding careers helping customers. For frontline service teams, analytics can help anyone understand how they are performing and identify where they can improve. For service mangers, analytics can uncover insights that enable them to coach reps more effectively. And for service analysts and operations professionals, analytics can uncover opportunities to creatively use data to deliver better customer experiences. Here’s how three brands have transformed their service organization by using analytics to support career growth.

Cox Communications field service improves with self-service analytics

Cox Communications provides digital cable television, telecommunications and home automation services in the United States. The field service unit’s goal is to provide the efficient, high quality support. Repeat calls—-when field service has to visit a customer twice in 30-days—-indicate opportunities for improvement. In their TC presentation, Cox Communications shared how they empowered field service reps to see what types of calls drove repeat rates so they could prioritize learning key skills.

Delta Dental empowers managers to understand calls and coach reps

Delta Dental of Washington is part of the largest dental insurance plan system in the United States. The company implemented speech analytics and now call centere managers are able to automatically see how much time reps are spending on each part of their phone calls. Previously, they would have had to physically listen to a sample of calls. Now, managers can instantly look at patterns from every call, and then coach reps on how to improve metrics like call ownership.

Charles Schwab’s service analytics team leverages business acumen

Charles Schwab, one of the largest U.S. financial services firms, created an interaction analytics team to understand the voice of the client and collaborate with its business. The team members all have backgrounds as service reps and managers—experiences that helped them create actionable data insights. For example, the team was able to bring data on corporate actions (or company announcements) together with call volume data and predict future calls from Schwab customers. This enabled Schwab to staff their call centers appropriately and provide better, more efficient customer service.

Turn customer service into everyone’s responsibility

Today’s customer experiences are delivered by many stakeholders outside of customer service. For example, positive or negative experiences can be created by account executives, web site developers, product managers, and more. Giving these teams insight into customer satisfaction and preferences—what customers love or hate--is essential to helping your business deliver better customer experiences. Here are service teams that are sharing data with other departments to turn customer service into everyone’s responsibility.

Tableau informs product developers with customer metrics

Tableau’s technical support team has more than 400 employees that help with more than 100,000 transaction a year. A key area where the team helps customers is with upgrading to new versions of Tableau products, which are released on a quarterly cadence. The team created a dashboard that enabled the product team to see the value of releasing bug-free software by sharing metrics on case support cases per product registration. The metric has become a key quality indicator for the development organization to track that helps them deliver value to Tableau customers.

VMWare empowers employees to understand customers

The CEO of VMware, a U.S. software company, put customer experience in the company’s goal. He said: “VMware exists to delight our customers, partners and employees." In response, the analytics team prioritized examining loyalty by understanding its Net Promoter Scores. By providing broader access to the scores and speeding up the delivery of the scores, VMware informed employees outside of service to make the right decision for their customers.

Abercrombie improves customer service through merchandise planning

For Abercrombie & Fitch, a leading global apparel and accessories retailer, the art of merchandise planning is critical: The company must accurately interpret customer demand and stock stores accordingly. Abercrombie puts customers and their needs at the center of all they do. they identify key metrics to make sure the right product is available when someone wishes to buy it. Providing a seamless experience between the store and online is first priority to deliver the quality, personal service that customers want.

JPMorgan's marketing team prioritizes customer experiences

JPMorgan Chase & Co. (JPMC), is a leading global financial services firm and one of the largest U.S. banks. Tableau now acts as the front-end for customer analytics and Marketing has built robust data sets tying the line of business relationships like products, marketing, and service touch points with customer data to evaluate customer relationships. The outcome is quick wins versus putting items on a roadmap to eventually be addressed.

现在,我们的一切工作都必须以客户服务为中心,并且我们必须在客户意识到某种需求之前提前行动。我们之所以能够实现这个目标,Tableau 起到了巨大的作用。

Ready to get started?

It’s unlikely that you can execute all of the examples you’ve seen here simultaneously. Instead, select a strategy or use case that will help your team deliver lots of value, quickly. Then, there are three great options to follow up depending on your role and your organization’s needs.

Start a free trial

Tableau offers free two week trials to help your service analysts start proving the value of our platform. Our Salesforce Starters and ServiceNow Starters offer users of the technologies pre-built dashboards that enable them to get off the ground even faster. And with the support of our online community and free online training resources, you’ll be amazed at how far you can go.

Schedule a demo

Tableau’s solution engineers are experts at working with customers to help identify how Tableau will fit in their technology stack so that they can see the value of our analytics platform. Schedule a call with our sales team to get started.

Learn how to scale Tableau

Tableau has studied what the most successful organizations do to deploy analytics and published the findings in a step-by-step guide called Tableau Blueprint. Blueprint will help you select your most valuable use cases, drive consensus with your IT and analytics teams, and execute on driving value in a repeatable, scalable way.