Save time with these 10 Tableau shortcuts
Note: The following is a guest post by Tableau Zen Master Jeffrey Shaffer.
We all want to see and understand our data—and fast. So I thought I'd share 10 Tableau shortcuts to help save you time.
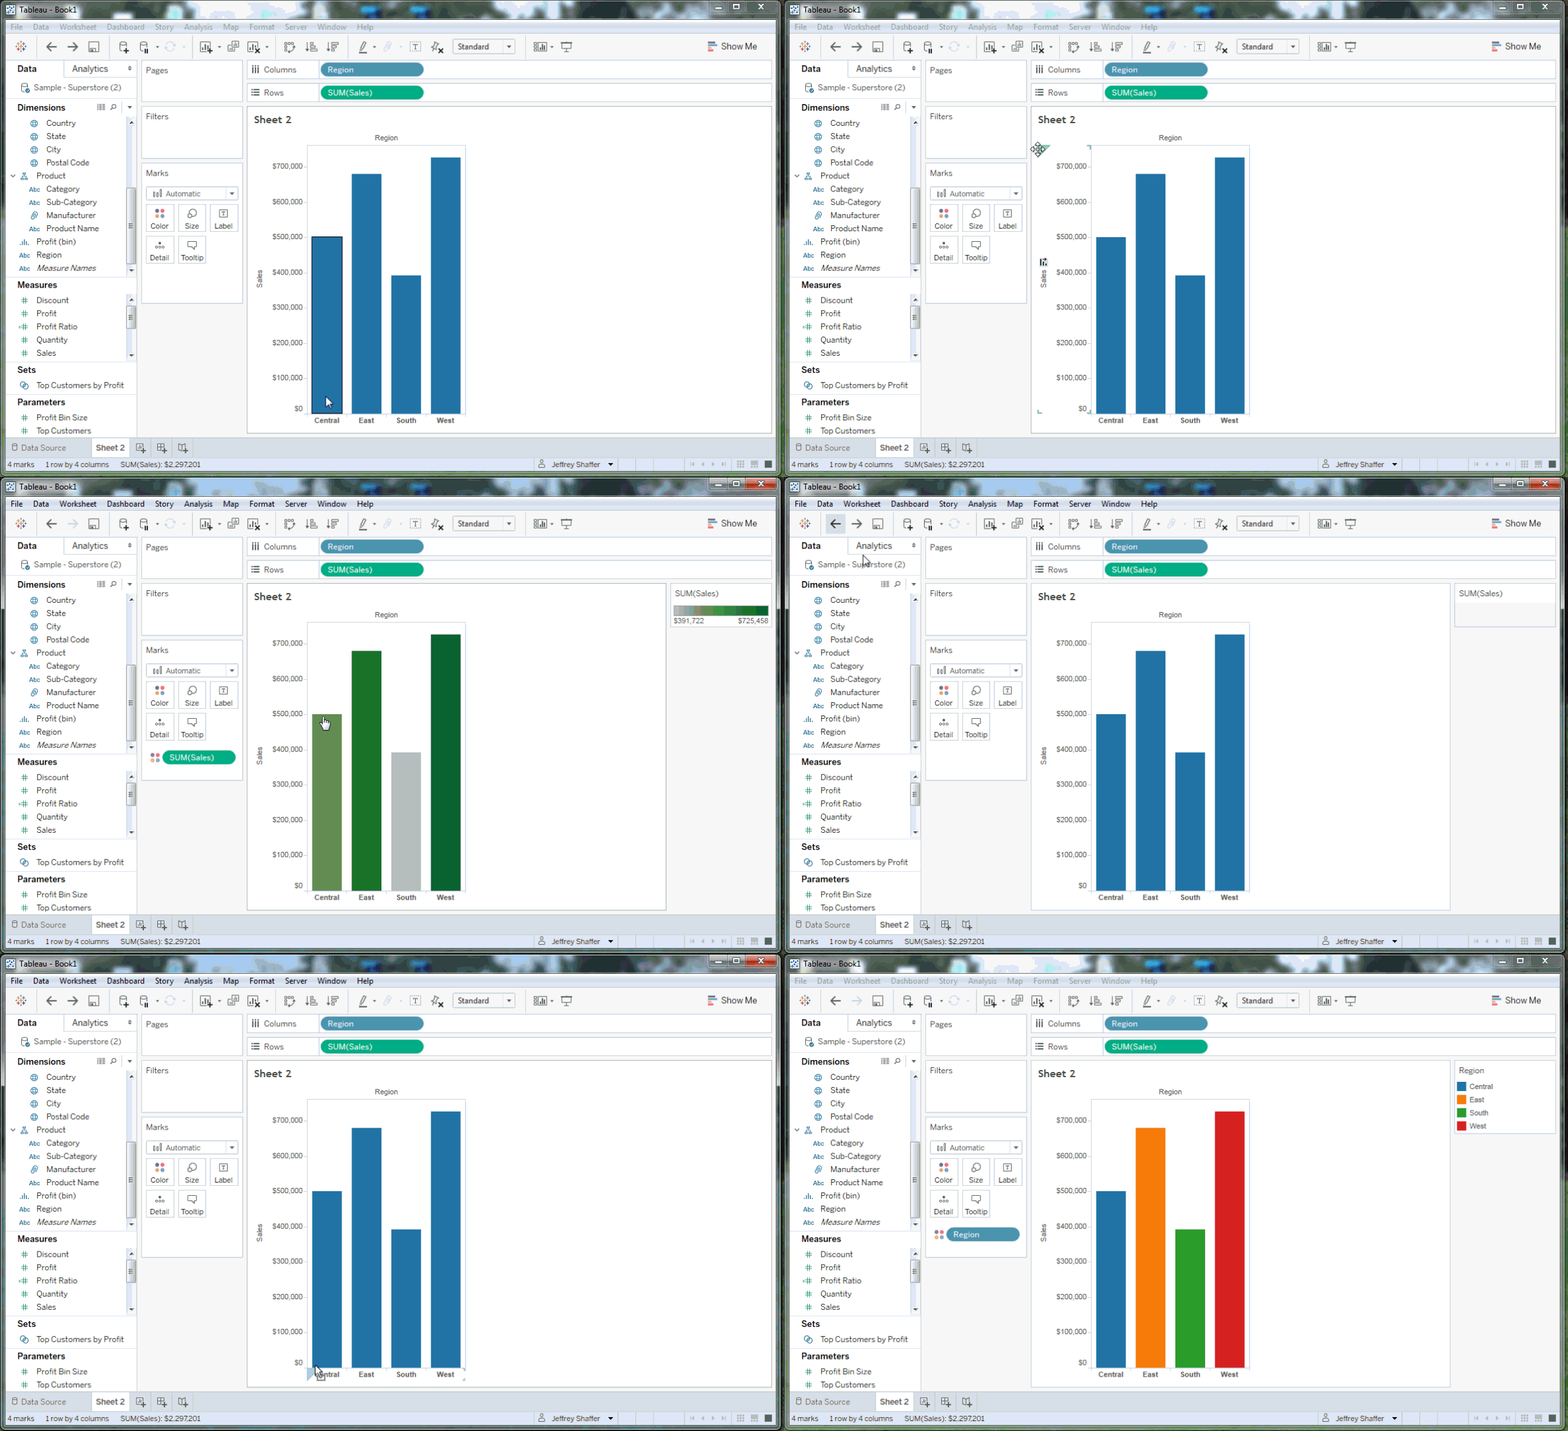
10. Drag pills to the chart area for quick color
We all know that you can drag a pill to the Color shelf to assign color. You can also drag a pill to the chart area—for example, right on top of a bar—and it will also assign color.
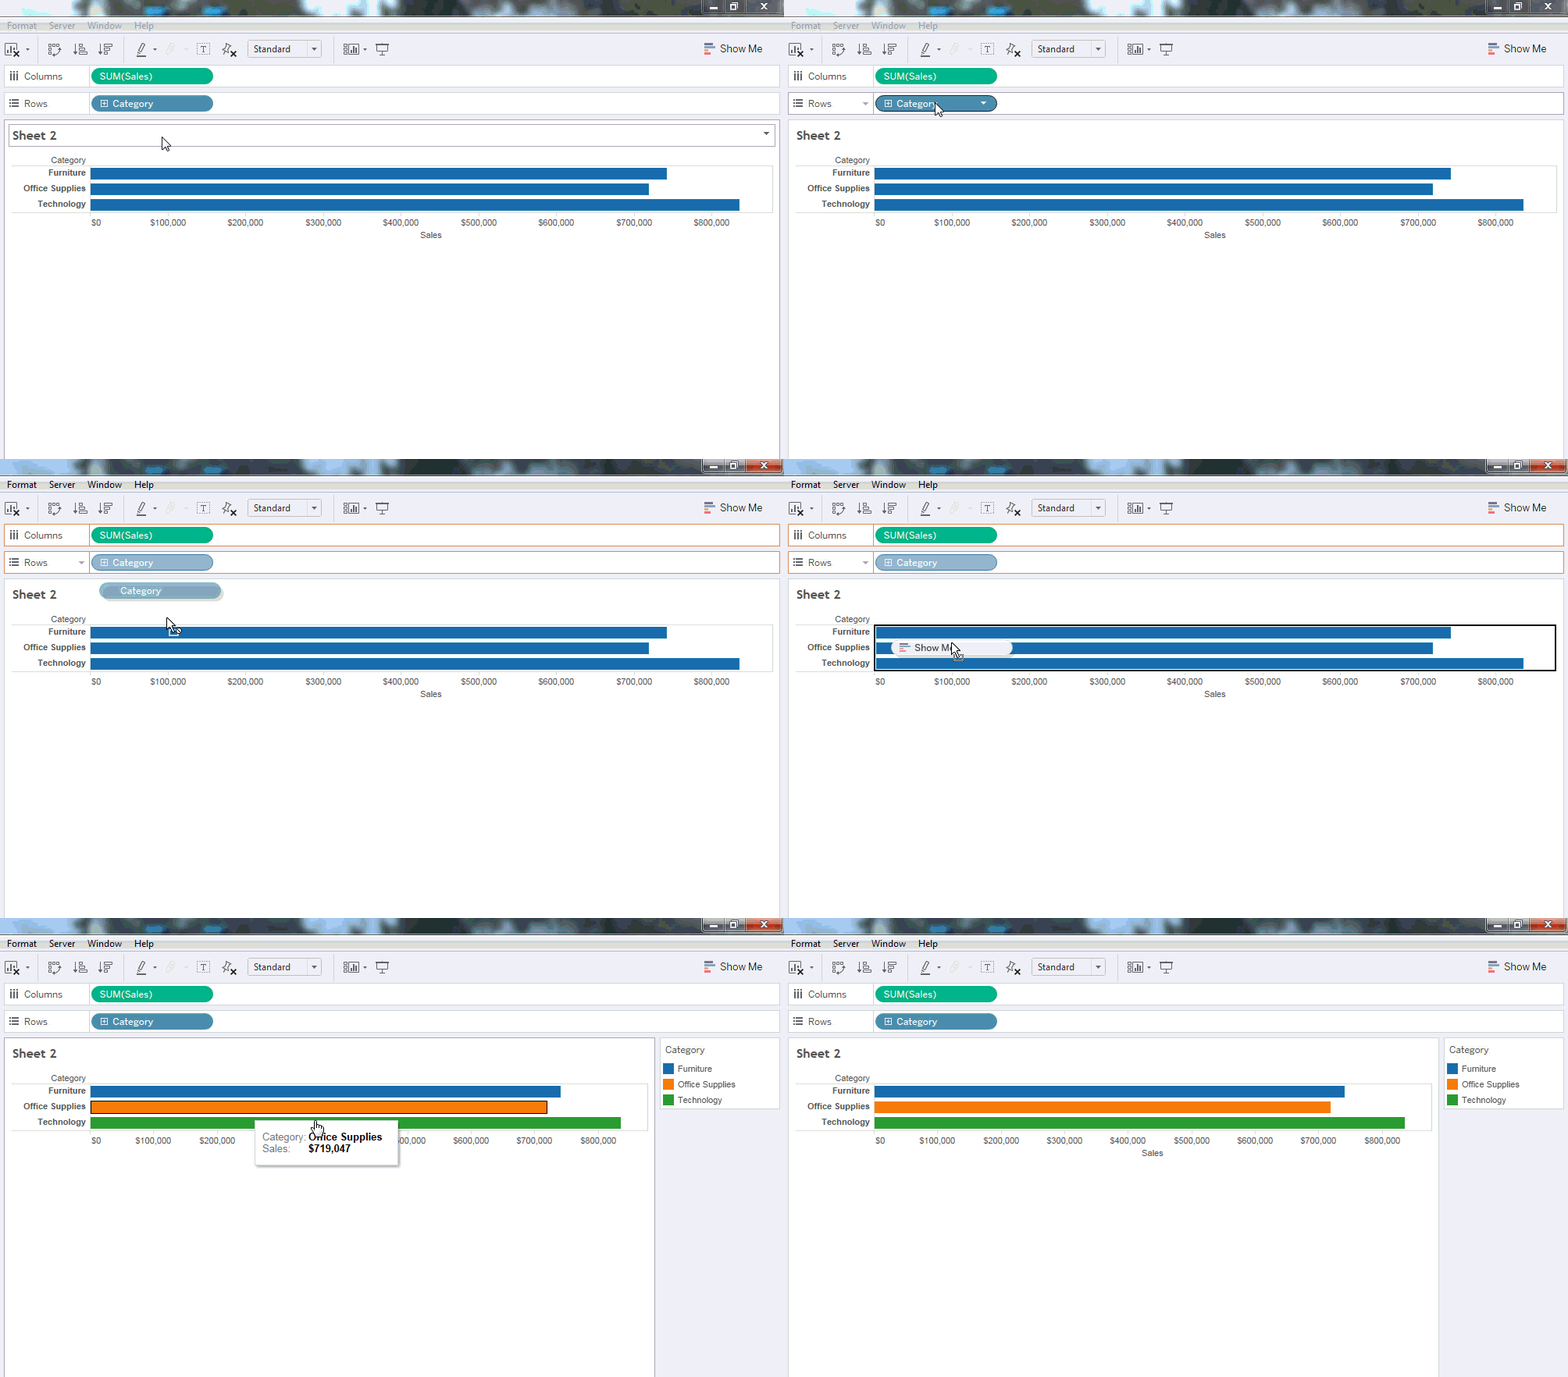
Note: One issue with using this method is you can't assign double color, meaning you can't place two blue pills on the chart area for color. If you do this, one will end up on color and the other on detail.
However, if you multi-select two blue pills and drag them to color, you can have two blue pills on Color. Be careful how you use this one as color can quickly become confusing with too many categories.
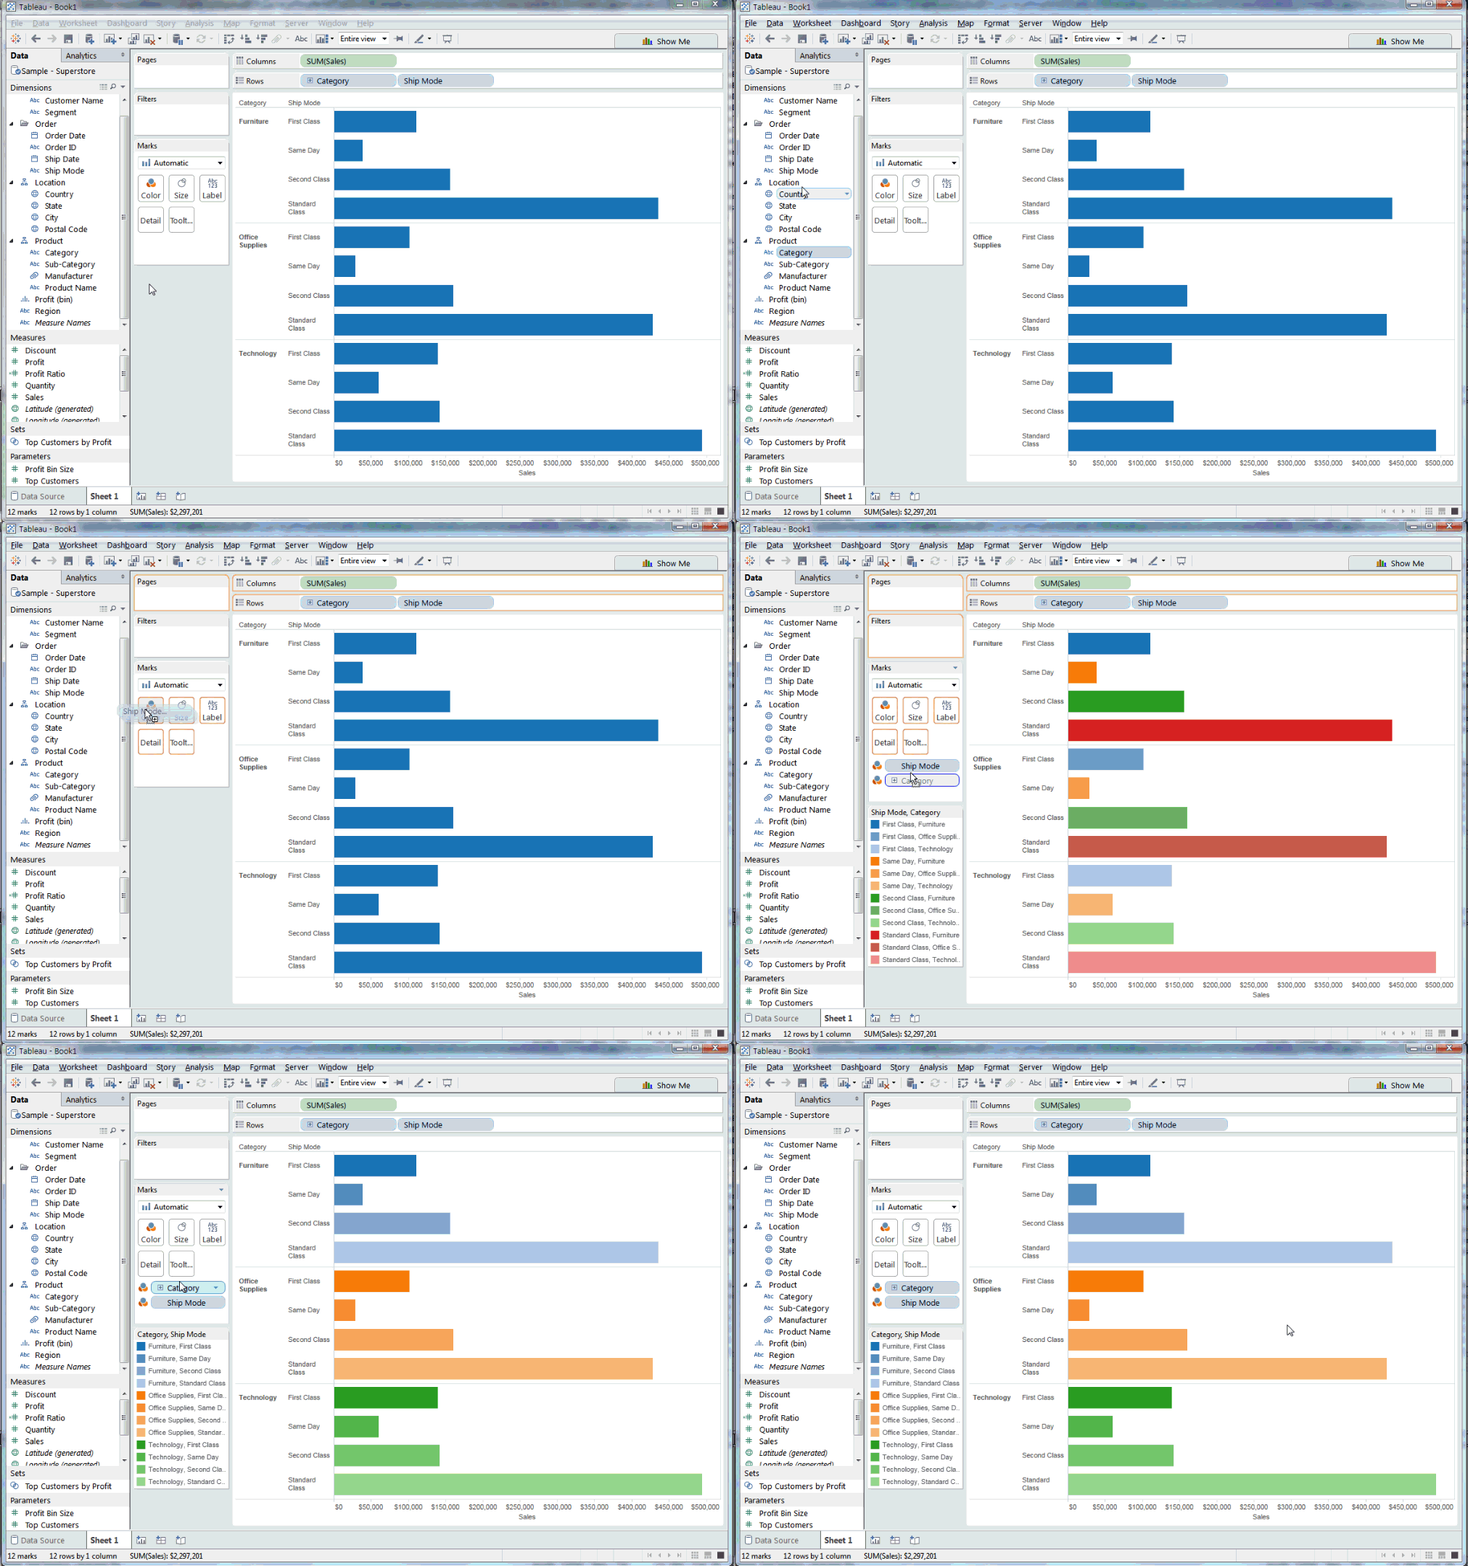
9. Use the CTRL key to multi-select pills to drag on and off the canvas
As you may know, you can use the CTRL key to multi-select colors and other items in Tableau. This same tip can be leveraged with pills as well. In this case, I can multi-select all of the blue pills except one and drag them off of the canvas.
8. Use CTRL-F for a quick search of a field name
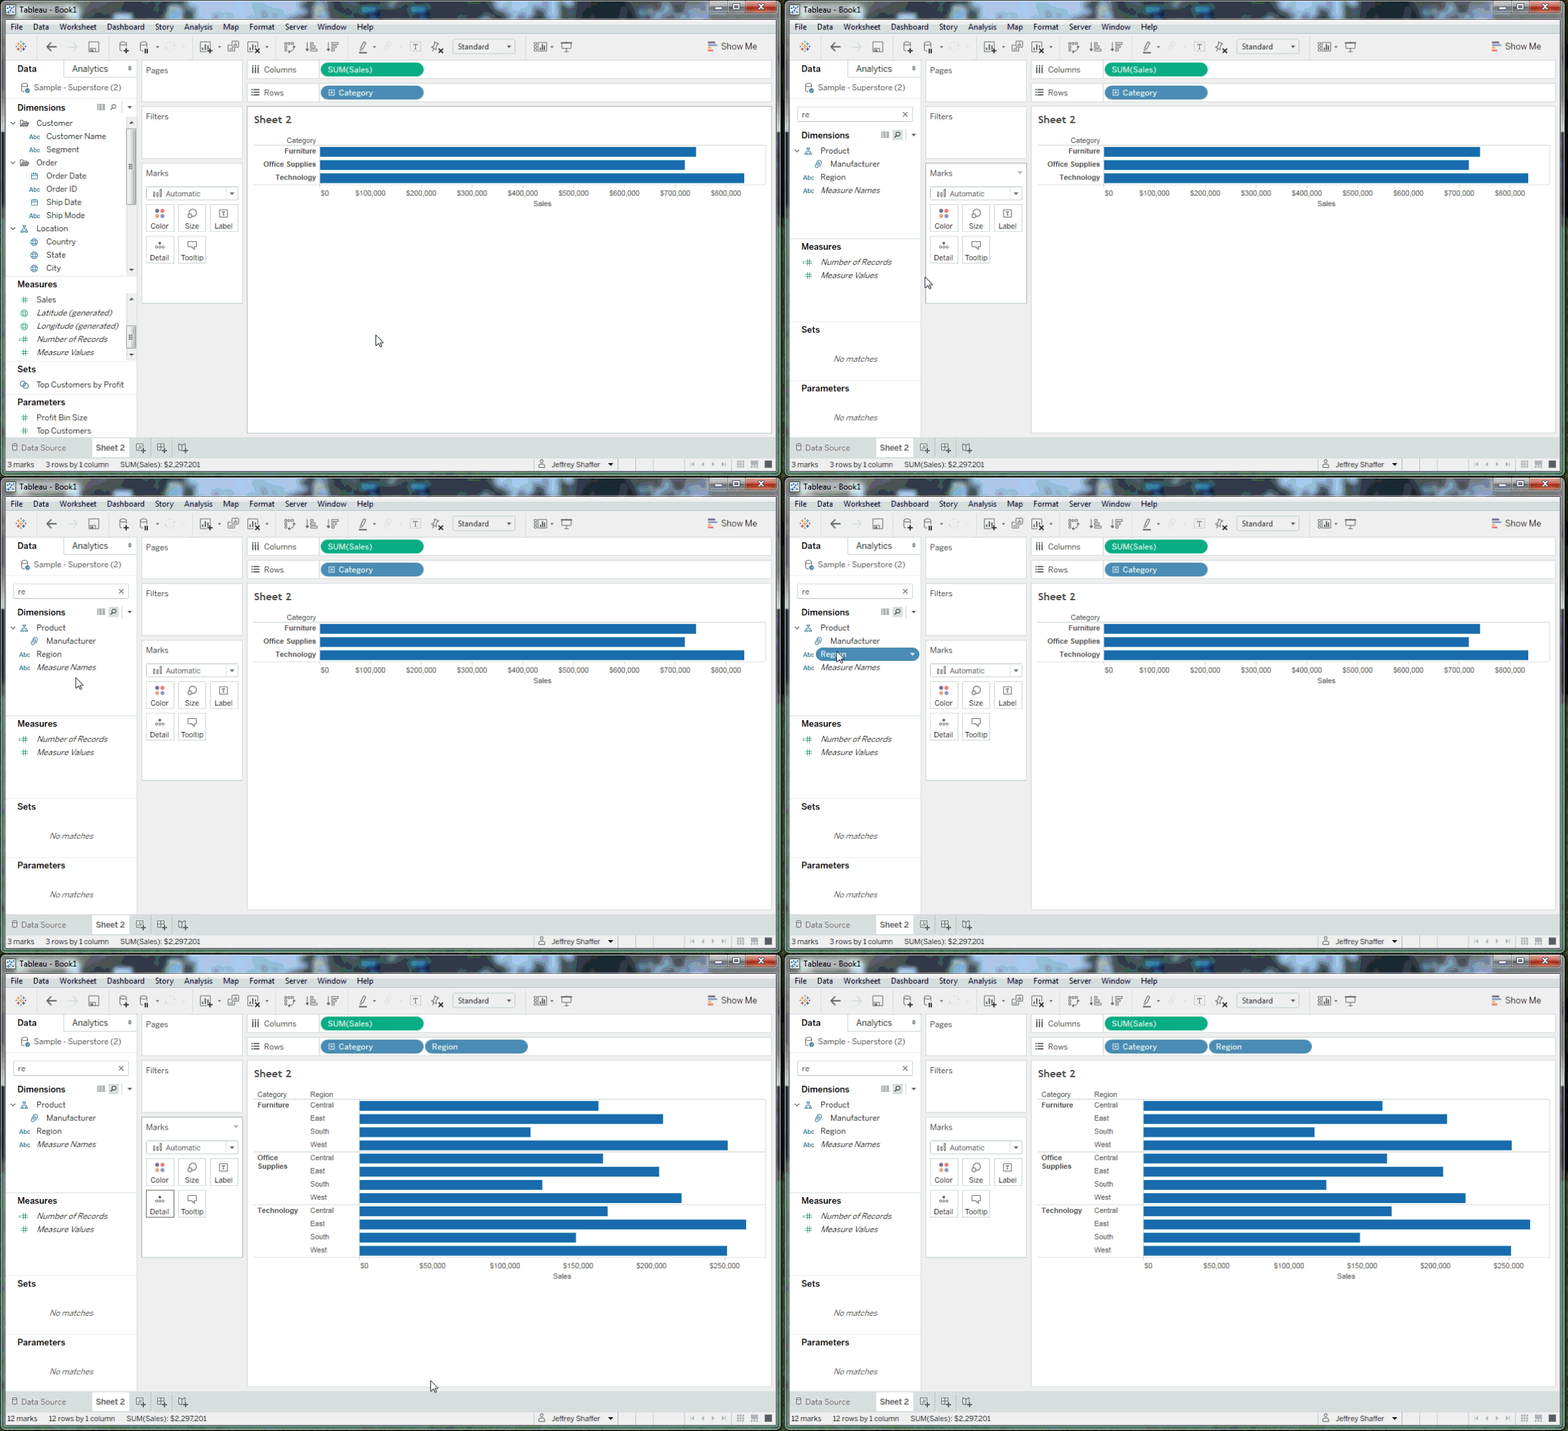
When the data sets get large and there are loads of field names, you may find yourself scrolling through name after name, looking for the field you want. At any point or location in the viz, simply click CTRL-F and the search dialog box will appear above the dimensions. You can also click the small search icon. Entering in the first letter or two of a field name will quickly narrow them down for you.
7. Type field names on the in-line formula
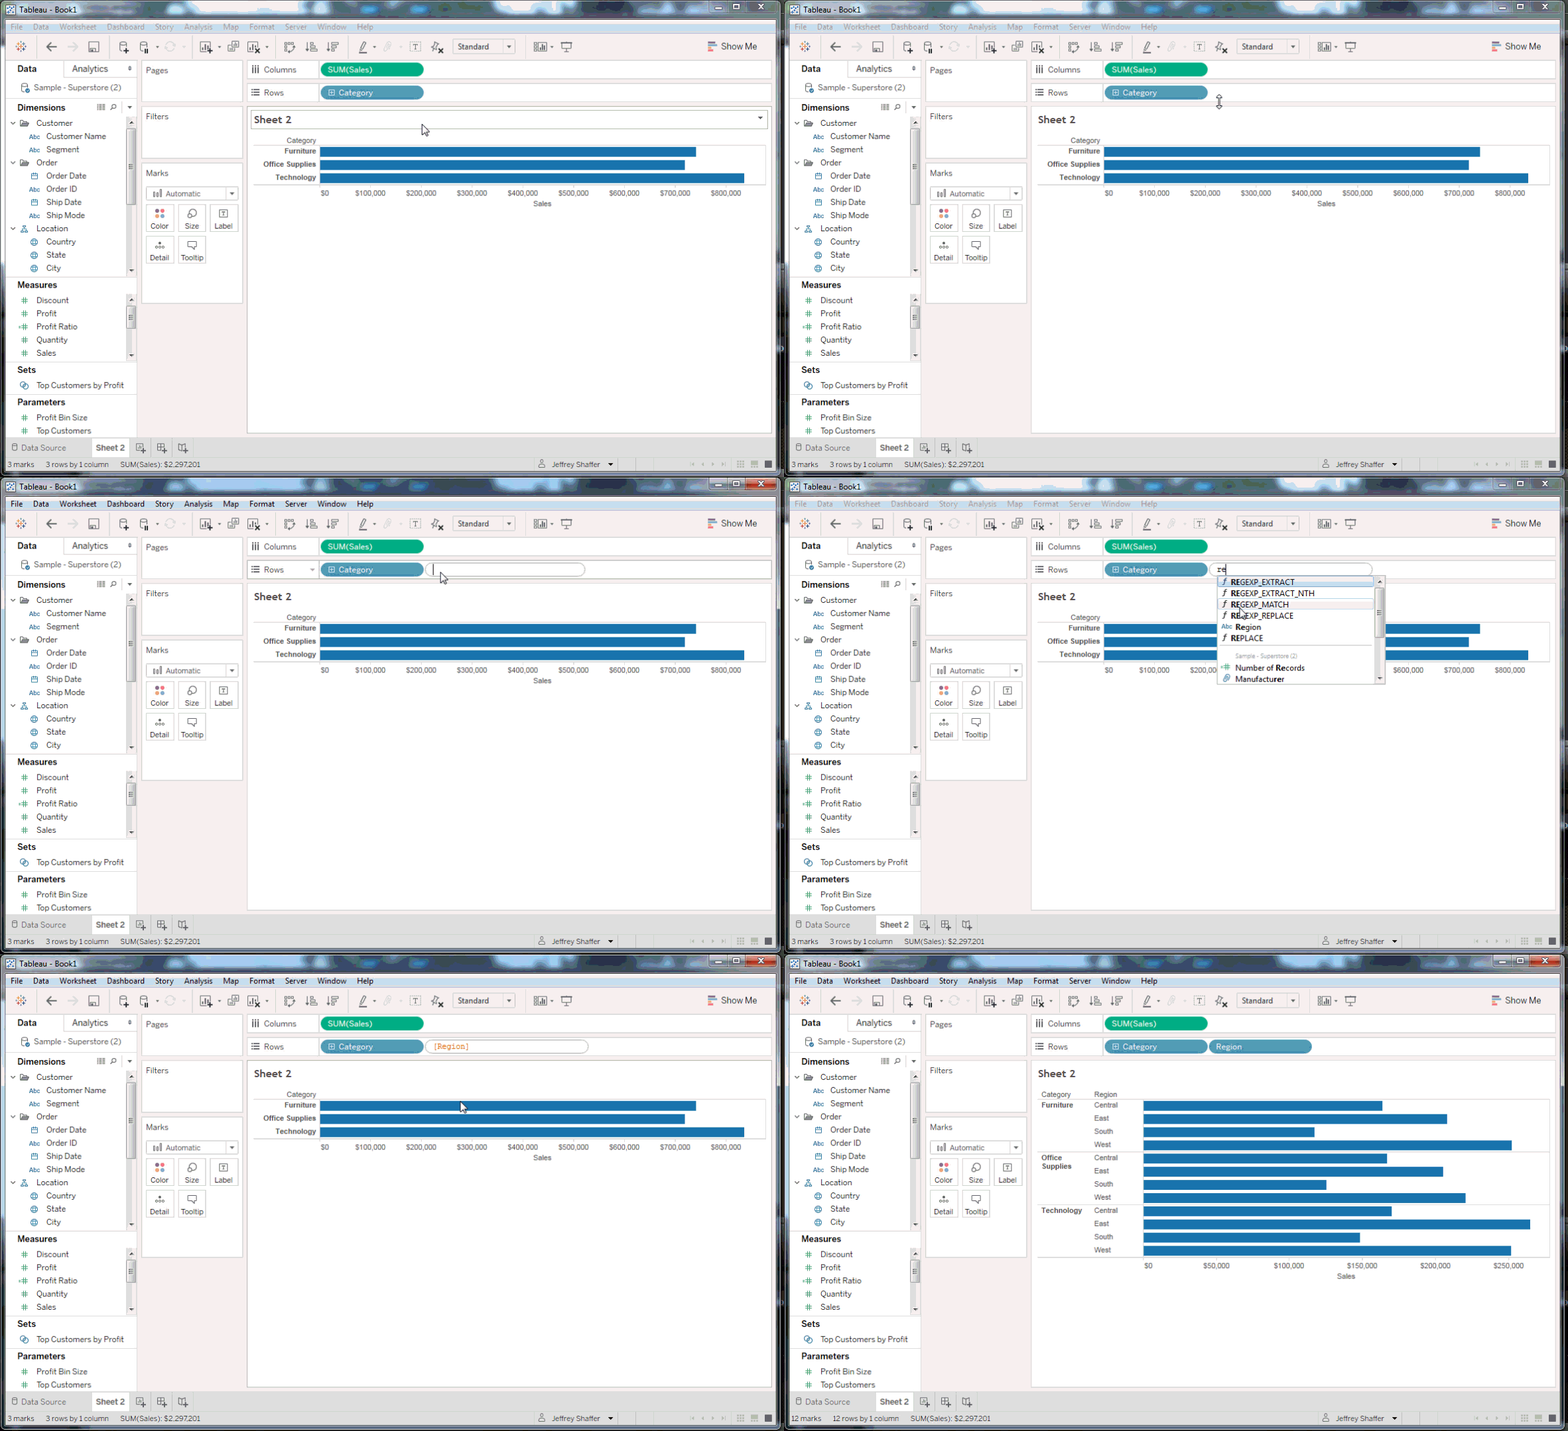
Even quicker than searching for a field, just double-click on the blank space in Rows or Columns, or the white space in the Marks card. A text-box outline will appear, and you can start typing in formulas or field names. As you type the first letter or two, the field names will filter and appear. Simply double-click the one that you want and the pill will magically appear.
6. Right-click and drag a field to Rows, Columns, or the Marks card
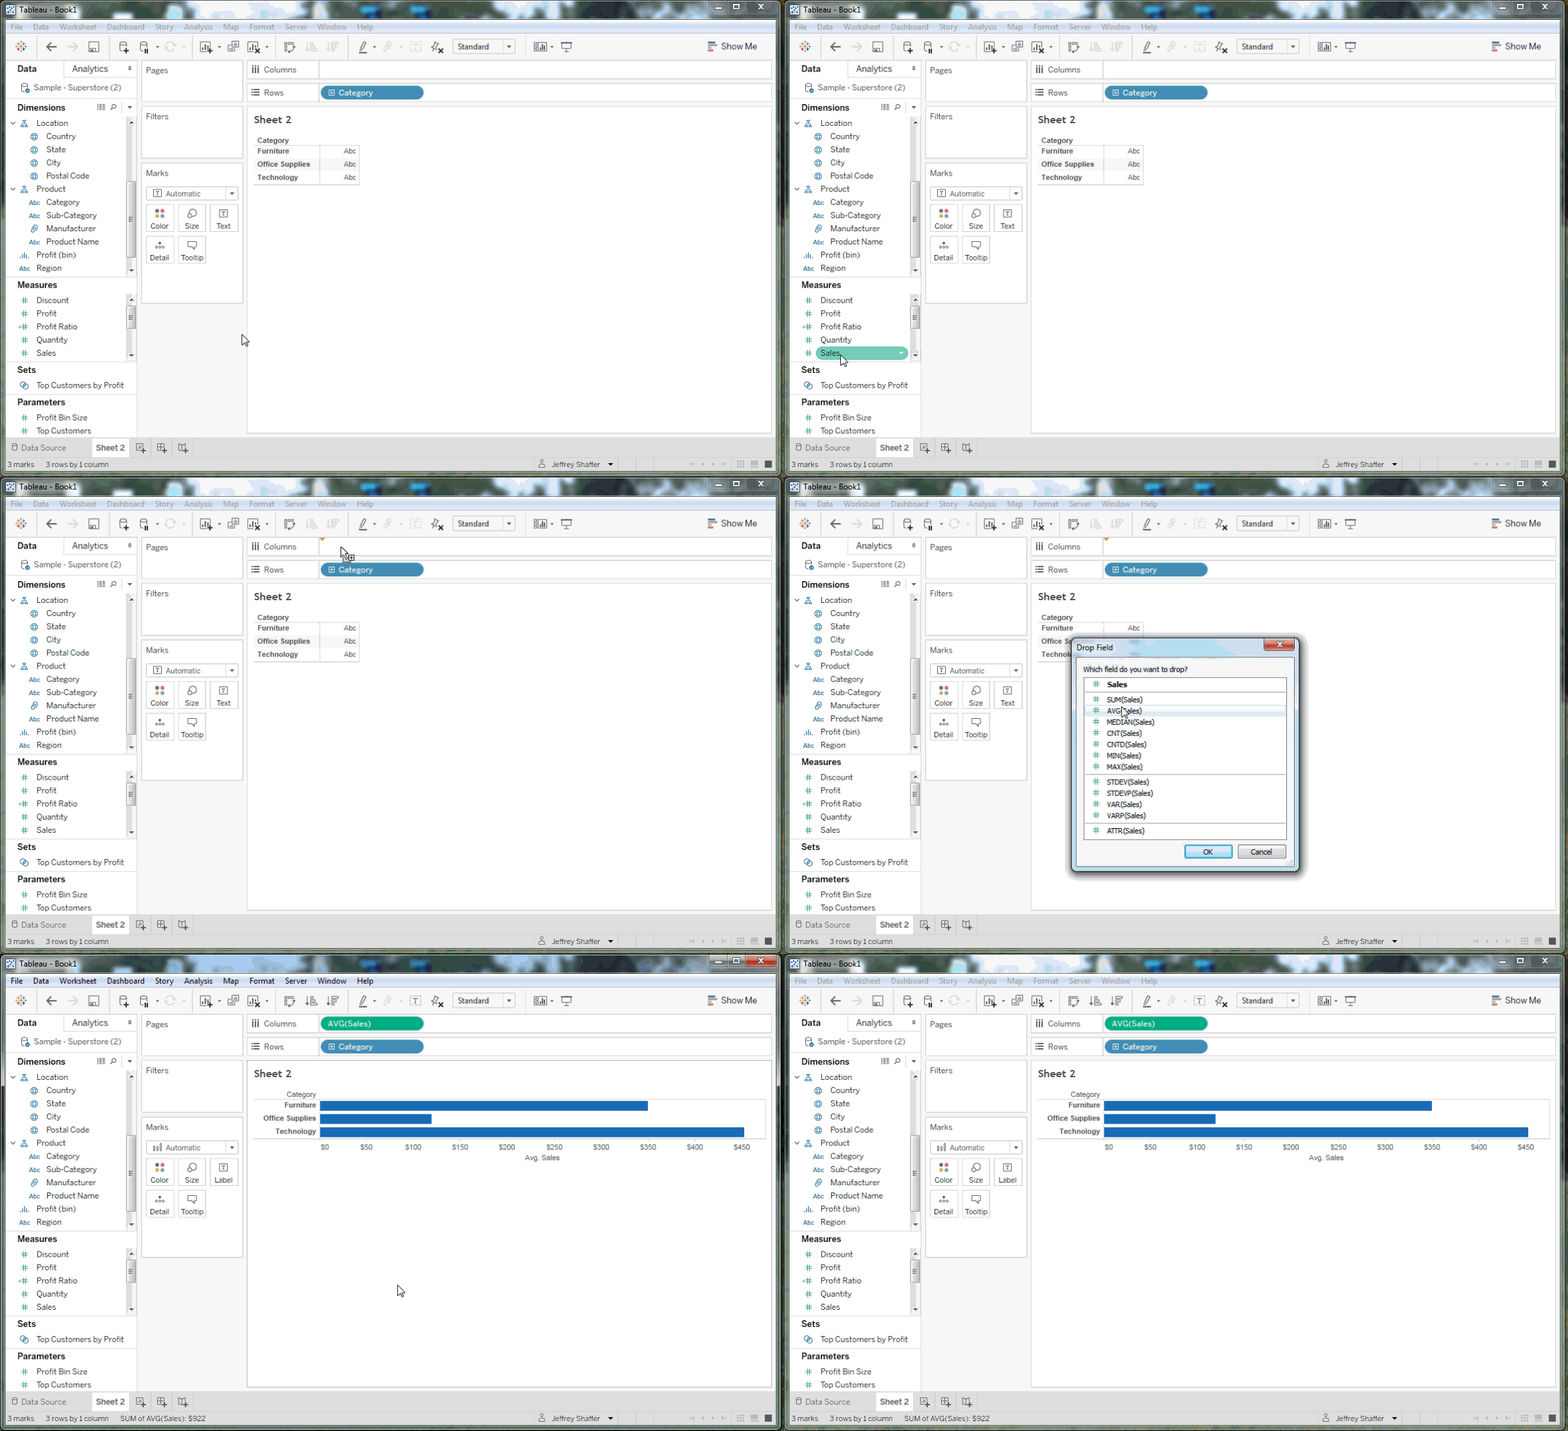
Certain fields such as Sales, Profit or Quantity may have SUM as its default aggregation. You can change this default aggregation, but often times you will want to keep the default aggregation as one thing and use the pill in the viz as a different aggregation.
Instead of dragging each pill and changing the aggregation, right-click and drag the pill. This will give you a dialog box where you can pick the aggregation before placing the pill. For example, Sales has SUM(Sales) as its default aggregation, but using right-click drag, you can drop it on Columns shelf as AVG(Sales) without having to change the properties of the pill.
5. CTRL-drag to quickly duplicate fields
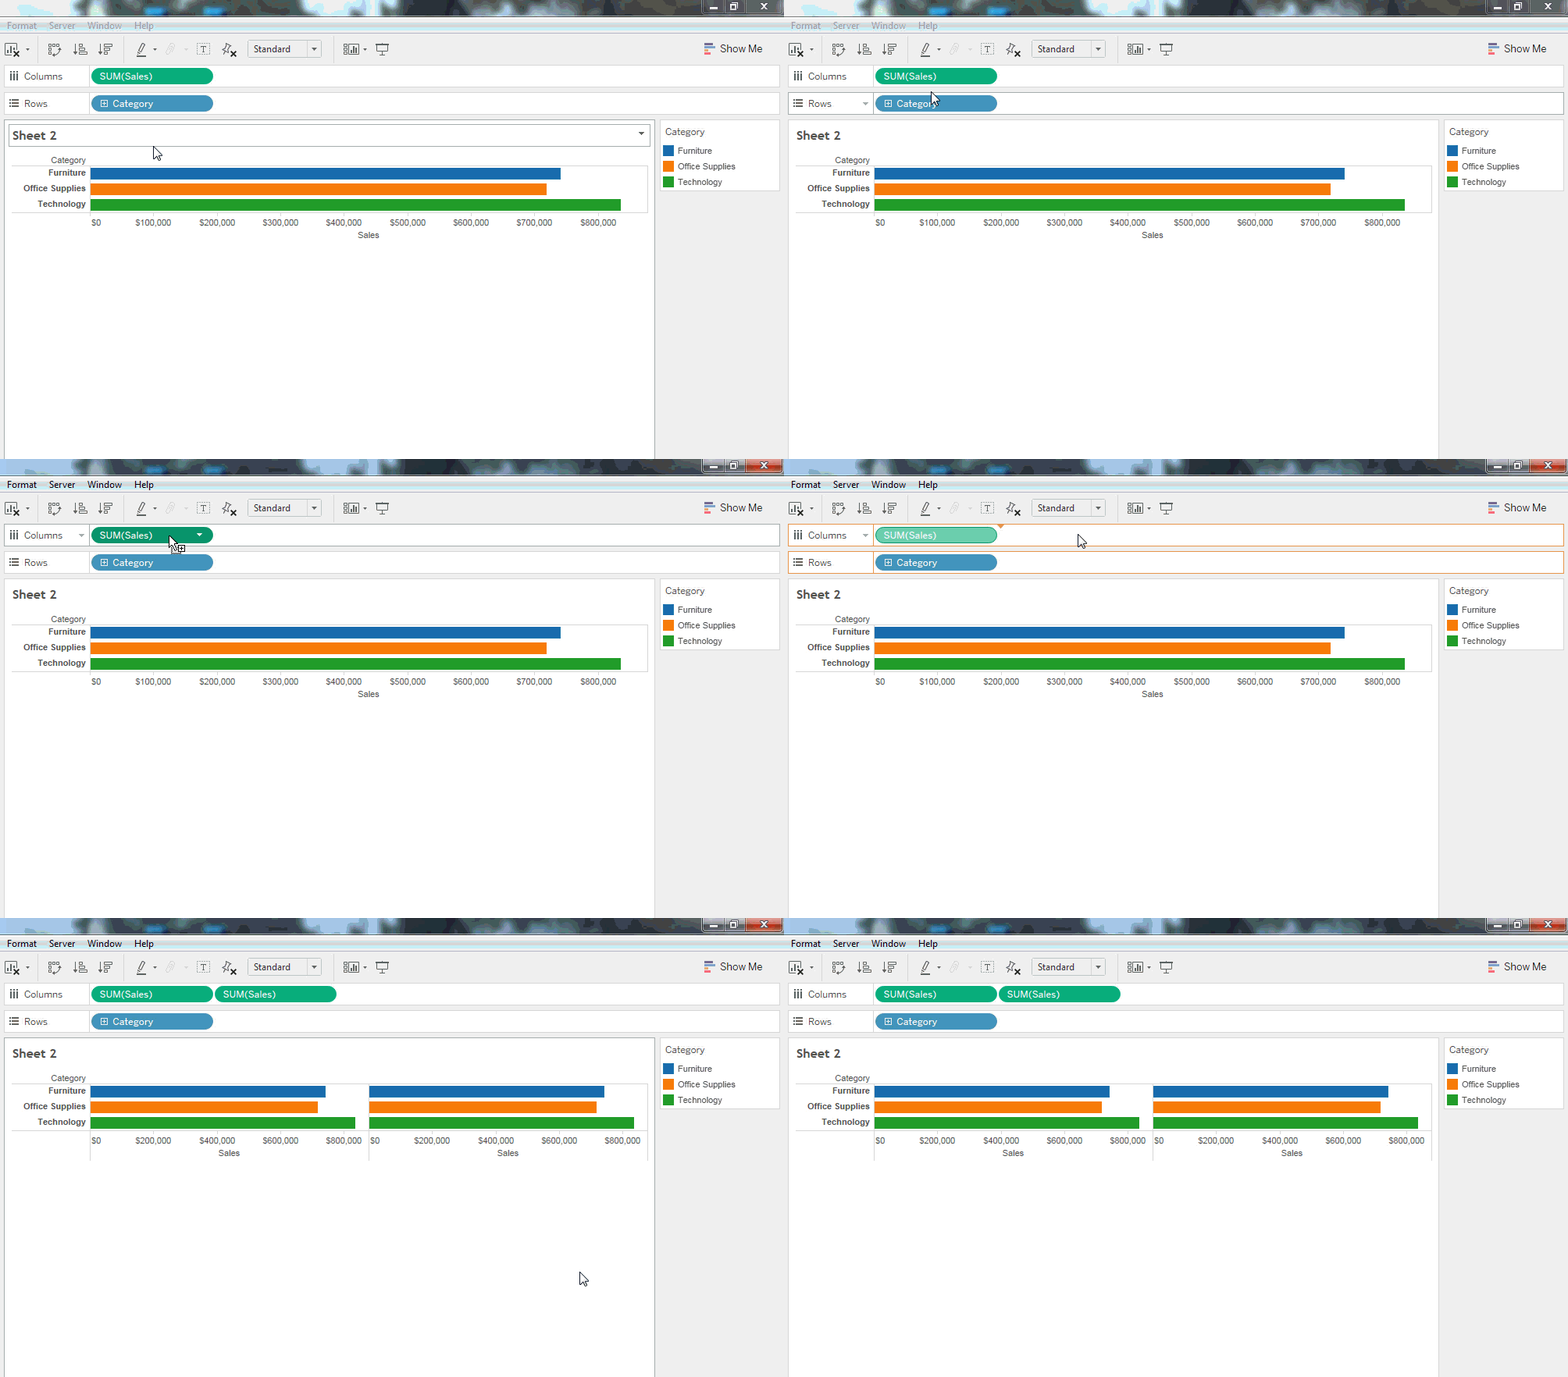
Sometimes you want to duplicate a field using the same pill twice. For example, maybe you're creating a dual-axis chart and you need to duplicate one of the measures. This is a super-quick technique. Just hold down the CTRL key and drag the pill right next to itself.
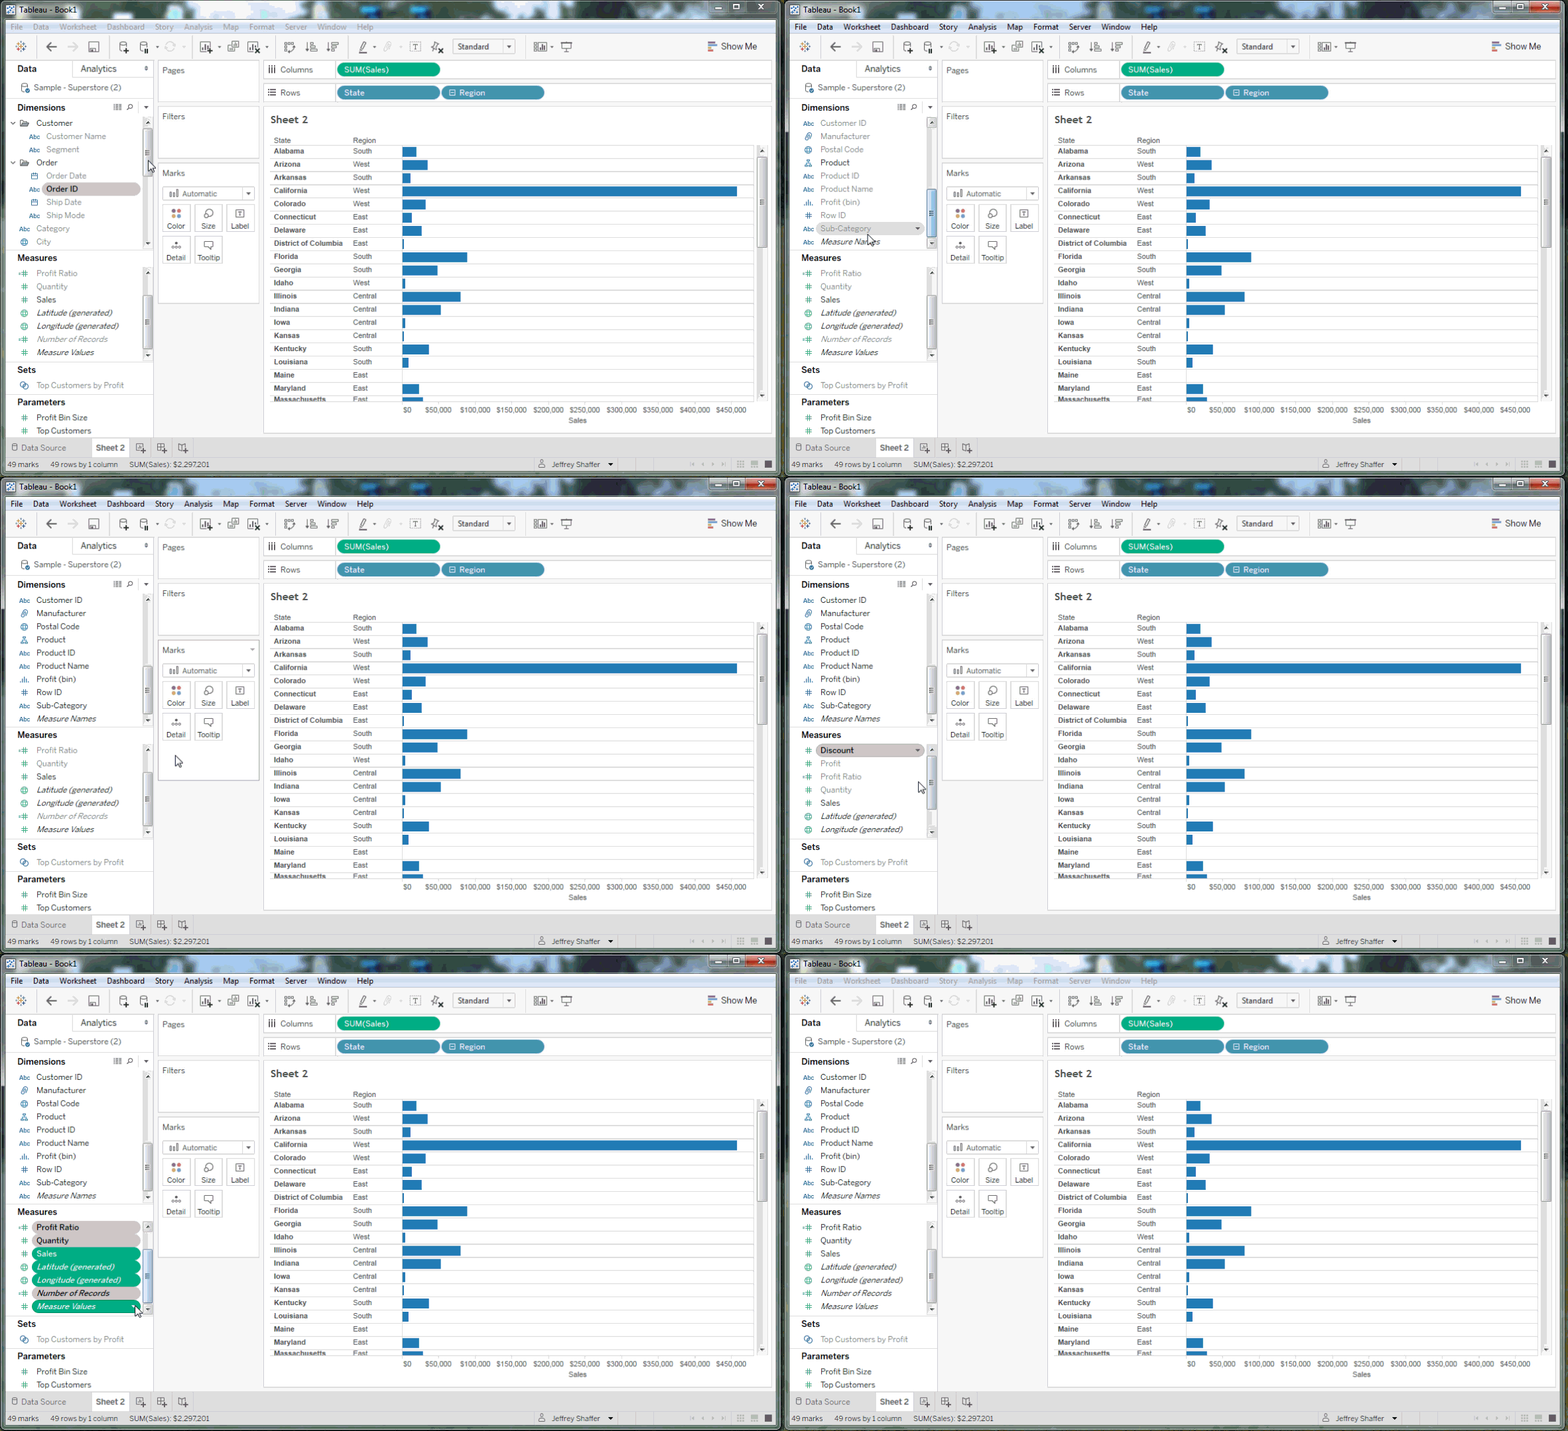
4. Hide fields not being used/show hidden fields
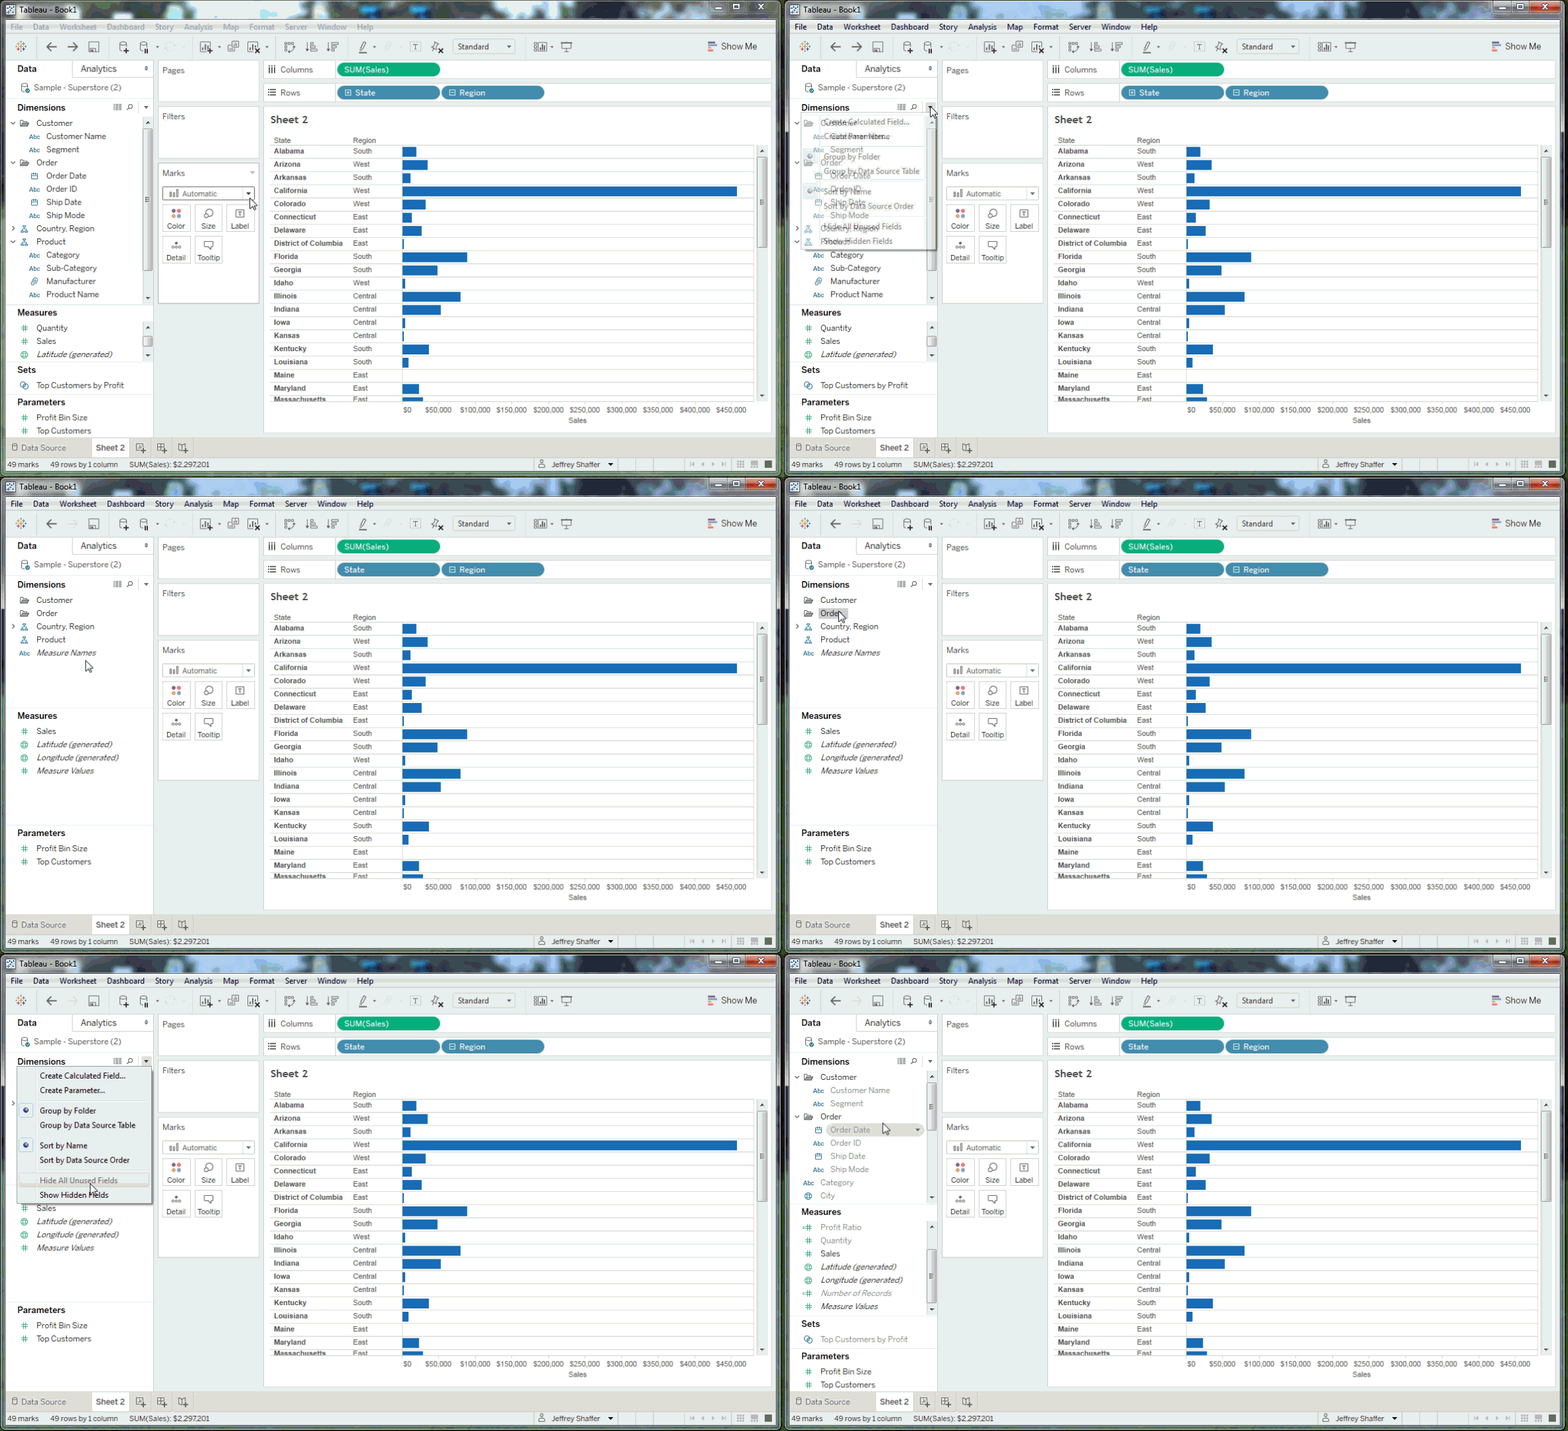
As we already discussed, sometimes the list of field names in the data can be very long. Once you have the fields that you need in the viz, you can make your life easier by hiding fields that are not being used. This will help narrow the list dramatically by only showing fields that are used. Once you do this, you also need to be able to see them again, so the other half of this tip is showing the hidden fields.
3. Unhide hidden fields
Hiding the fields is easy; it takes just a click of a button. But there is no "click to unhide" option for all of them. You can leverage the multi-select option discussed above. Click the first field in the list, hold down the SHIFT key, and select the last field in the list. Then you can unhide all of the fields at once. You will need to do this once for dimensions and once for measures.
Alternatively, you can also click on the data source and do it in one multi-select move. Click the first column in the data, hold the SHIFT key, and click the last column. Then right-click and select unhide.
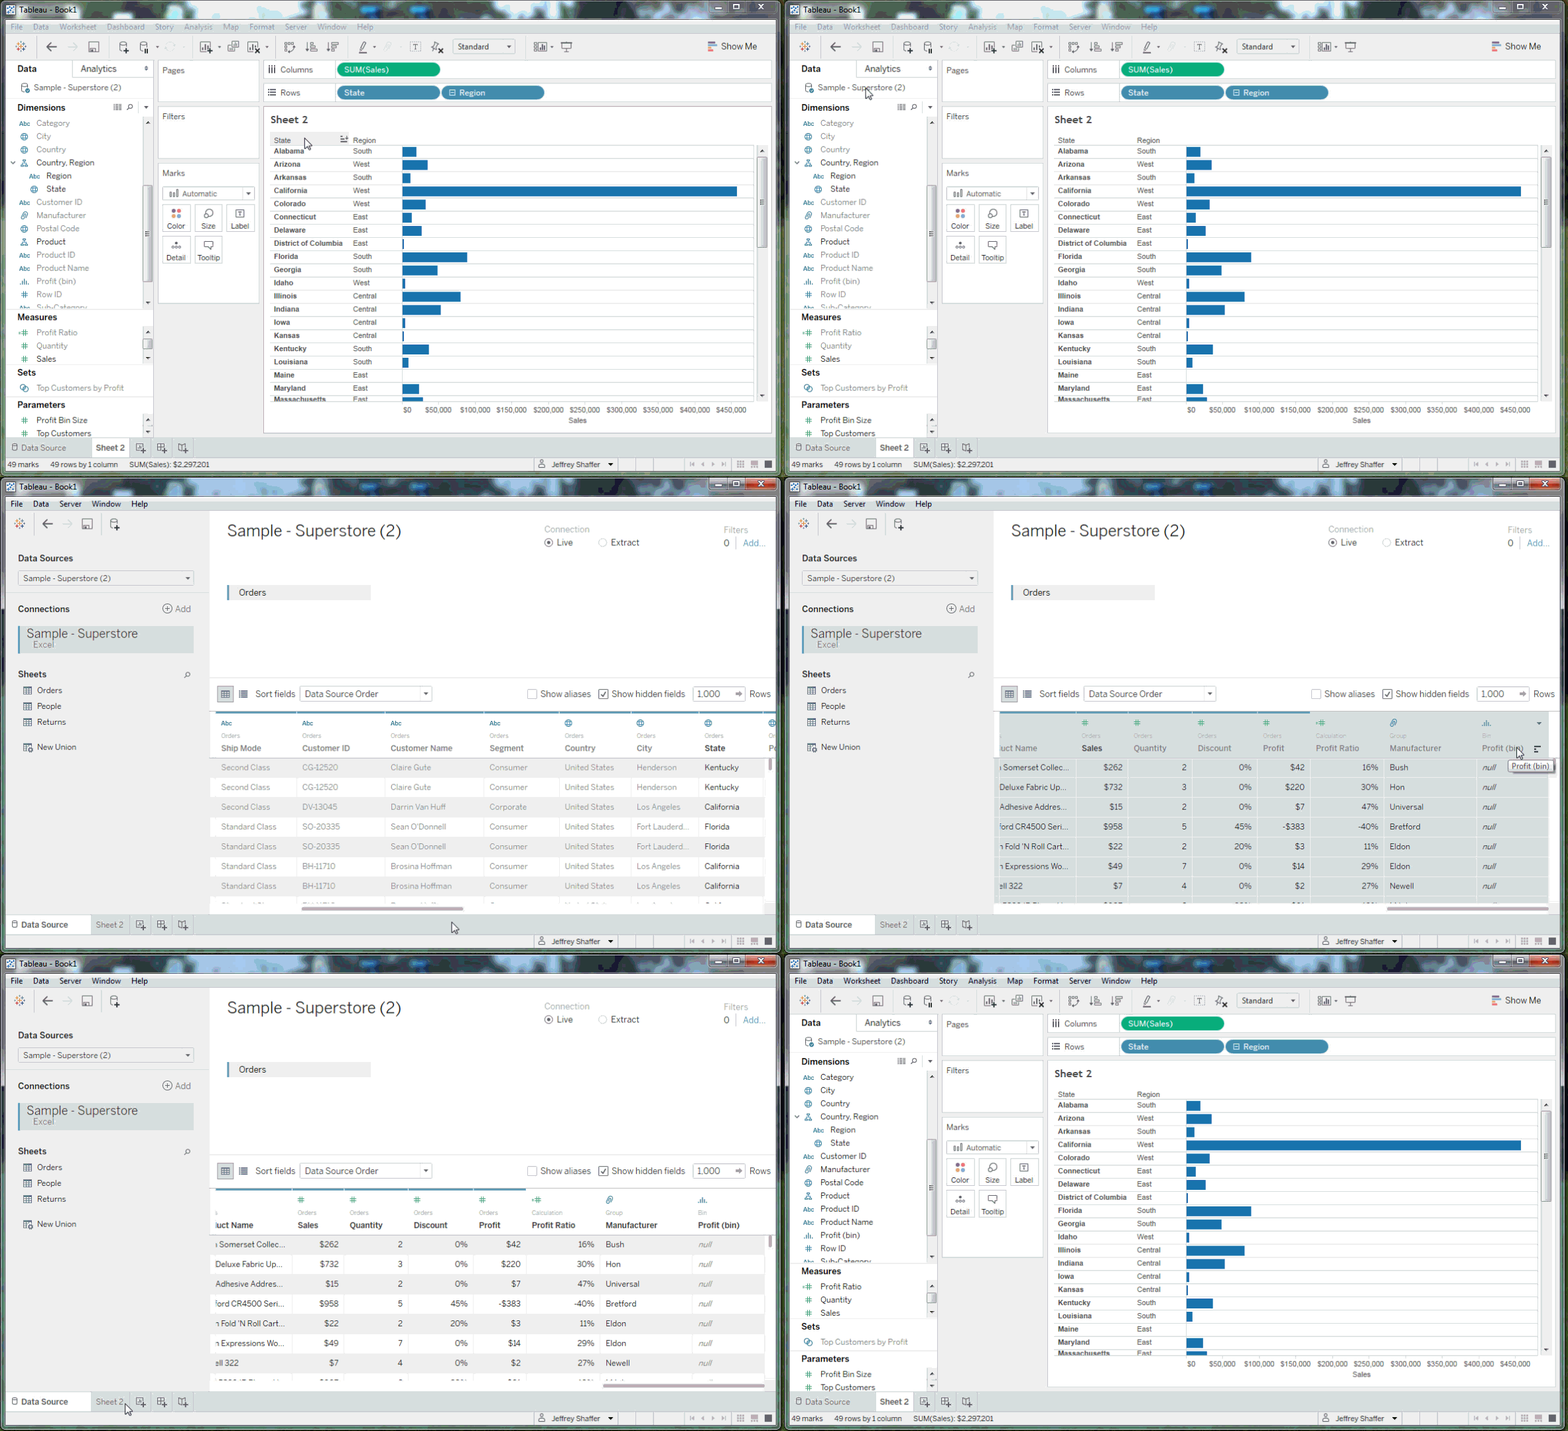
Note: When unhiding all of the fields using either method, the hierarchy is not preserved. You will need to recreate the hierarchy—for example, Location.
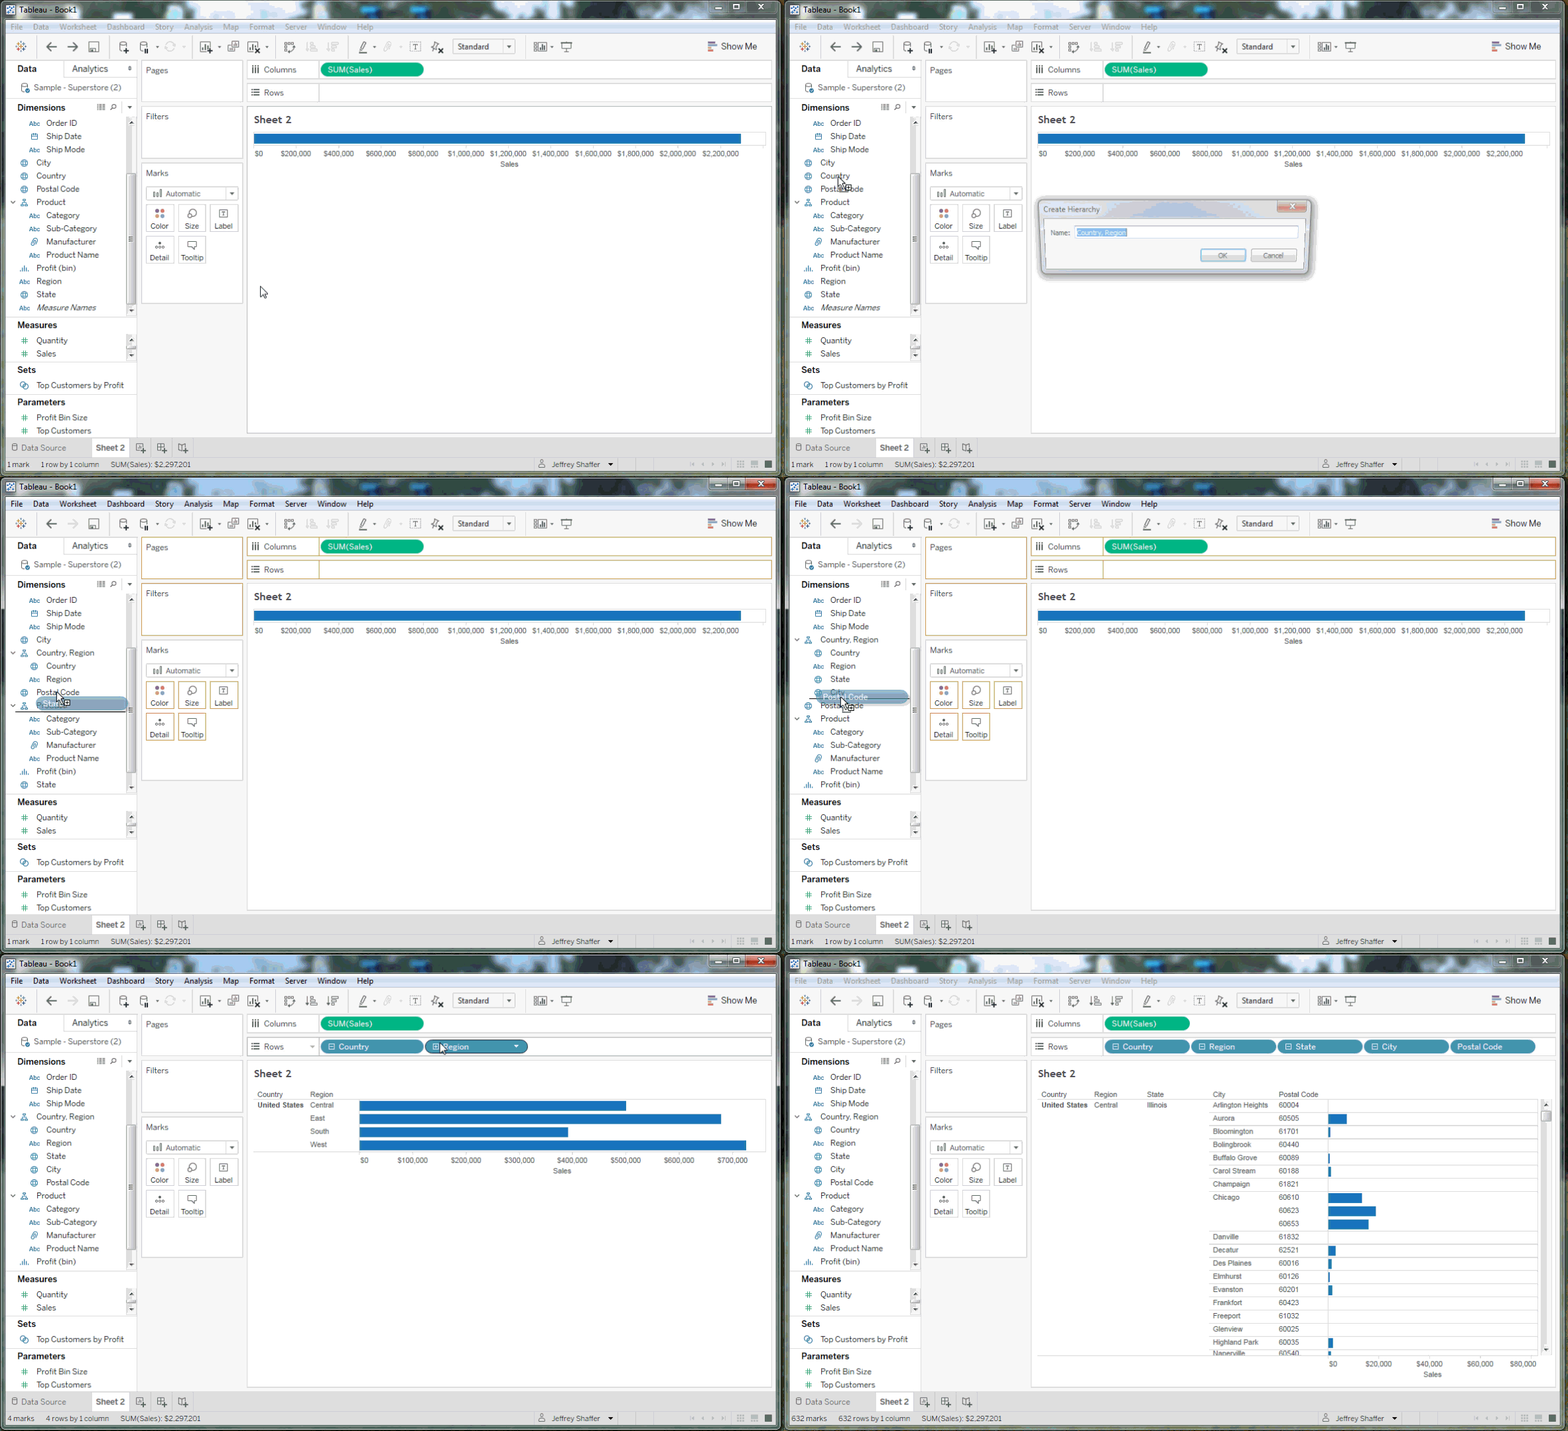
2. Create fast hierarchy
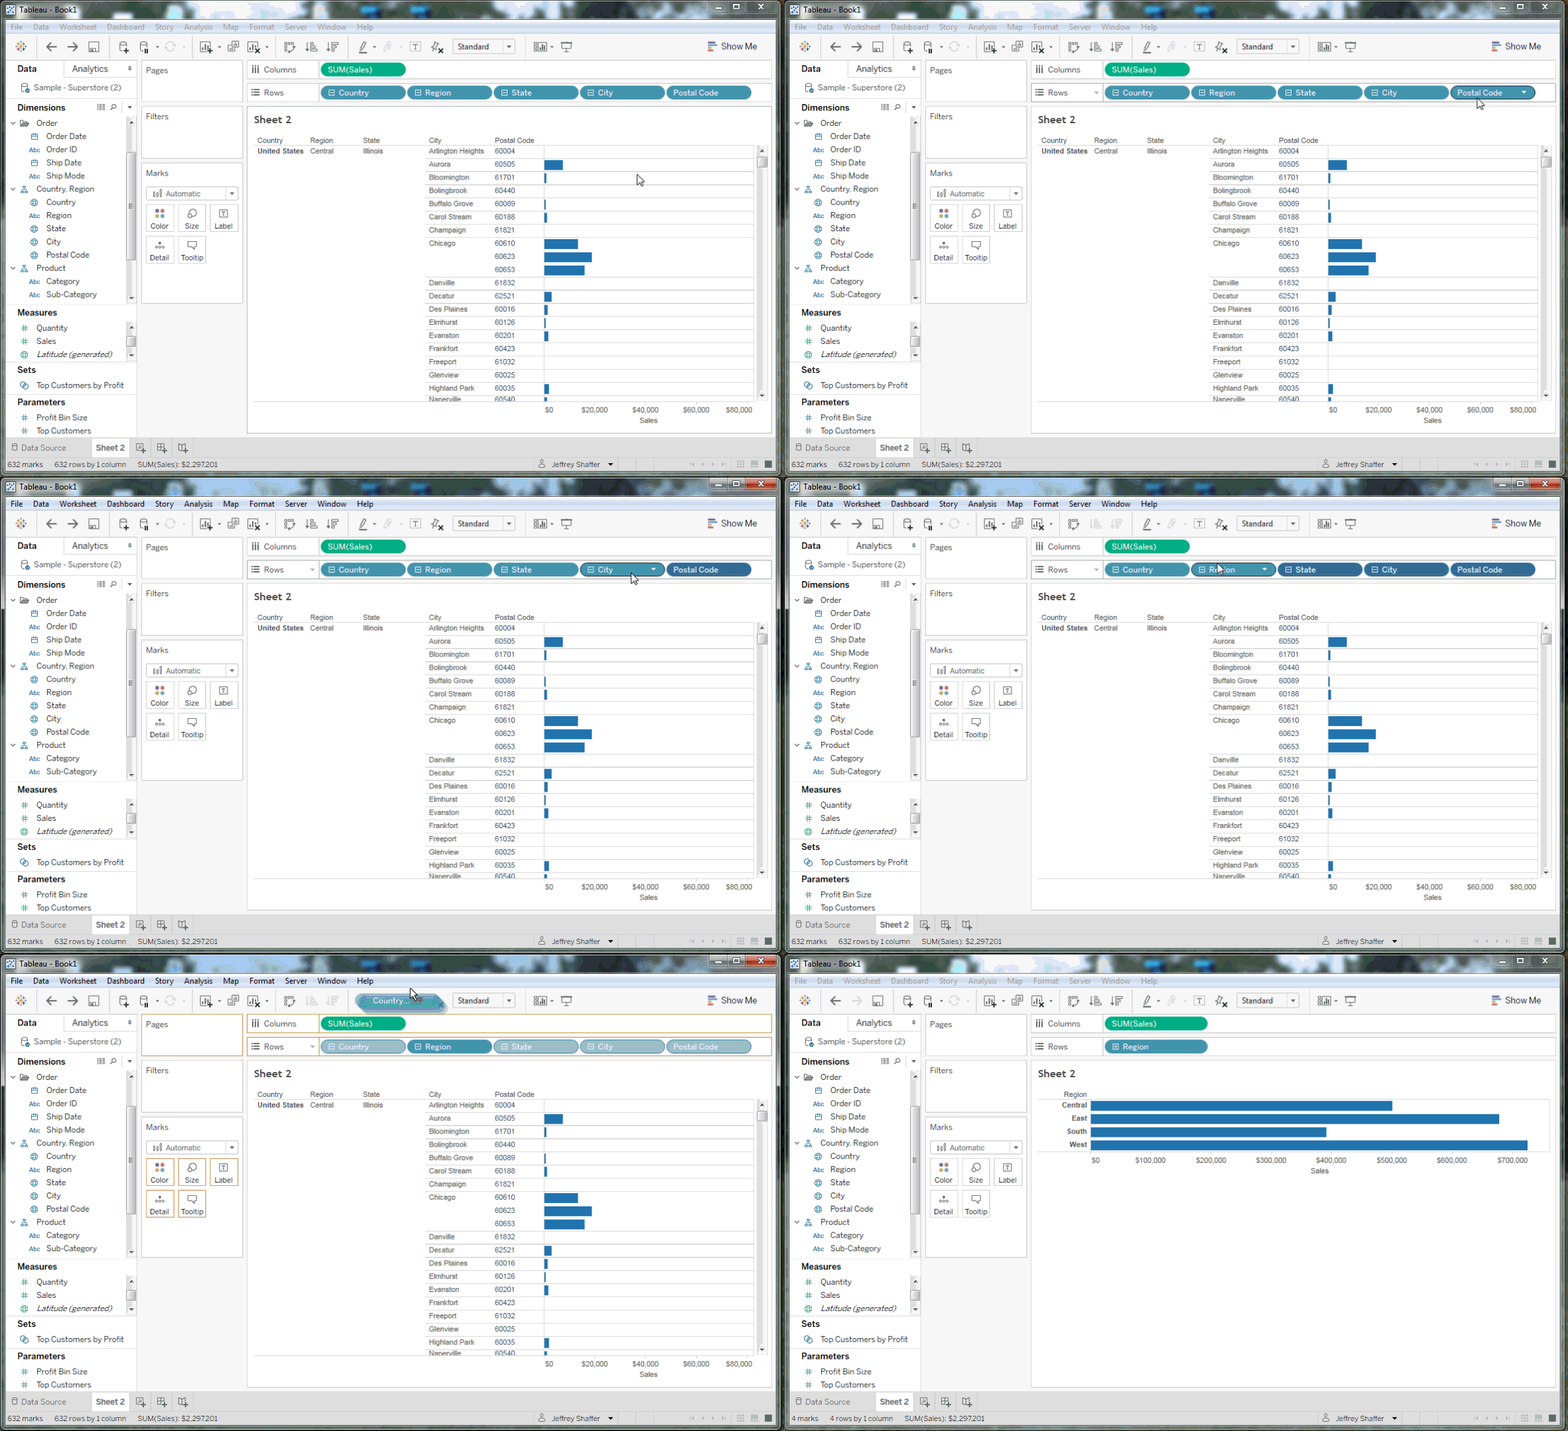
Drag one pill on top of another pill, and you have an instant hierarchy. Then you can drag other pills into the hierarchy and order them in whatever way you want. For example, dragging the Region pill on top of the Country pill automatically creates a new hierarchy. Then I can add State, City, and Postal Code.
1. Drag the x-axis or y-axis to the chart area for color
This is probably the quickest speed tip of all. After you build your chart, simply drag a field that is on your y-axis or x-axis into the chart area, and that pill will be used on color.
I hope you find these tips helpful. If you have any questions, feel free to email me at Jeff@DataPlusScience.com.
For more tips, ideas, and vizzes by Jeffrey Shaffer, check out his Tableau Public page and his blog. You can also connect with him on Twitter @HighVizAbility.
相关故事
Subscribe to our blog
在您的收件箱中获取最新的 Tableau 更新。


