Social distancing floor plan for restaurants: Optimizing capacity
The coronavirus (COVID-19) pandemic is having a significant impact on the global restaurant industry. For businesses to survive, they will have to adapt to a new normal and think of creative and innovative ways to thrive in the midst of adversity.
Editor’s note: A version of this post originally appeared on the InterWorks blog.
The coronavirus (COVID-19) pandemic is having a significant impact on the global restaurant industry. Due to social distancing measures taken by many governments worldwide and general caution in public places to maintain health safety, consumers are dining out less and less. According to a source shared by Statista, the year-over-year decline of seated diners in restaurants worldwide was a staggering 43.35 percent (as of August 8, 2020), and most businesses have endured over three consecutive months of decreased sales.
That’s a significant revenue impact for all restaurants—whether you’re a multi-location chain or a locally-owned restaurant. The past few weeks provide a glimmer of hope as global economies cautiously tiptoe towards reopening. That said, it is evident that we will need to get used to new and different dining experiences in the aftermath of the pandemic. For businesses to survive, they will have to adapt to a new normal and think of creative and innovative ways to thrive in the midst of adversity.
So how can restaurants maximize their chair use and dine-in sales while complying with guidelines? I pondered this question after a favorite childhood restaurant closed due to financial strain from the pandemic. It was a traditional dim sum restaurant, the location of our family’s weekend, brunch tradition as we feasted on shrimp dumplings, pork buns and custard tarts, and a significant part of my cultural upbringing. Little did I know (or expect) that I would bid farewell to a place filled with fond memories under such circumstances.
Turning to data analytics in an economic crisis
With this personal story top of mind, I saw an opportunity to demonstrate the industry expertise of my employer InterWorks, to lean into our deep Tableau partnership, and support restaurant and retail clients in maximizing their data experience, especially during a challenging time. InterWorks has deep knowledge in Tableau along with the entire analytics stack.
Together with my colleague Karl Riddett, an expert in retail and restaurant analytics, we created a visualization, powered by Tableau, for the InterWorks InterBurger portal. The InterBurger portal is a micro site of InterWorks’ larger collection of Portals for Tableau demo sites. InterBurger is a fictitious restaurant chain created to exhibit InterWorks’ vast expertise in the restaurant and retail industry, and to show how organizations can use Tableau to transform their business, drive performance, and discover unknown insights. Explore the entire portal here.
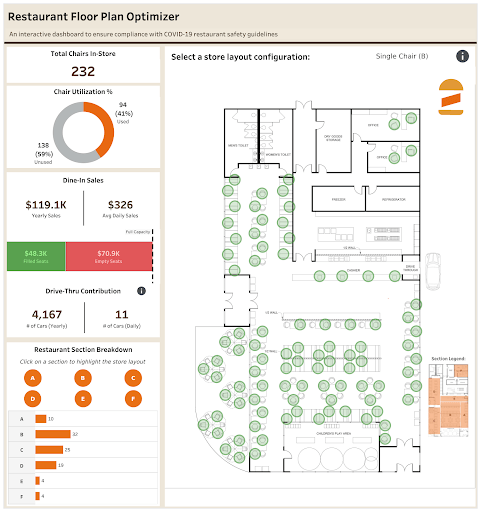
This interactive dashboard provides a reference point for restaurants to consider different seating layouts that will help maximize their capacity during these unprecedented times (Click on the "COVID-19 Seating Plan" tab to explore).

This “Restaurant Floor Plan Optimizer” dashboard by InterWorks helps restaurants monitor compliance with COVID-19 restaurant safety guidelines.
The goal of this dashboard is:
- To ensure that restaurants comply with their local, public health department’s social-distancing requirements
- To empower restaurants to maximize their seating capacity, which can lead to higher potential revenue by testing various seating configurations
How to use the Tableau “Restaurant Floor Plan Optimizer” dashboard
With the analytics provided by this dashboard, it’s clearer and easier for a restaurant to see how lost seats generate lost sales, and how turning to other channels such as mobile orders, delivery or take-out can compensate for diminished revenue. See below for a list of functionalities you can interact with:
Chair Configurations: There are five configuration options to choose from, which will dynamically update the utilization and sales revenue metrics on the left pane of the dashboard. Descriptions of the layouts are located below:
- Current State: This configuration assumes that all 232 chairs in the restaurant will be at 100% utilization. Although this scenario may be ideal from a revenue standpoint, this does not comply with the current social distancing guidelines of six feet. The red color of circles in the dashboard indicate non-compliance, as can be visually seen with the overlapping circles.
- Single Chair Configurations (options A and B): These two alternating configuration modes assume that individual chairs need to be apart by the social distancing threshold of six feet. If the areas of the circles don’t visually overlap, this means that the seating arrangement adheres to guidelines.
- Group Configurations (options A and B): These two alternating configuration modes assume that chairs can be co-located beside one another because a discrete cluster of seats belongs to a unique group (e.g., a group of friends, a family dining in). If the groups of circles don’t visually overlap, this would indicate compliance with guidelines.
The insight: Compensating for loss in dine-in revenue with drive-thru sales
Ultimately, because the compliant seating configurations won’t allow for all restaurant seats to be occupied, this can result in lower sales revenue. The left pane of the dashboard supports scenario planning efforts by visualizing the potential revenue lost due to empty seats caused by the seating configurations. It then calculates the number of additional drive-thru orders required to compensate for that lost revenue.
What next? Agility and analytics key for restaurant industry survival
To build your own visualization, use this floor plan optimizer template for reference or download a version on Tableau Public so you can replicate and tailor-fit it to your needs, now and in the future. Simply obtain a visual image of your restaurant’s seating plan and capture the x and y coordinates of your seats—a step that’s very easy using our InterWorks’ Drawing Tool for Tableau. Then, you can bring that image into the dashboard template.

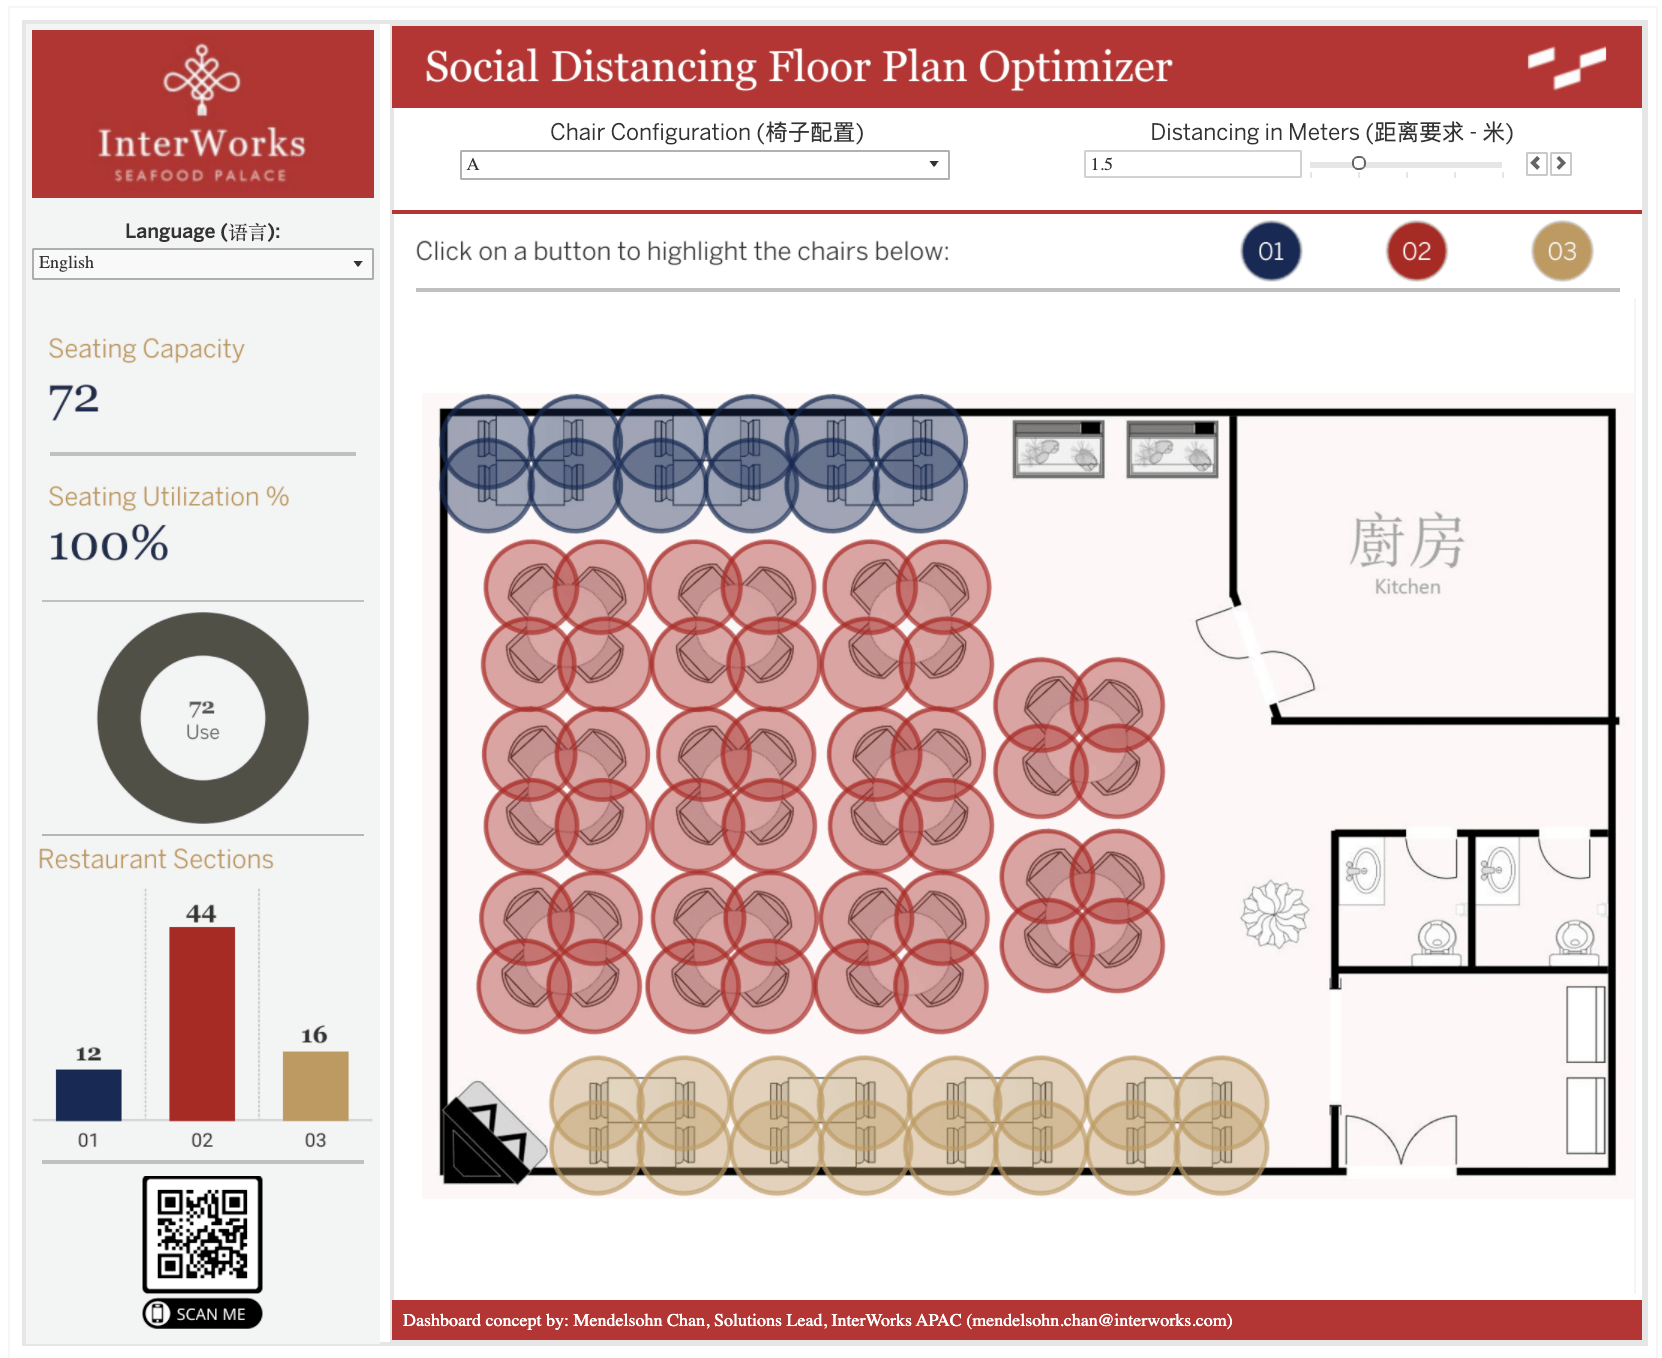
Another version of a social distancing dashboard from InterWorks, based on a fictional "Seafood Palace" restaurant.
Read more leadership stories and explore resources on how to empower your people in crisis.
Subscribe to our blog
在您的收件箱中获取最新的 Tableau 更新。


