My Summer Internship with Tableau: A Retrospective
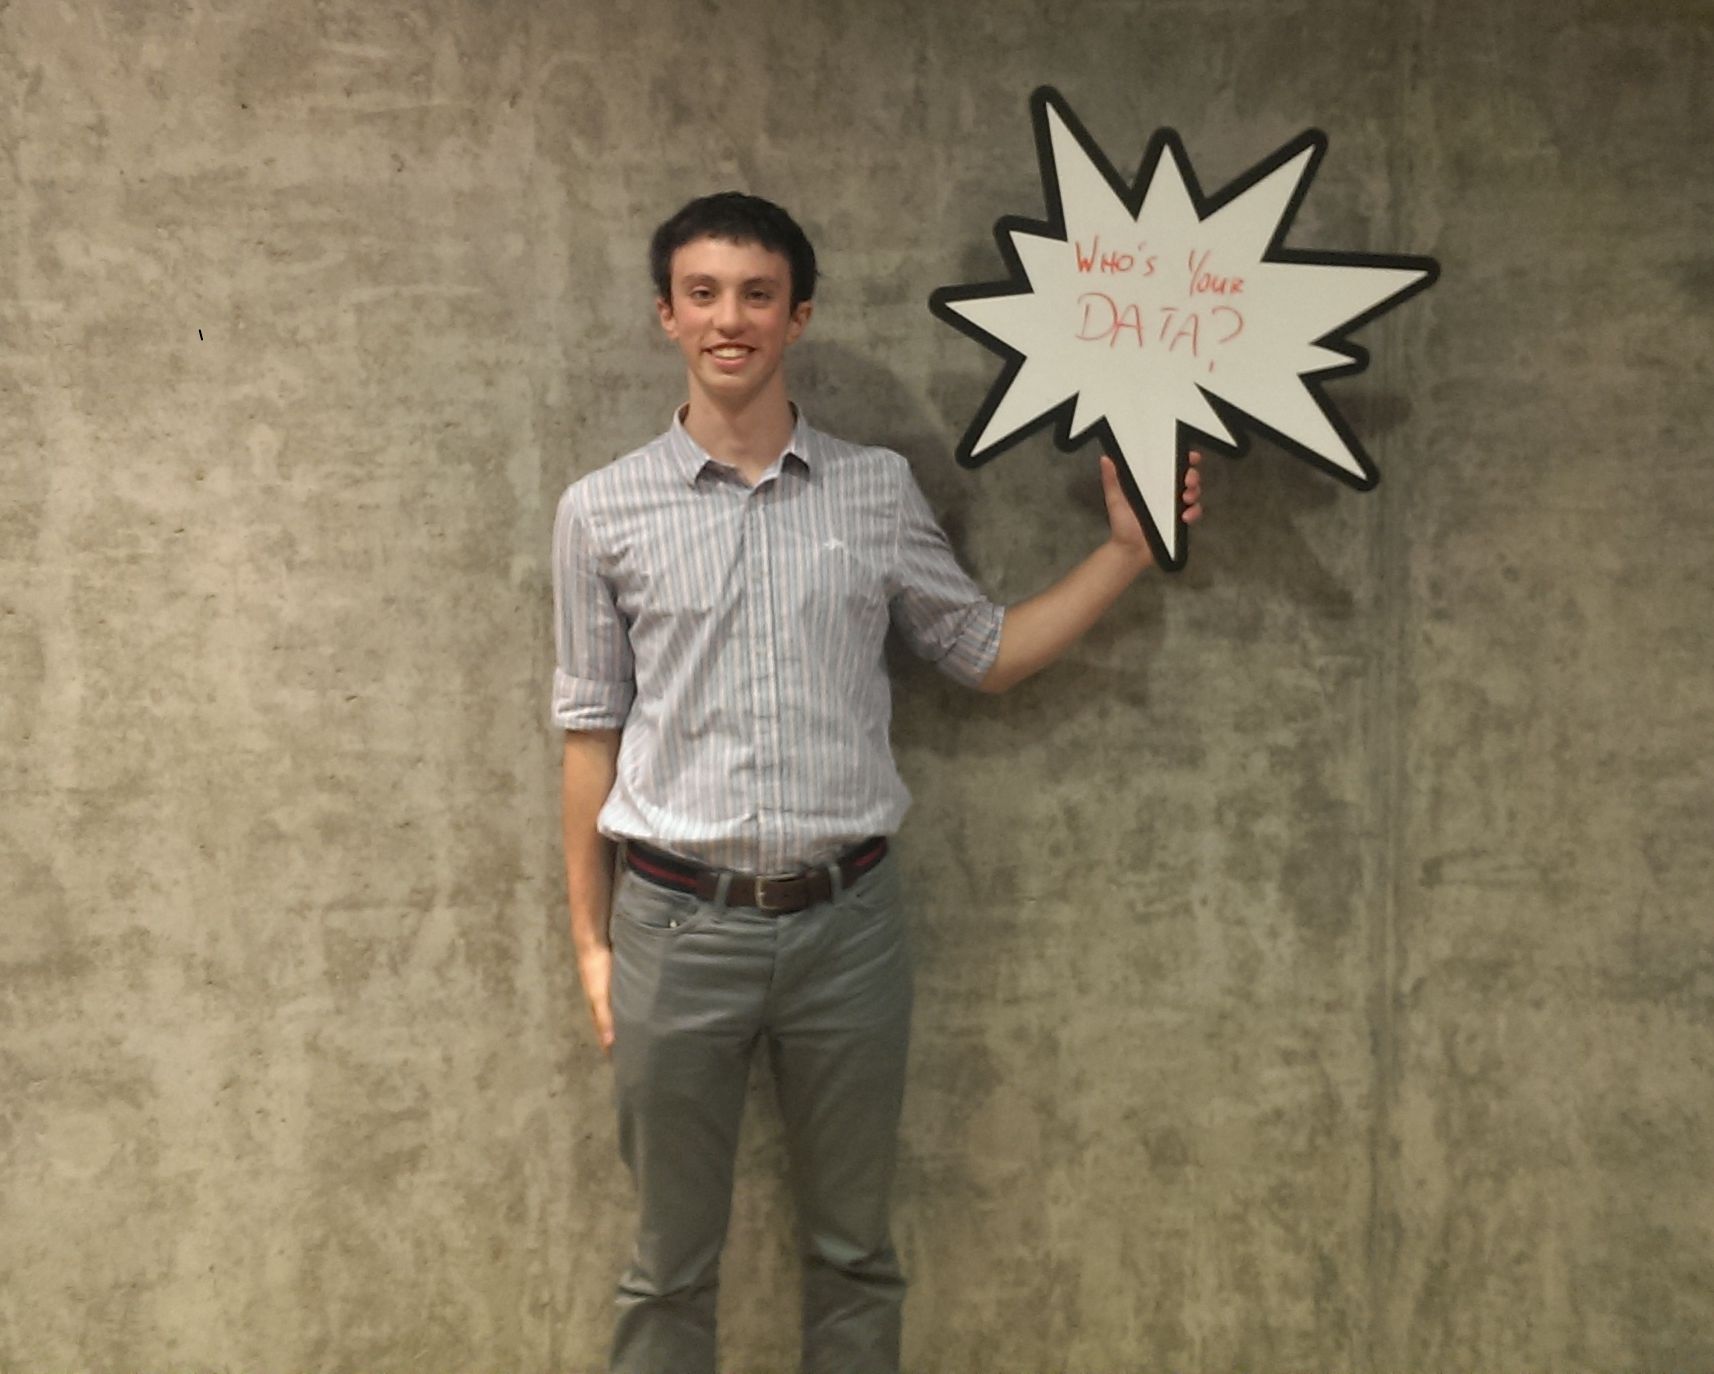
This past summer, we were fortunate to have Quinn Schiller, a local student at Raisbeck Aviation High School in Seattle, intern with us. He had originally approached us as one of the first students to take advantage of our Tableau for Students program, which provides any full-time student with a free Tableau Desktop license. He impressed us with his ability to pick up concepts for projects quickly, and in his time at Tableau, developed training videos on Tableau for his peers competing in the FIRST Robotics Competition (a competitive, robot-building sport) worldwide. For those of you who have wondered what it's like to spend a few months at Tableau, or some of the ways we're supporting K-12 education, read on!

Last year, as a sophomore at Raisbeck Aviation High School in Des Moines, WA, I inherited the job of data analyst on our school’s FIRST (For Inspiration and Recognition of Science and Technology) robotics team from a graduating senior.
My job was to design a data collection suite and then to analyze the data we collected (think of something along the lines of Moneyball — but somehow even nerdier). I started by designing the forms that our team would use to take notes on the other robotics teams’ actions during competitions.
My first attempt at analytics used pages of Visual Basic, 20 Excel sheets, and 5 pivot tables to turn a simple database into approximately six basic charts. The whole process was a nightmare of errors and redundancy. After sinking four weeks into that monstrosity, I remembered a software I had used the previous year — Tableau.
I had looked up “graphing software” on Google because I hoped that there might be a faster way to visualize the results of my first-quarter science project and that search led me to download a free trial of Tableau Software. Later that year, I used Tableau again as part of a geography project on outsourcing labor.
I realized that my job on the team could be easier, so I downloaded Tableau Public and messed around with it. In three hours, I was able to build the same six charts that I took me a month to produce with other tools.

I started getting really excited about how my team could use this software. I noticed that Tableau had just launched a program, Tableau for Students, which let any full-time student get a free copy of Tableau Desktop. As a thank you, I sent a link to my first few charts on Tableau Public to the Tableau for Students program administrator, Jason Schumacher. The next day, I had an email from Jason asking me if I wanted to come in and talk about how I was using the software.
During that conversation I realized that my team wasn’t the only one who did analytics at competitions. There were probably several other aspiring analysts, just like me, toiling over complicated and slow systems. With a few mentors from my robotics team, I started working towards getting Tableau in front of the FIRST organization, which organizes our robotics league. We got Jason in touch with a few high-ups. They seemed intrigued by the idea of other teams using the software, but they wanted to see how it was used.
That year was the most successful year our team has ever had. It was a complete anomaly: we won every regional in Washington, set an international record for number of blue banners won in a season (anything that qualified us for Worlds), and went undefeated in qualifications at the World Championship. While our team was in St. Louis for the world championship, I presented to some of the leaders of FIRST. Looking back, I realize that I was so excited, I forgot that I probably should have been nervous. I loosely remember offering to help make training materials to help the other teams learn how to use Tableau for this niche task. Two months later, I got a call from Jason saying that I might have an internship here at Tableau to do just that.
As of this blog post, I am the youngest intern that Tableau has ever taken on. I spent my summer in the marketing department developing tutorial videos for other robotics students across the world. While many of my friends had summer internships at other amazing companies, I felt unique. My friends were given jobs to do, and at the end of the day, someone else would have finished it for them if they didn’t complete it. At Tableau, I had the opportunity to pick my project, pick the scope, and see it through to the end. The idea that I was the only person who could finish what I started, motivated me better than any boss ever could.
Jason, and everyone else I worked with treated me like a peer, even though I am at least 10 years younger than the youngest of them.
Through my tutorials I learned more than I ever thought I could about scripting, recording, editing and producing. After the fourth hour of editing, I even got used to the sound of my recorded voice — something that had always freaked me out before.
However, the most important things I learned are possible only through experience.
This was by far the largest project I have ever done. My entire eight weeks were spent working solely on these tutorials. I learned perseverance and focus. My revisions with Jason exposed me to the product terminology and I learned how to write for an audience that may have different skills than I do. Through example, Tableau has shown me what a workplace should be like, and I hope to apply what I was taught to my department on our robotics team.
Subscribe to our blog
在您的收件箱中获取最新的 Tableau 更新。


