How the Tableau Community volunteered their data skills to help the Government of Thailand with COVID-19 data


This is a story about how the Bangkok Tableau User Group leaders came together to help their government organize and understand their data to better equip themselves against the COVID-19 situation in Thailand. We invited Nontawit Cheewaruangroj and Vorapol Santhadkolkarn to share how they helped the government visualize their data and continue to get valuable insights.
Nontawit: How the project between the Bangkok Tableau User Group and the Government of Thailand began
In 2021, like many parts of the world, Thailand was hit hard during the COVID-19 pandemic, especially in the Bangkok Metropolitan area. I saw many people in my community who tried to help—medical personnel worked tirelessly to treat patients, and volunteers provided patients with oxygen tanks and medicine to those who were isolated at home. Government officers were also working to come up with policies and solutions that would improve the situation.
As a data scientist for the government, I have encountered many challenges working with data in my industry. One of the common problems I've seen is the gap between operational officers and IT officers. Operational officers want to use data to make decisions but lack the tools and methods to efficiently analyze them. IT officers, on the other hand, do not know the best way to visualize the data to make it easy for operational officers to see and understand them. This gap became more apparent as Thailand grappled with the COVID-19 pandemic.
When Tableau Account Executive Yee Arpaporn and Lead Solution Engineer Thitirat Pipatkulsawat reached out about a potential opportunity to help the Thai government, the Bangkok Tableau User Group was eager to get involved. Along with the other Tableau User Group Leaders, we volunteered our expertise to help the Ministry of Public Health (MOPH) better understand Thailand’s COVID-19 data. We joined forces with the Health Intervention and Technology Assessment Program (HITAP), the Department of Disease Control (DDC), the Department of Medical Services (DMS), and the MOPH ICT Department.
For this project, each User Group leader focused on their specific strengths to help the government better understand their data. With his wealth of experience as a partner of Tableau, Vorapol applied his data management expertise to combine multiple data sources using APIs, Python, Tableau Prep, and more. The rest of the team, including myself, Methee Srisupundit, and Siroros Roongdonsai came together to apply our visual analytics skills to help the government better understand how COVID was impacting the population and the hospital system.

Our volunteer team from Tableau User Group Bangkok: Vorapol Santhadkolkarn, Methee Srisupundit, Siroros Roongdonsai, and Nontawit Cheewaruangroj (left to right).
Vorapol: Bringing together all the data
From gathering the various teams’ requirements, one of the key challenges the team faced was bringing all the data together for easy analysis. The IT department of several government teams were collecting and processing data every day in order to provide a summary for the Emergency Operation Center (EOC). These teams were working almost 24 hours a day to make the data available, and I helped improve the team’s data processing efficiency to ensure that this stage of the data work was less of a burden for the rest of the teams involved.
One of the misunderstandings about data integration is when people feel the need to create a new format or new template when creating a dashboard. This method not only increases the workload on data owners but also creates major project delays.
By leveraging APIs, I was able to automate data retrieval and data cleaning from file-sharing platforms such as Google Drive and collaborative spreadsheets like Google Sheets. I was also able to let the users share data comfortably and used Tableau Prep, Python, pandas programming, and Tableau Hyper API to support data processing. This allowed the team to bring together COVID Case Data, Death Statistics, and Immunization Data with RT-PCR lab results to provide a comprehensive view of the current state of COVID-19.


Nontawit: The Tableau dashboards created for the Government of Thailand
The Thai Tableau Community created several dashboards to help understand Thailand’s COVID-19 data:
- COVID-19 Severity Dashboard: Using patient and bed data, I created this dashboard and found within Thailand’s population, COVID-19 affected the elderly at a higher rate than younger people
- Bed Occupancy Dashboard: An automated dashboard showing bed occupancies by province, which the Department of Medical Services used for daily reporting.
- Vaccination and High Blood Pressure: Vorapol created a dashboard analyzing the number of people across different demographics getting the vaccine with high blood pressure.
- Vaccination Statistics overview: Siroros created a dashboard summarizing vaccination statistics which helped the public officers better understand the data.
- COVID-19 Death Rate: Ko Nattapong created a dashboard tracking the COVID-19 death rate in Thailand.
Public Dashboard by DDC showing daily cases data (link)
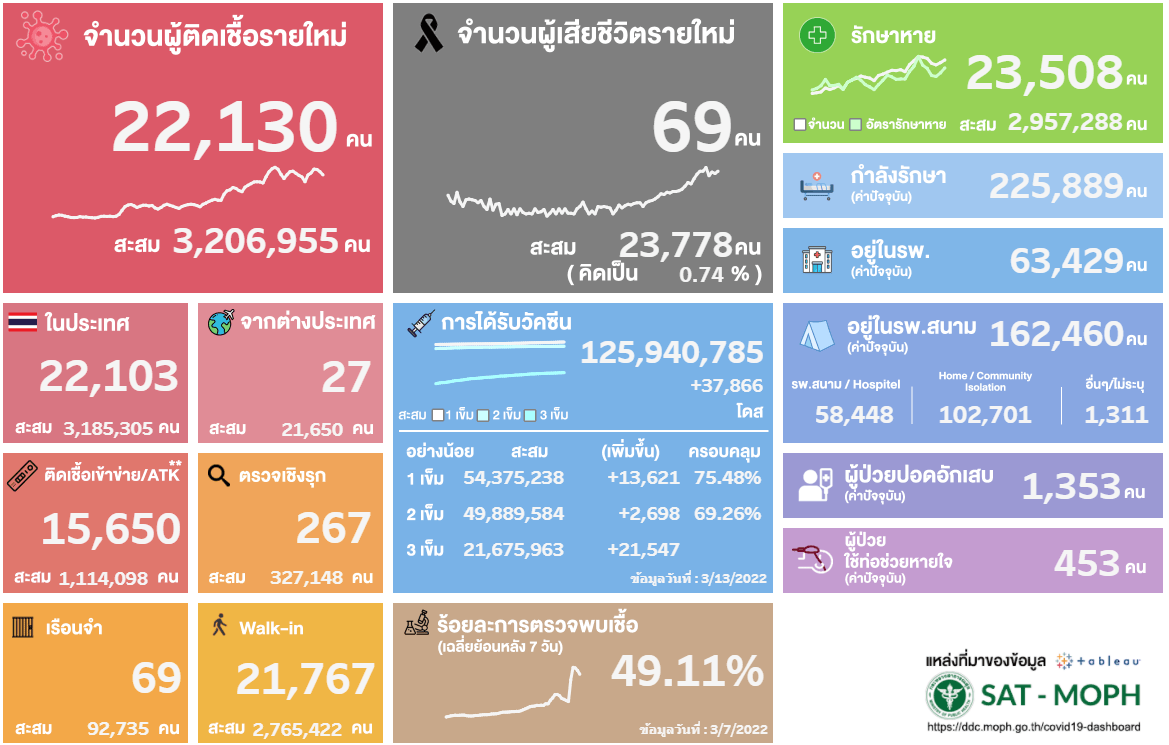
One of the publicly available dashboards that was created for DDC. This dashboard was featured in the Thai news and social media.
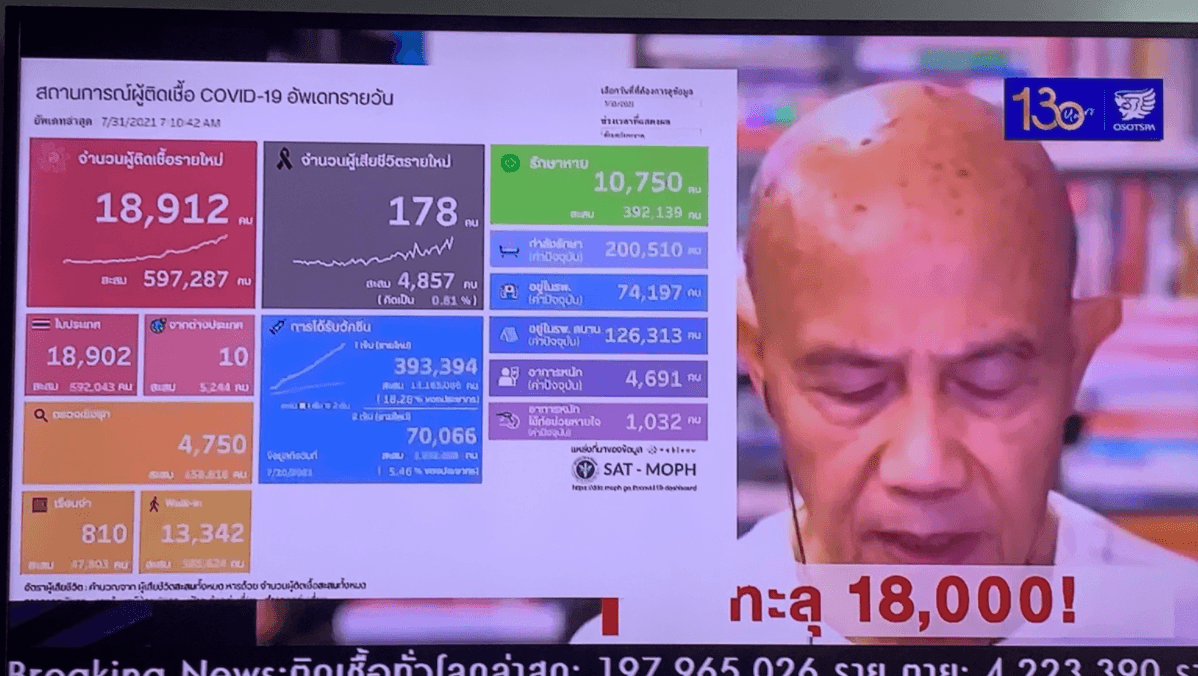
Reported by Sutthichai Yoon, on Sutthichai Live Channel.
COVID-19 Severity Dashboard and COVID-19 Bed Vacancies Dashboard by Nontawit

Dashboard showing blood pressure data of the immunized group by Vorapol

Dashboard summarizing the vaccination data by Siroros

Covid Fatalities Dashboard by Nuttapong

Nontawit: Beyond the dashboards
The Thai Tableau Community’s journey didn’t end there. We wanted the operational officers to be able to build on the work that we’ve been able to do with them. The team was invited to speak about data integration and preparation to the public officers. In addition, our Tableau User Group also guided officers through the basics of Tableau for their own use in their day-to-day work.
Subscribe to our blog
在您的收件箱中获取最新的 Tableau 更新。