Exploring Spatial Computing and Immersive Analytics with Vision Pro


The introduction of the Apple Vision Pro provides new opportunities for supporting immersive analytic experiences as users can interact with and explore data beyond the traditional mouse and keyboard. This blog describes the development of an app Tableau built that puts data visualizations in a spatial environment and lets you see and understand data in an entirely new way.
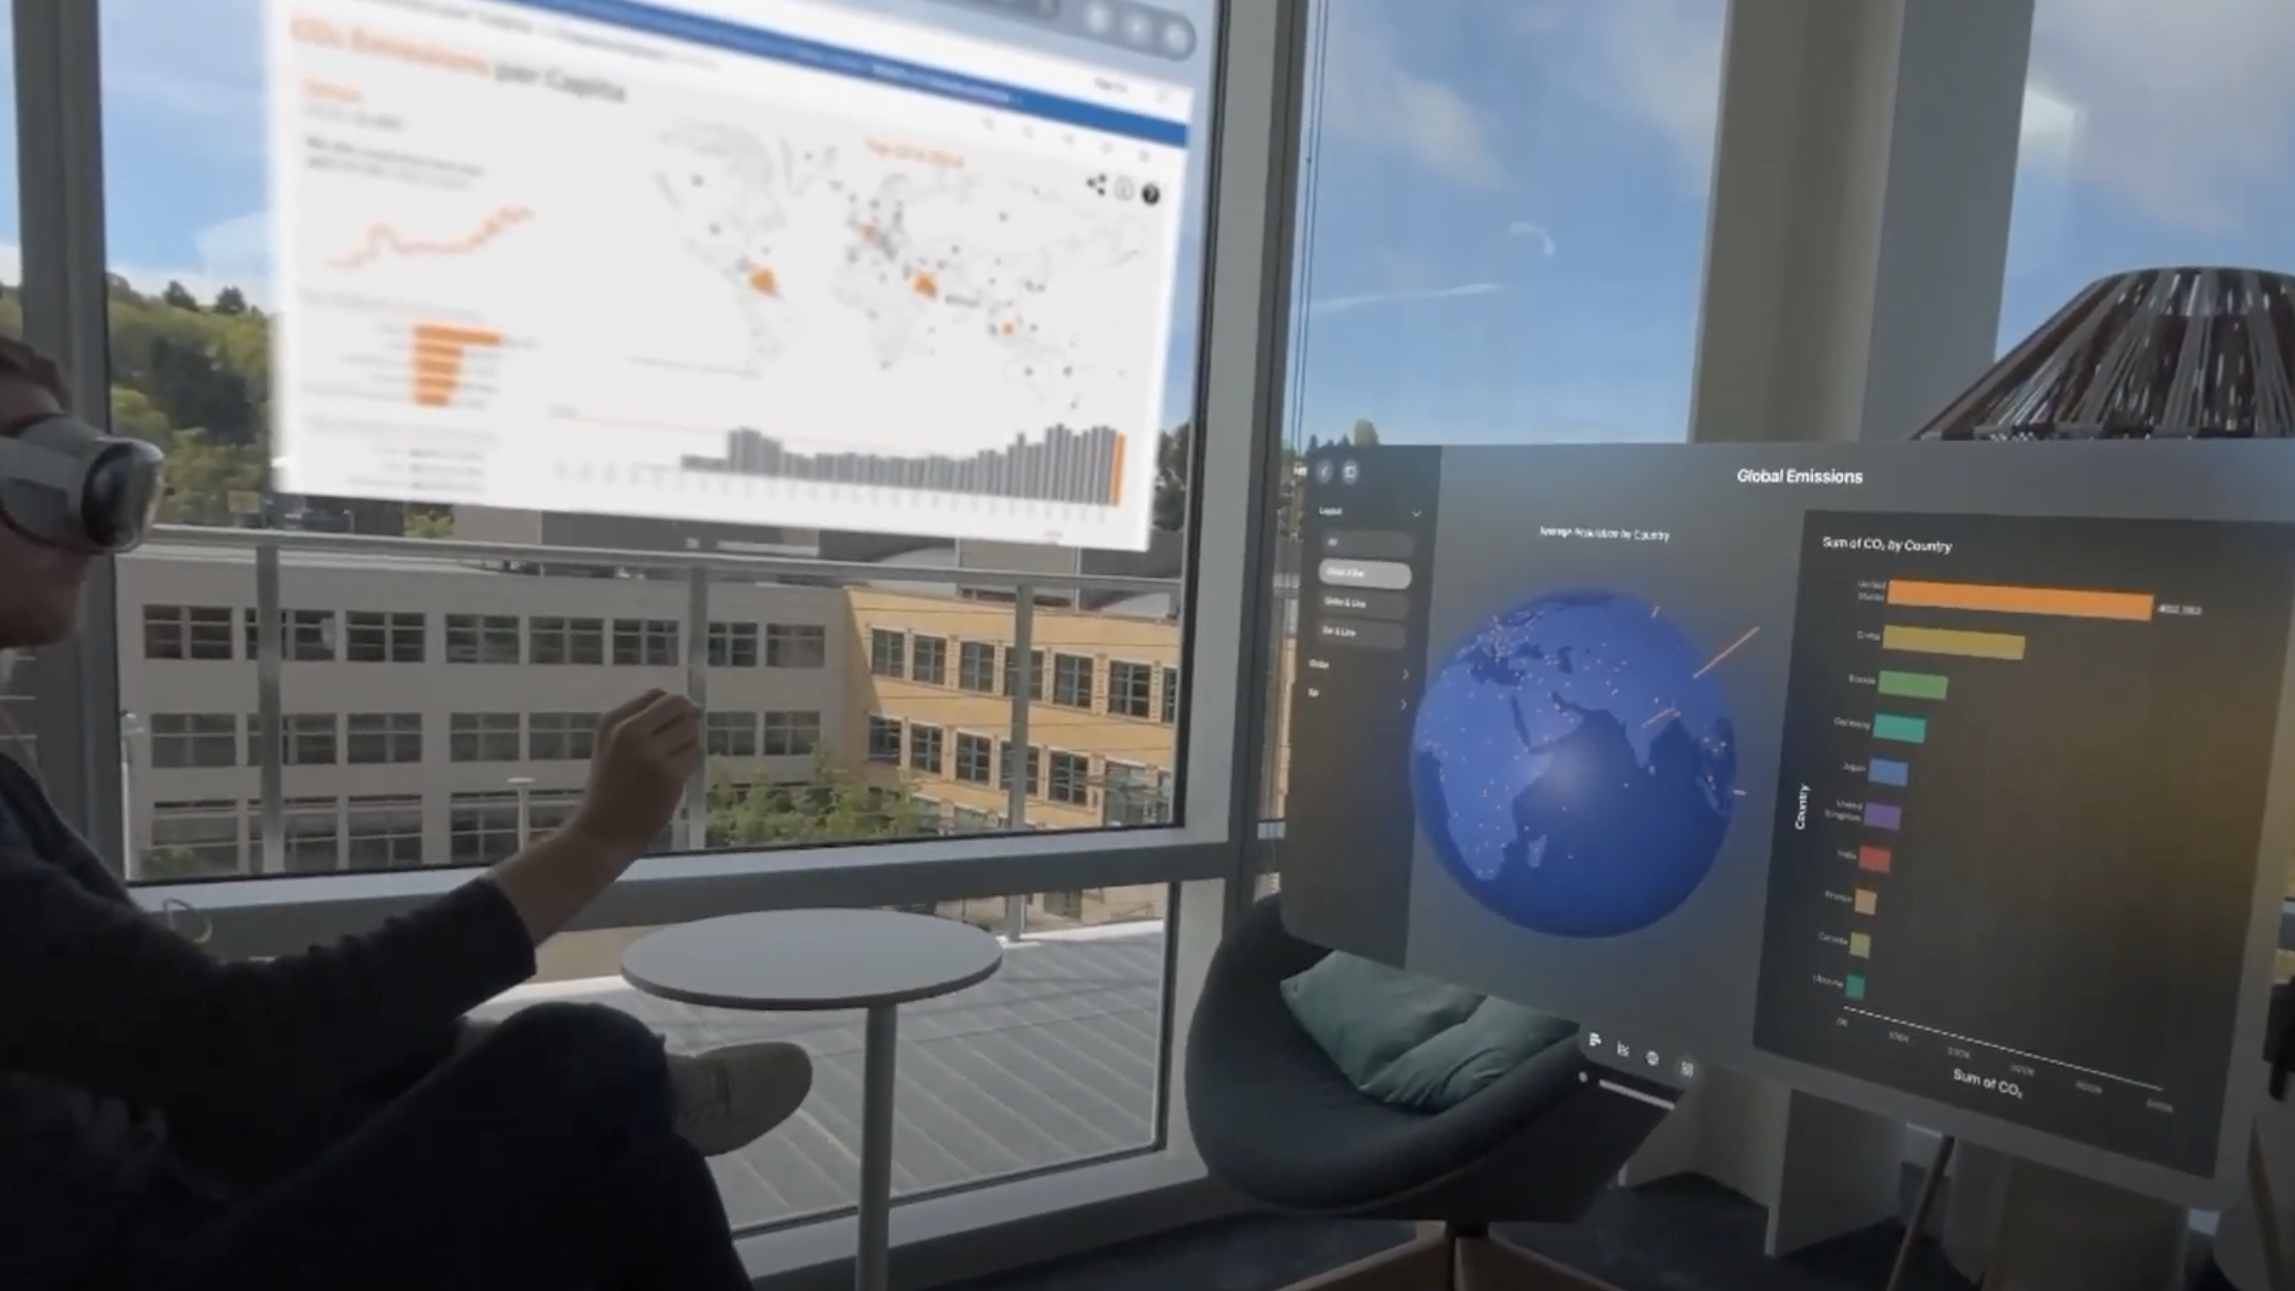
A person wearing Apple Vision Pro interacts with the Tableau immersive analytics app. In this instance, a 3D globe and a bar chart display global CO2 emissions data, while a related dashboard appears in a separate web browser window.
Why Immersive Analytics?
Traditional approaches to visual analytics in enterprise business intelligence (BI) primarily rely on 2D charts and dashboards to support common analytical tasks, such as answering where, when, how much, and why questions. These tools are typically used to analyze tabular data consisting of quantitative, temporal, categorical, or geographic fields. They are constrained to traditional desktop displays with mouse and keyboard input.
Immersive analytics is an emerging field that has gained significant attention in recent years. It combines traditional data visualization techniques with immersive technologies such as virtual reality (VR), augmented reality (AR), and mixed reality (MR), introducing 3-D charts and gestural interactions in order to explore additional aspects of a user’s data. Research has highlighted the potential of immersive analytics to provide new ways of interacting with data, emphasizing the advantages of spatial data representation over conventional 2D visualizations.
Tableau’s mission has always been to help people see and understand data. With the release of Apple Vision Pro, we aim to explore new data experiences that leverage the unique capabilities of spatial computing in support of that mission. The hand- and eye-tracking l available in Vision Pro offer promising opportunities for interaction and reducing cognitive load relative to traditional input devices. Empirical research supports the benefits of these input methods, showing they can enhance user experience and effectiveness in data interaction. In addition, visualizations viewed in 3D allow people to see things that are not possible on a 2D canvas. For example, visualization data on a globe addresses issues with map projections that limit the accuracy of interpretation of traditional 2D maps. We believe additional research will lead to other visualizations that broaden people’s ability to understand their data.
App Design and Development
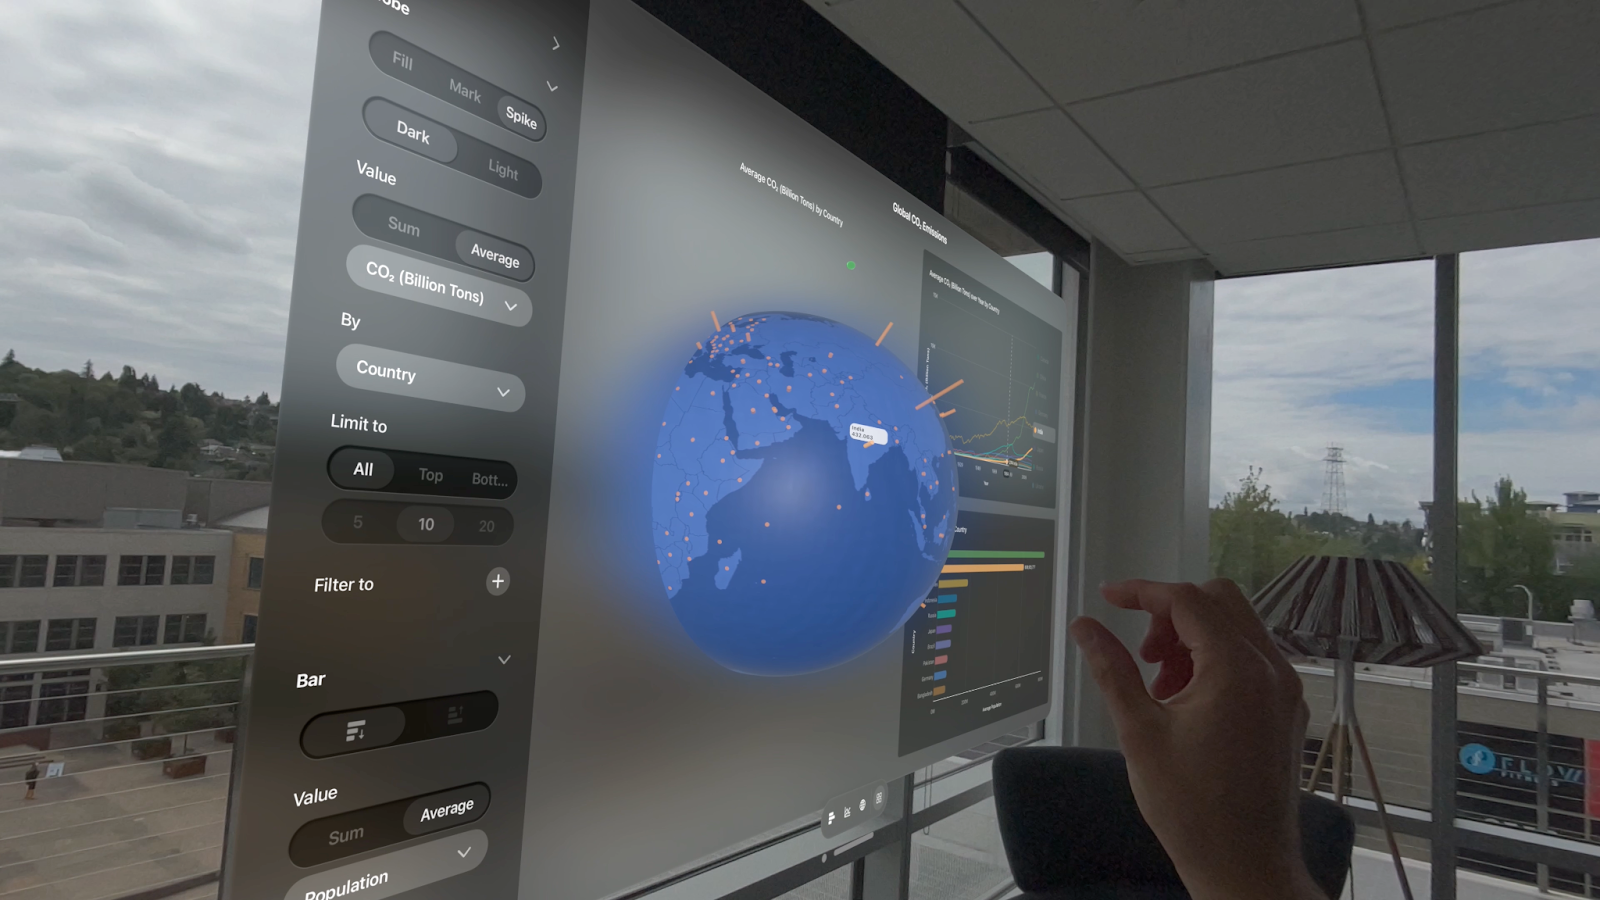
In this app’s instance, a globe shows CO2 emissions by country, revealing a tooltip in response to a gestural selection of India. Accompanying the globe is a line chart showing meat production trends over time for several countries, as well as a bar chart comparing the total emissions across those same countries. The left panel provides options for changing the dashboard layout as well as the attributes and filter settings of individual charts.
Based on Apple’s interface design guidelines recommended for visionOS, the app provides clear information, responsiveness, and ease of interaction regardless of various ambient settings. We also incorporate visual analytics best practices, such as displaying different visual representations for different combinations of data fields and allowing for interactive exploration by applying filters, changing aggregation levels, and switching between visualization types.
The Tableau team implemented the app using the visionOS SDK, which includes tools and frameworks, such as SwiftUI, RealityKit, and ARKit for developing 2D and 3D visual representations and supporting gesture recognition and gaze tracking. The app loads data into an SQLite database and maintains binding properties that link data with visual elements in interactive 2D bar and line charts, as well as 3D globe models.
The app also incorporates several unique elements to maintain the familiar Tableau experience while leveraging the capabilities of Vision Pro and addressing shortcomings in the traditional Tableau experience. Here are some salient characteristics:
- Addressing the blank page problem with sample datasets. Starting a new data analysis project can be daunting, especially when faced with a blank canvas. The app provides a user with three data sets as a starting point for their data exploration: CO2 and greenhouse gas emissions, marriages and divorces, meat and dairy production. Eventually, we would expect that the app would also support loading in new datasets.
- Supporting contextual data exploration. The app enables users to explore, filter, and refine data dynamically. It also supports detail-on-demand interaction, allowing users to access contextual information when selecting marks in the visualization. For instance, when a user selects a point on a globe, a tooltip appears, providing additional details about that point.
- Support for 3D visualizations. A key feature of visionOS is its ability to support 3D models with high graphical fidelity, allowing users to interact with data in a spatial environment. We explore this capability by rendering geospatial data within three globe variants: point location, choropleth, and “spike” (data encoded on mark height), similar to how users in traditional Tableau can show different mark types.
- Leveraging interactive features and voice. The Tableau app leverages Vision Pro capabilities, such as eye- and hand-tracking. The app also supports voice-based commands to perform analytical operations, such as filtering data to a specific country in a dataset.
Reflections on User Feedback & Future Directions
During Tableau Conference 2024 in San Diego, we recruited 22 attendees to help us assess the usability, learnability, and potential utility of Tableau on the visionOS platform, along with broader perspectives on the potential for HMDs to create engaging experiences around data. Participants were tasked with a series of analytical exercises using one of three datasets. These tasks included specifying filter settings, changing data fields, and interpreting trends across various visualizations, such as bar charts, line charts, and a 3D globe. Examples of tasks included identifying the country with the highest CO2 emissions in Asia and determining when poultry production first exceeded beef production in South America.
The sessions revealed a split between Tableau experts and novices; while experts quickly adapted to the app’s workflow and discovered features with ease, novices found the visual appeal intriguing but struggled with translating the app controls to their own familiar mental models, hence requiring additional guidance. This finding underscores the need to determine where to place different fields in reference to Tableau’s pill-and-shelf paradigm that this app is closely modeled after. We believe it’s important to explore an interface that is more accessible to people who have little-to-no experience with exploratory data analysis.
Participants expressed several key takeaways from their experience using the app. The globes contributed to the wow factor of seeing and interacting with 3D visualizations with the device. There was a continued appreciation for traditional visualization types, such as bar and line charts, even within a 3D environment, with participants expressing a desire for novel interactions built on top of these familiar chart types. Users wanted more direct interaction with visualizations, such as drilling down or filtering directly on the charts, rather than relying on a separate control panel. Participants also showed a strong interest in leveraging Vision Pro’s infinite canvas concept to explore data more freely. However, there was recognition of some limitations of 3D views, such as data hidden from one’s field of view - creating an opportunity to explore new UX alternatives to improve usability. More research would need to explore viable use cases and partner with customers to build apps for their workflows. However, participants did express significant interest in cross-platform compatibility, emphasizing the need for continuity between desktop environments and HMDs. Additionally, there was a call for adaptive and inclusive design to accommodate diverse user needs, including those with visual impairments. The feedback also underscored the potential for collaborative features, allowing remote teams to interact with data in shared virtual spaces.
To wrap up, the design of a Tableau app on the Apple Vision Pro is an important step towards exploring the potential of immersive analytics. By transforming data interaction through 3D visualizations and intuitive controls, the platform opens new possibilities for data exploration, storytelling, and new analytical experiences. As we continue to innovate and refine these experiences, we would love to hear from you. Do you have specific use cases and BI workflows in mind where you think this could be interesting and useful? For more information and to download the beta version of the app, check out the Tableau Test Flight page.
相关故事

AI-Assisted Authoring of Text and Charts for Data-Driven Communication
 2025/04/04

Beyond the Default: Customizing Automated Data Insights with GROOT
 2024/10/24

Beyond the Visuals: Elevating Text as a First-Class Citizen in Dashboard Design
 2024/10/16
Subscribe to our blog
在您的收件箱中获取最新的 Tableau 更新。