DataFam Roundup: September 1–8, 2023
Welcome! Dig into this week's DataFam Roundup—a weekly blog that brings together community content all in one post. As always, we invite you to send us your content—and the DataFam content from your peers that have inspired you! Find the content submission form here.
Community Highlight
To recognize new and consistent Tableau contributors—we’re excited to have a section within the weekly DataFam Roundup called the Tableau Community Highlight. Find out how to get involved.
Sam Pollard, Data Visualization Manager at Sky
England, United Kingdom
Sam Pollard is a Data Visualization Manager at Sky who shares his knowledge through his YouTube channel and by participating in community projects such as Workout Wednesday and Makeover Monday. After being introduced to Tableau through work, Sam began to play around with the tool and eventually leapt at the opportunity to switch roles when given the chance to start developing training courses.
When learning Tableau, Sam found that trial and error was the best teacher. Learning this way, inspired him to start his own YouTube channel where he focuses on topics that he felt were especially challenging to learn. Sam aims to keep his videos short and cover techniques for the entry-level audience and people who are beginning their Tableau journey. In the future, Sam hopes to begin live run-throughs of Workout Wednesday challenges to show his viewers how to approach getting stuck and make them feel more comfortable making mistakes while trying to learn Tableau.
Connect with Sam on Linkedin, Tableau Public, and his YouTube channel.
DataFam content
Dive into content created by the Tableau Community:

-
CJ Mayes:
-
Fabricio Lennart Flores Ledezma, LinkedIn:
-
Andrés A. Quiroz Sanchez, LinkedIn: Clase 9 Jerarquia y acción de conjunto
-
Steve Wood: Top M within each top N of categories
-
Four Africa: Mini Tableau Hacks — 4Africa Data Specialists
-
Prasann Prem: Is Data Visualisation a necessary skill for Data Analysts?
-
Ansula Jain: How to Swap Pie charts in Tableau | Parameter Switching
-
Ken Flerlage, The Flerlage Twins: Pass Tableau Filters via URL using FILTERVALUES
Upcoming events and community participation
-
Chart Chat Live--Round 44: September 21 - Watch as Jeffrey Shaffer, Steve Wexler, Andy Cotgreave, and Amanda Makulec debate the good, bad, and "scaredy-cats" of data visualization.
-
Demystifying the way to learn Data Visualization! Are you looking for a way to learn Data Visualization and feeling lost? We all have been there and I am going to help you understand the fundamentals and look for a way to learn data visualization.
-
Career Pathmakers: This is the launch event for the Career PathMakers user group. This group will be focused on helping its members navigate challenges in their careers, both with a mentorship program and a transition support program.
-
Viz Collab is back: Hello everyone! I’m excited to be opening #VizCollab back up for another round of matches! In the last year I matched around 40 people for some amazing vizzes, including Viz of the Days and a viz that was featured in a local publication. So if you want to find a collaboration partner sign up.
-
Local Community Conferences by the DataFam, for the DataFam.
-
Data Book Club: This summer, the Data Book Club is reading Living in Data: A Citizen's Guide to a Better Information Future by Jer Thorp.
-
Community Calendar and Upcoming Events: stay up-to-date on the latest Women in Dataviz events and other data visualization-related events. If you'd like to submit an event to the calendar, please fill out this form.
Vizzes
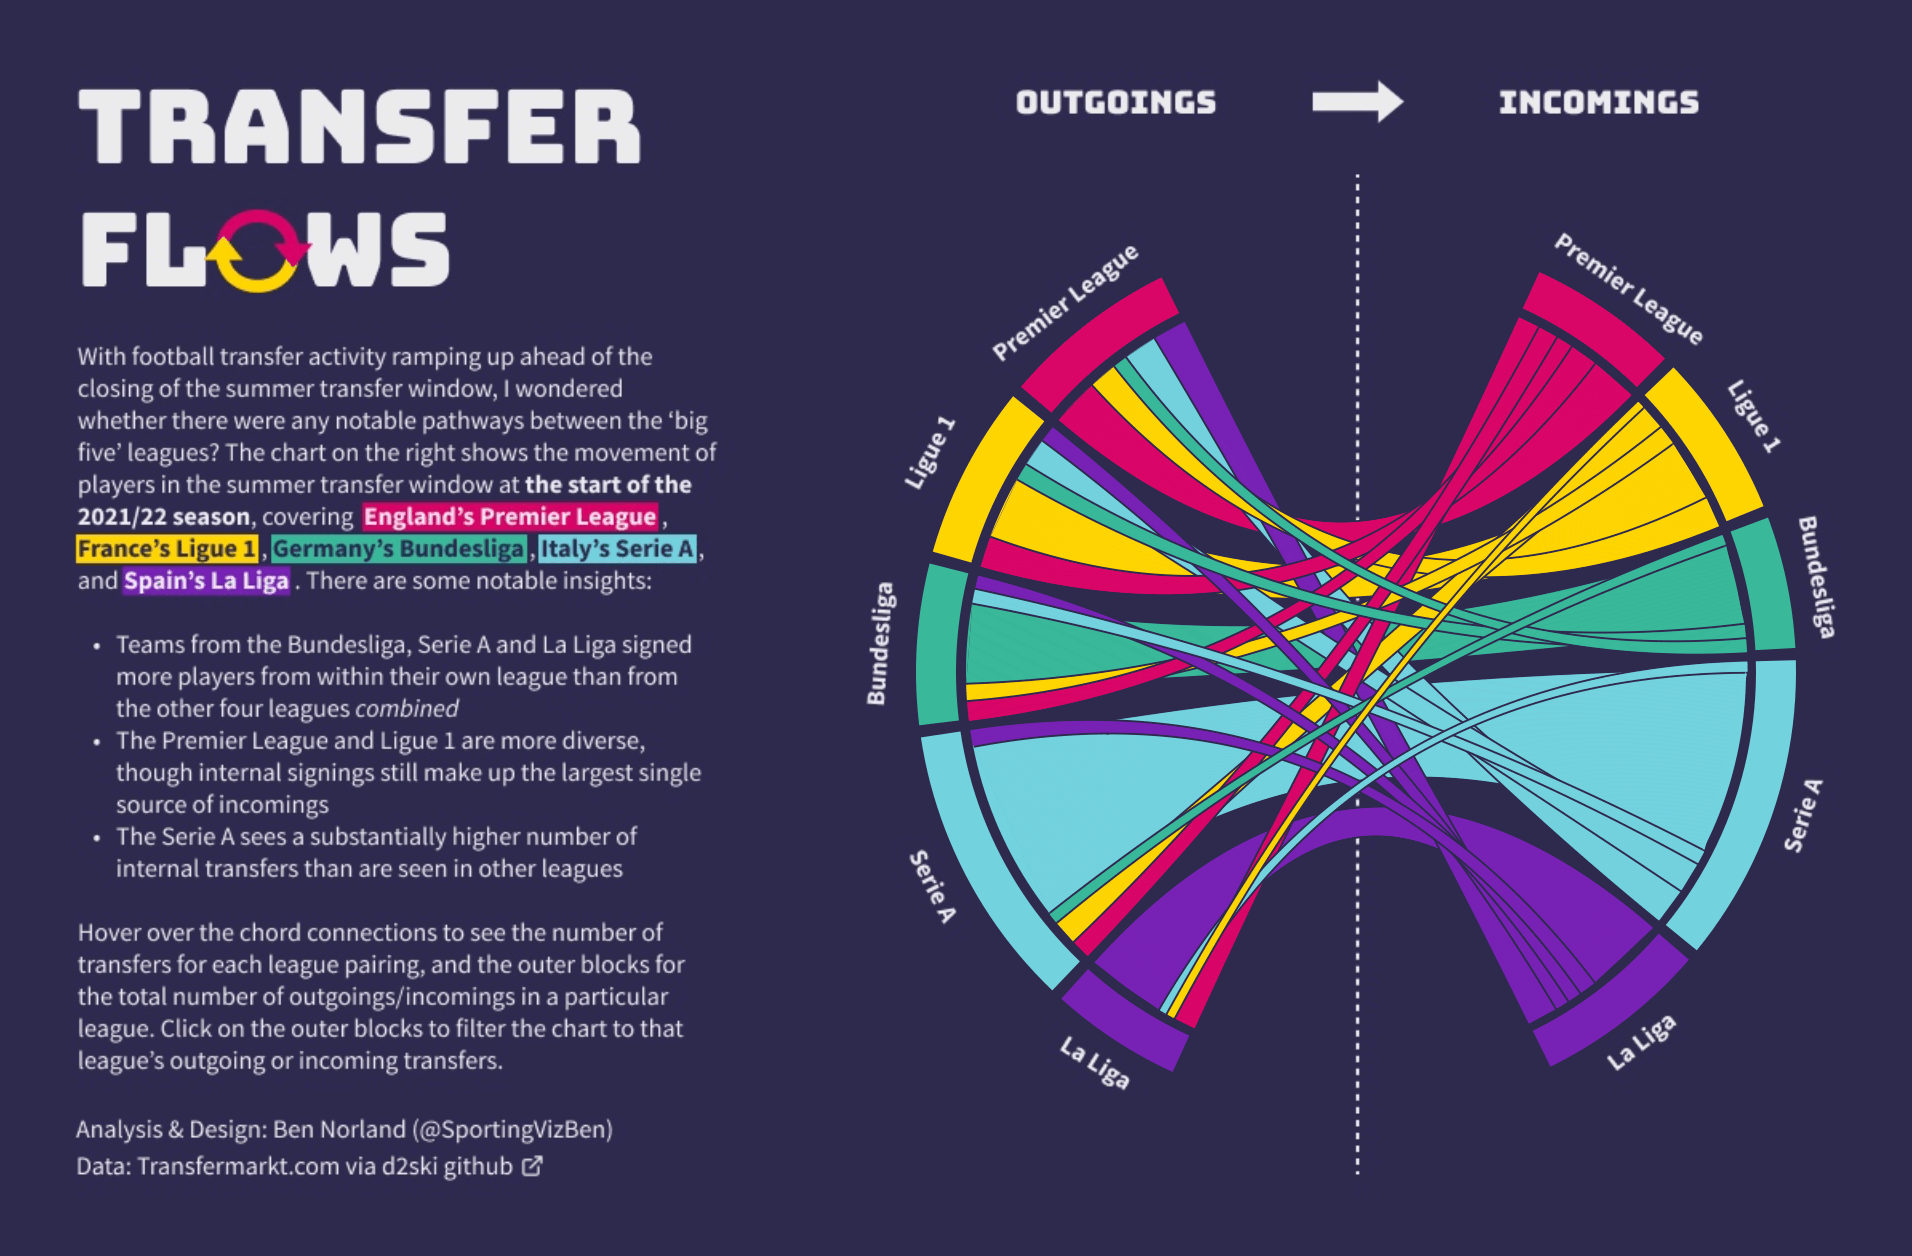
Ben Norland: Football Transfer Flows
See the latest Viz of the Day, trending vizzes, featured authors, and more on Tableau Public.
Check out some inspirational vizzes created by the community:
-
Ben Norland: Football Transfer Flows
-
Thomas Alexander Smith: Global Media Freedom #MakeoverMonday 2023 W20
-
Prasann Prem: Layoffs in Forbes Cloud 100
-
Will Sutton: Tableau's Information is Beautiful (IIB) Awards
-
Gbolahan Adebayo: Drinking Fountains in Milan
Community Projects
Back 2 Viz Basics
A bi-weekly project helping those who are newer in the community and just starting out with Tableau. Not limited just to newbies!
Web: Back 2 Viz Basics
Twitter: #B2VB
Week 17: Design a Wireframe
Workout Wednesday
Build your skills with a weekly challenge to re-create an interactive data visualization.
Web: Workout Wednesday
Twitter: #WOW2022
Week 36: Can you build a dashboard for pre-aggregated metrics?
Makeover Monday
A weekly social data project.
Web: Makeover Monday
Twitter: #MakeoverMonday
Week 36: Employees at Forbes Cloud 100
Preppin' Data
A weekly challenge to help you learn to prepare data and use Tableau Prep.
Web: Preppin’ Data
Twitter: #PreppinData
Week 36: C&BSCo 5-a-side
DataFam Con
A monthly challenge covering pop culture and fandoms.
Web: DataFam Con
Twitter: #DataFamCon
September 2023: Barbie World!
EduVizzers
A monthly project connecting real education data with real people.
Web: Eduvizzers
September 2023: School Book Bans in the United States
Games Night Viz
A monthly project focusing on using data from your favorite games.
Web: Games Nights Viz
Twitter: #GamesNightViz
Season 2: Battle of the Strongest
Iron Quest
Practice data sourcing, preparation, and visualization skills in a themed monthly challenge.
Web: Iron Quest
Twitter: #IronQuest
White Space
Storytelling with Data
Practice data visualization and storytelling skills by participating in monthly challenges and exercises.
Web: Storytelling with Data
Twitter: #SWDChallenge
August 2023: what does your audience know?
Project Health Viz
Uncover new stories by visualizing healthcare data sets provided each month.
Web: Project Health Viz
Twitter: #ProjectHealthViz
June 2023: Funding for Research for Various Conditions and Diseases
Diversity in Data
An initiative centered around diversity, equity & awareness by visualizing provided datasets each month.
Web: Diversity in Data
Twitter: #DiversityinData
May 2023: Mental Health Awareness Month and LGBTQ+ Representation in film
Sports Viz Sunday
Create and share data visualizations using rich, sports-themed data sets in a monthly challenge.
Web: Sports Viz Sunday
Twitter: #SportsVizSunday
January 2023: Is it a Sport or a Game?
Viz for Social Good
Volunteer to design data visualizations that help nonprofits harness the power of data for social change.
Web: Viz for Social Good
Twitter: #VizforSocialGood
June 9 - July 18, 2023: Gord Downie & Chanie Wenjack Fund
Real World Fake Data
Create business dashboards using provided data sets for various industries and departments.
Web: Real World Fake Data
Twitter: #RWFD
Session 5: Diversity Score Card
Data Plus Music
A monthly project visualizing the data behind the music we love!
Web: Data Plus Music
Twitter: #DataPlusMusic
相关故事
Subscribe to our blog
在您的收件箱中获取最新的 Tableau 更新。


