DataFam Roundup: February 27 - March 3, 2023
Welcome! Dig into this week's DataFam Roundup—a weekly blog that brings together community content all in one post. As always, we invite you to send us your content—and the DataFam content from your peers that have inspired you! Find the content submission form here.
DataFam content
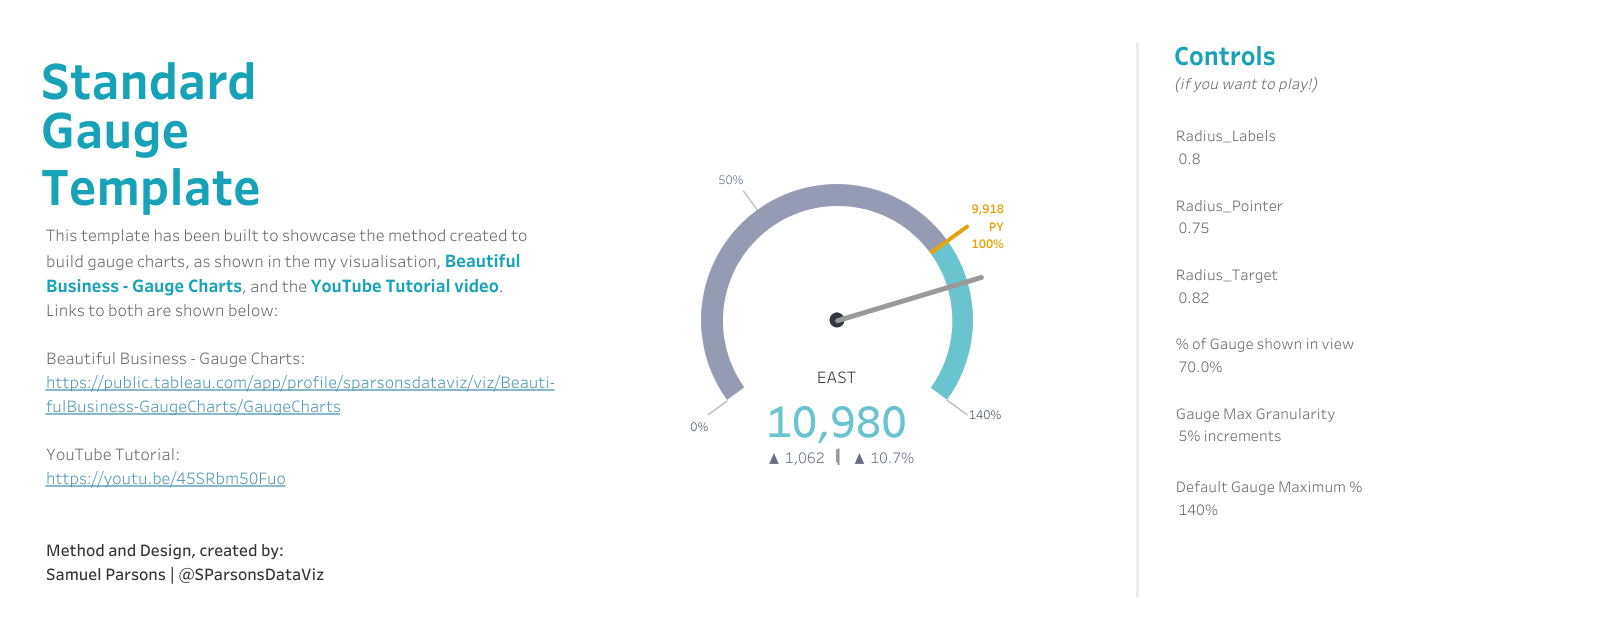
Samuel Parsons: Totally Awesome Tableau Gauge Charts - Tutorial
Dive into content created by the Tableau Community:
- Oliver Linley, OneNumber: How to Build Donut Charts in Tableau
- Mark Tossell: Salesforce Reports, CRM Analytics and Tableau
-
Hamouchi Imad: #15 Tableau Tips - How to change Measure Values using Measure Names and Actions
-
Samuel Parsons: Totally Awesome Tableau Gauge Charts - Tutorial
-
Tadeo Donegana Braunschweig: Dynamically changing the date level using a parameter in Tableau
-
Yeo Jun Yan, Hide The Table: How to Create a Dendrogram in Tableau - My Way
-
Paul Chapman, The Data Leadership Collaborative: Building Data Leaders: Pitfalls and Possibilities
-
Dinushki De Livera and Jennifer Dawes, Her Data Talks: Brittany Rosenau
-
Mark Palmer, The Data Leadership Collaborative: 5 Tips to Make a Data Literacy Program Stick in Your Organization
-
Katie Kilroy, Data Katie: Why You Should Start Using Tableau Public
-
Kimly Scott, she will viz: TC & Vizzing Space with Irene Diomi
-
Dawn Harrington, Tech Tips Girl: The Many Ways to Highlight in Tableau
-
Jeff Plattner: Dynamic Zone Visibility Mobile Concept
-
Sharif Shaalan, Agile Cloud Consulting: Nuff Respect Data Heroes # 2 – Dzifa Amexo
-
Annabelle Rincon, Rativiz: Data plus women: how to get started?
Team Tableau
Upcoming events and community participation
-
Data Super Star: The theme of this competition is insightfulness, navigability, and user-friendliness. We are looking for BUSINESS DASHBOARD that effectively communicate key insights and patterns in the data, allow for easy exploration, and provide a positive user experience.
-
Dataviz Conferences to not miss in 2023 Are you ready to join the global dataviz community? Fortunately, there are a number of amazing conferences held throughout this year that can help you network with your peers, uncover new learnings, give you memories, and lot of fun. Let’s check them.
-
Data Superstar: Get ready for a data visualization extravaganza! Our competition is all about showcasing the best and brightest in data visualization. The theme of this competition is insightfulness, navigability, and user-friendliness. We are looking for visualizations that effectively communicate key insights and patterns in the data, allow for easy exploration, and provide a positive user experience.
-
Community Calendar and Upcoming Events: stay up-to-date on the latest Women in Dataviz events and other data visualization-related events. If you'd like to submit an event to the calendar, please fill out this form.
Vizzes
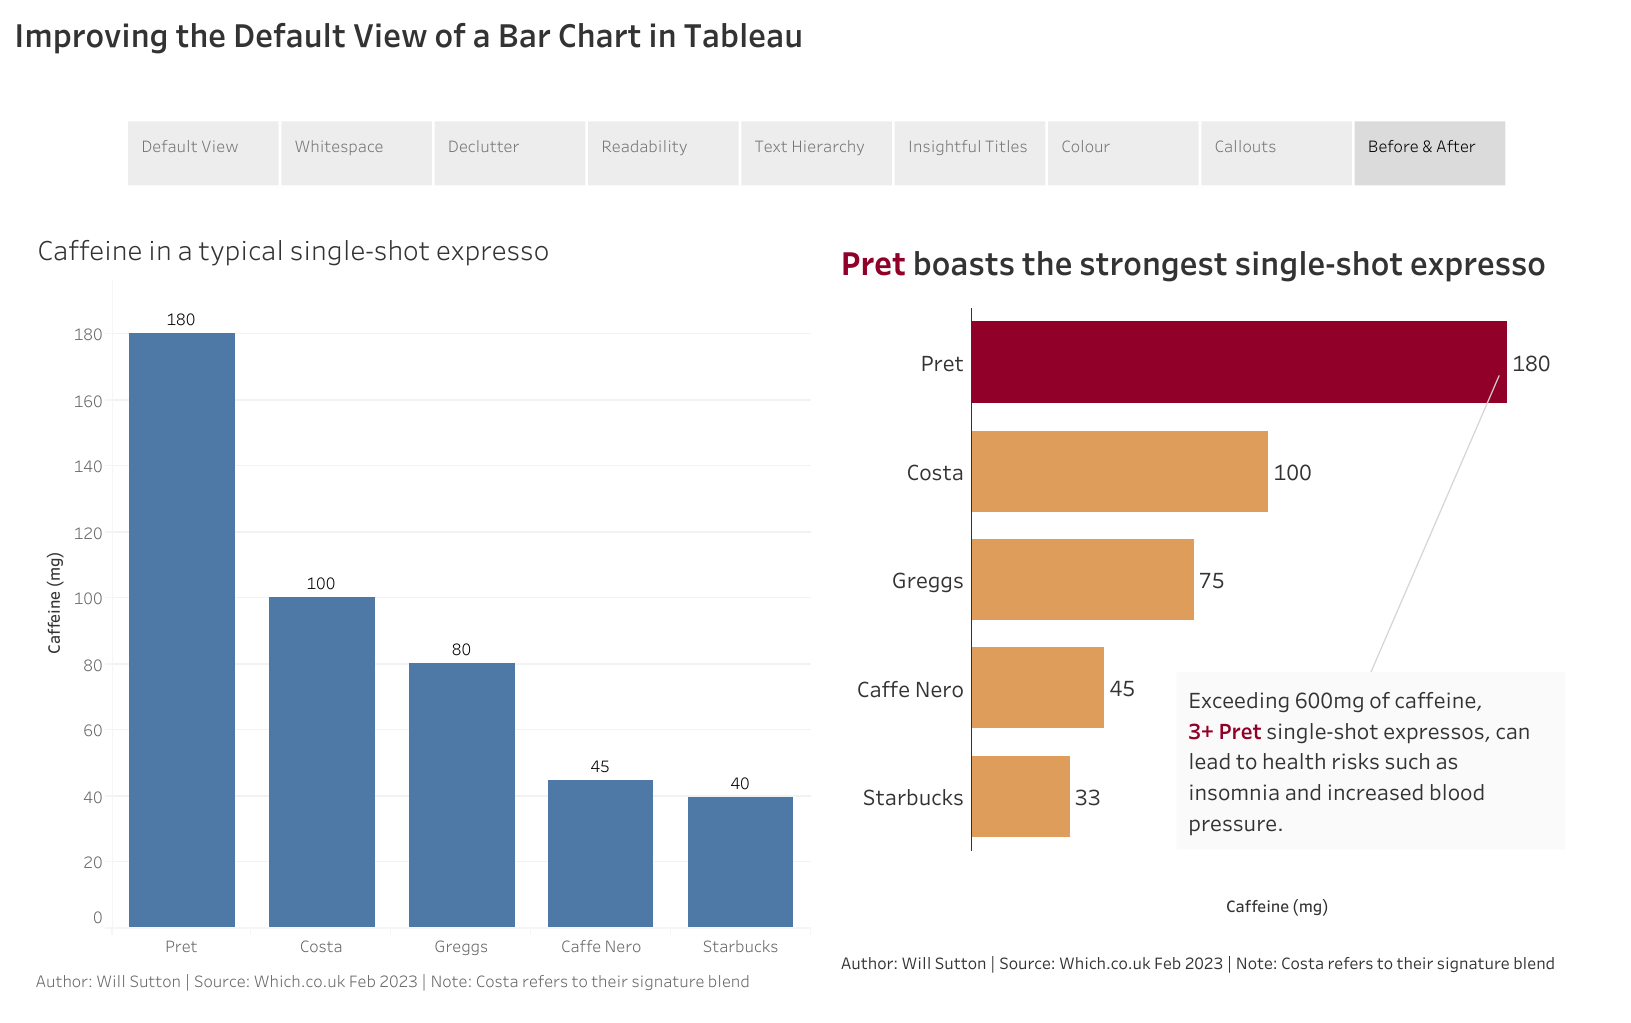
Will Sutton: Improve this Viz | High Street Caffeine | #MakeoverMonday 2023 W9
See the latest Viz of the Day, trending vizzes, featured authors, and more on Tableau Public.
Check out some inspirational vizzes created by the community:
-
Jeff Plattner: Dynamic Zone Visibility Mobile Concept
-
Gabriela Comanescu: How much caffeine is in your coffee? #MakeoverMonday
-
Rosario Gauna: #WOW2023 W09 | A Tricky Filter
-
Hamouchi Imad: Notif Design
-
Will Sutton: Improve this Viz | High Street Caffeine | #MakeoverMonday 2023 W9
Community Projects
Back 2 Viz Basics
A bi-weekly project helping those who are newer in the community and just starting out with Tableau. Not limited just to newbies!
Web: Back 2 Viz Basics
Twitter: #B2VB
Week 4: Build a Box and Whisker Plot
Workout Wednesday
Build your skills with a weekly challenge to re-create an interactive data visualization.
Web: Workout Wednesday
Twitter: #WOW2022
Week 9: A tricky filter
Makeover Monday
A weekly social data project.
Web: Makeover Monday
Twitter: #MakeoverMonday
Week 9: High Street Caffeine Content
Preppin' Data
A weekly challenge to help you learn to prepare data and use Tableau Prep.
Web: Preppin’ Data
Twitter: #PreppinData
Week 9: Customer Bank Statements
DataFam Con
A monthly challenge covering pop culture and fandoms.
Web: DataFam Con
Twitter: #DataFamCon
February 2023: (Reality) Love is in the Air!
EduVizzers
A monthly project connecting real education data with real people.
Web: Eduvizzers
March 2023: Strategic Measure Number of Apprenticeship and Internship Positions Offered by the City of Austin
Games Night Viz
A monthly project focusing on using data from your favorite games.
Web: Games Nights Viz
Twitter: #GamesNightViz
Level 6: The Final Boss
Iron Quest
Practice data sourcing, preparation, and visualization skills in a themed monthly challenge.
Web: Iron Quest
Twitter: #IronQuest
November 2022: Weird or Wonderful
Data Plus Music
A monthly project visualizing the data behind the music we love!
Web: Data Plus Music
Twitter: #DataPlusMusic
Storytelling with Data
Practice data visualization and storytelling skills by participating in monthly challenges and exercises.
Web: Storytelling with Data
Twitter: #SWDChallenge
February 2023: partner up
Project Health Viz
Uncover new stories by visualizing healthcare data sets provided each month.
Web: Project Health Viz
Twitter: #ProjectHealthViz
January 2023: Medicaid Drug Spending 2020
Diversity in Data
An initiative centered around diversity, equity & awareness by visualizing provided datasets each month.
Web: Diversity in Data
Twitter: #DiversityinData
February 2023: BHM & the New Year
Sports Viz Sunday
Create and share data visualizations using rich, sports-themed data sets in a monthly challenge.
Web: Sports Viz Sunday
Twitter: #SportsVizSunday
January 2023: Is it a Sport or a Game?
Viz for Social Good
Volunteer to design data visualizations that help nonprofits harness the power of data for social change.
Web: Viz for Social Good
Twitter: #VizforSocialGood
Sept 2-Sept 30 2022: India Water Portal/Arghyam
Real World Fake Data
Create business dashboards using provided data sets for various industries and departments.
Web: Real World Fake Data
Twitter: #RWFD
Session 5: Diversity Score Card
SDG Viz Project
Visualize data about Sustainable Development Goals provided by the World Health Organization.
Web: SDG Viz Project
Twitter: #TheSDGVizProject
相关故事
Subscribe to our blog
在您的收件箱中获取最新的 Tableau 更新。


